Keep exposure to banks
Earlier this month as CBA’s share price hit its historic highs, the Australian Financial Review opined that on “every reliable measure of valuation, CBA is literally off the charts”. After CBA announced its results, the Australian Financial Review’s Chanticleer highlighted the opinions of equity markets analysts:
- Barrenjoey: “Extremely stretched on every possible measure” and
- Citi: “One of the most expensive banks in the world”
A review of Australian sell-side analysts in Bloomberg shows that CBA has a ‘sell’ recommendation from 15 of 16 analysts, with one lone analyst a ‘hold’.
Chart 1: CBA sell-side price recommendations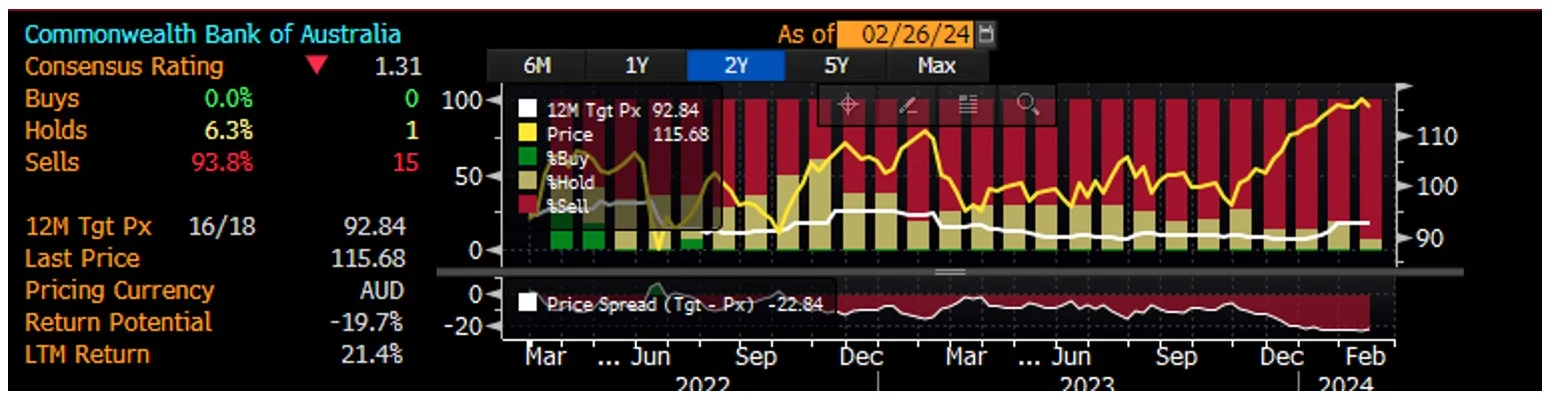
Source: Bloomberg, as at 26 February 2024. This is not a recommendation to act.
This may not be an “only CBA” story. Each of Australia’s ‘Big 4’ banks faces continuing headwinds in 2024. A subdued economic outlook and potential RBA rate cuts could see the Big 4 banks’ Net Interest Margins (NIMs) continue to deteriorate. The chart below shows that while NIMs rose as rates went up last year, they have dipped below 2% again. A reduction in NIMs results in a reduction in cash earnings and will impair the Big 4’s ability to increase dividend payments.
Chart 2: Major Banks’ NIM* (Domestic, half yearly)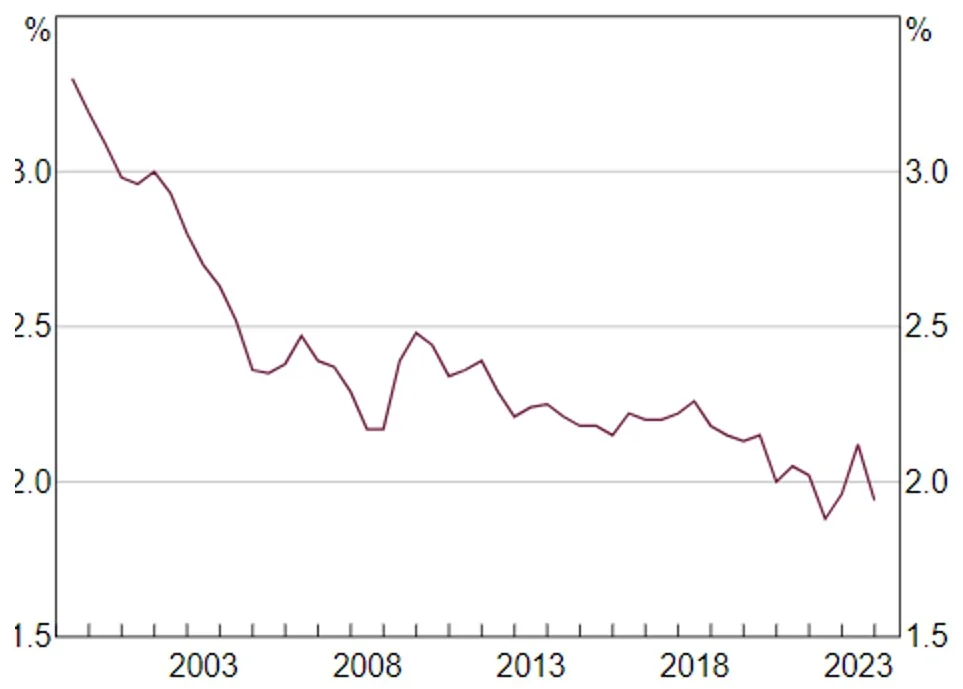
Source: RBA. Data to 1 February 2023, released 7 February 2024.
CBA reported its NIM on the 14th of February as 1.99%. This was 0.11% lower on the prior comparative period and 0.06% down on the second half of the 2023 financial year.
There is no doubt CBA is Australia’s premium banking brand, so it’s important to note that we are not saying sell or short CBA or Australian banks. The ‘big 4’ are an important part of Australian equity portfolios, what we are saying is that it is a risk to have your portfolio overexposed to them, especially if you are in a fund that tracks or measures its performance against the S&P/ASX 200 Index.
This could be one of the advantages of active management, your active manager may already be underweight banks, or maybe not.
There is also another approach that allows Australian investors to retain their exposure to the big four banks while also retaining the low fees of passive investing: Equal weighting.
The equal weight index that the VanEck Australian Equal Weight ETF (MVW) tracks equally weights the largest and most liquid stocks on the ASX at each rebalance. Because of this, at last rebalance, no company was more than 1.31%. MVW’s exposure to the big four banks at that time was only 5.26% (as of 25th February 2024 it was 5.68%).
MVW is being used by savvy investors as a portfolio construction solution that reduces concentration risk to banks and can be deployed to de-risk and diversify with no one security or sector dominating providing a more balanced exposure to Australia’s economy.
In the past, taking an equally weighted approach has been proven to produce outperformance over the long term compared to a benchmark market capitalisation approach as well as providing diversification benefits.
So, let’s walk through the difference between MVW and the S&P/ASX 200.
MVW vs S&P/ASX 200 Index - Top 10 holdings
Below you can see the top 10 companies. The differences are stark. Nearly one-half of the 200-company portfolio is in just 10 companies in the S&P/ASX 200. That means the other 190 companies squeeze into the remaining 50%. The top two companies, including CBA, make up nearly 20%. MVW’s top ten, total just 14.38%, the remaining 85.62% includes 66 companies all roughly equally weighted. The reason MVW’s holdings are not equal below is that it only rebalances back to equal weight each quarter. To see all the holdings in MVW and their weightings click here.
Table 1: Top 10 holdings
|
MVW |
Weight (%) |
S&P/ASX 200 |
Weight (%) |
|
Altium |
1.79 |
BHP Group Ltd |
9.92 |
|
Wisetech Global Ltd. |
1.60 |
Commonwealth Bank of Australia |
8.45 |
|
JB Hi-Fi Limited |
1.60 |
CSL Limited |
6.06 |
|
CAR Group Limited |
1.53 |
National Australia Bank Limited |
4.65 |
|
Goodman Group |
1.52 |
Westpac Banking Corporation |
4.00 |
|
Wesfarmers Limited |
1.52 |
ANZ Group Holdings Limited |
3.74 |
|
Reece Limited |
1.51 |
Wesfarmers Limited |
3.24 |
|
Cochlear Limited |
1.50 |
Macquarie Group, Ltd. |
3.05 |
|
Westpac Banking Corporation |
1.48 |
Woodside Energy Group Ltd |
2.55 |
|
Seven Group Holdings Limited |
1.46 |
Goodman Group |
2.18 |
Source: MVW holdings - FactSet, VanEck, as at 23 February 2024. S&P/ASX200 - FactSet, VanEck, S&P, as at 31 January 2024.
MVW vs S&P/ASX 200 Index - Sectors
MVW is currently underweight the financials’ sector by 9.4% compared to the S&P/ASX 200. It is underweight materials by 6.3%. Conversely, it is overweight industrials by 8.8% and information technology and utilities (both by 1.6%).
Chart 3: S&P/ASX 200 and MVW Index sector weightings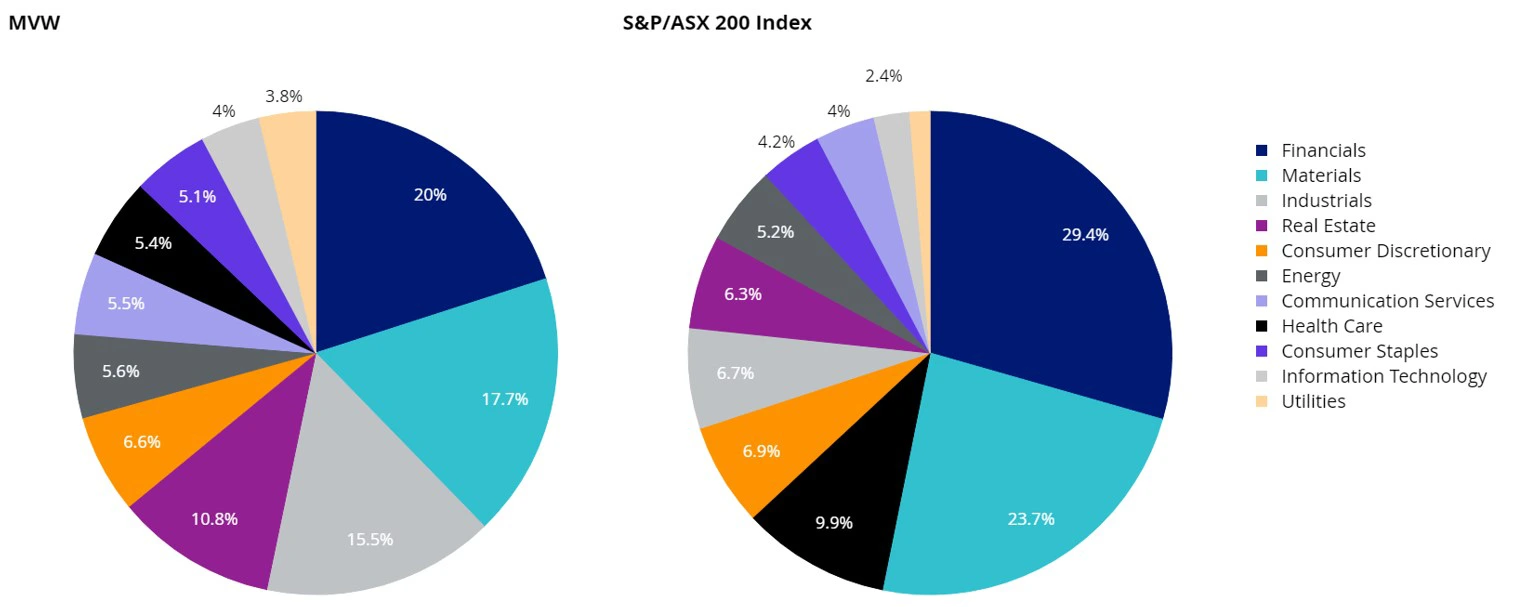
Source: FactSet, 31 January 2024.
MVW vs S&P/ASX 200 - Diversification
A mathematical way to measure diversification of a portfolio is to calculate its Herfindahl Index. This index is a broadly used technique to quantify concentration. When used inversely, this index measures diversification. As of the last rebalance in December 2023, the Herfindahl Index for the S&P/ASX 200 was 342. The equivalent measure for the index MVW tracks was 131. What this means is that the S&P/ASX 200 is over 2.5 times more concentrated than the MVW Index. Or, inversely, the MVW Index is over 2.5 times more diversified than the S&P/ASX 200.
MVW vs S&P/ASX 200 Index - Style
When looking at portfolios it is important to determine what style e.g. value or growth and what size bias a portfolio holds e.g. giant, large, mid or small. Below we can see MVW’s. Importantly MVW holds large companies with a similar Morningstar style of core orientation relative to the S&P/ASX 200, which skews larger (giant) and more toward value.
Chart 4: MVW holdings based style map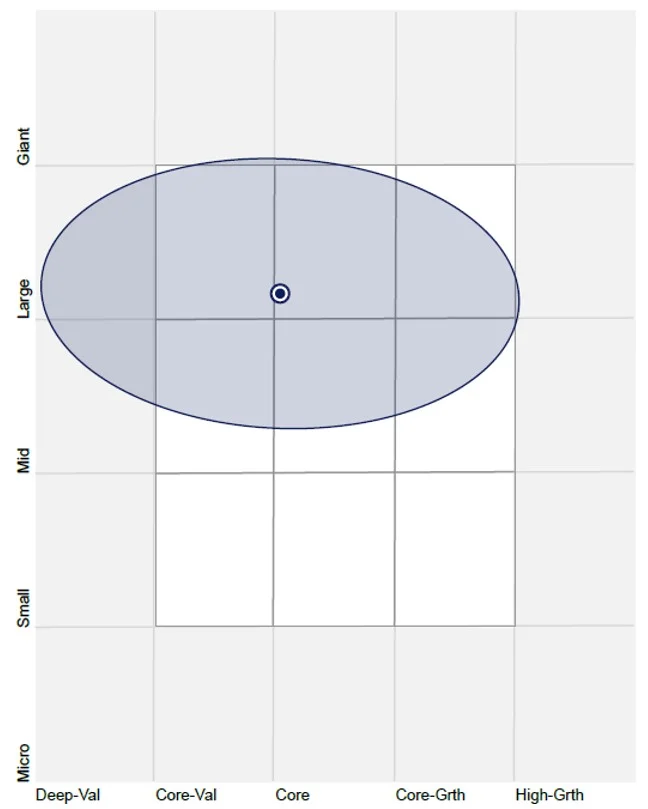
Source: Morningstar Direct, as at 31 January 2024.
Chart 5: S&P/ASX 200 holdings based style map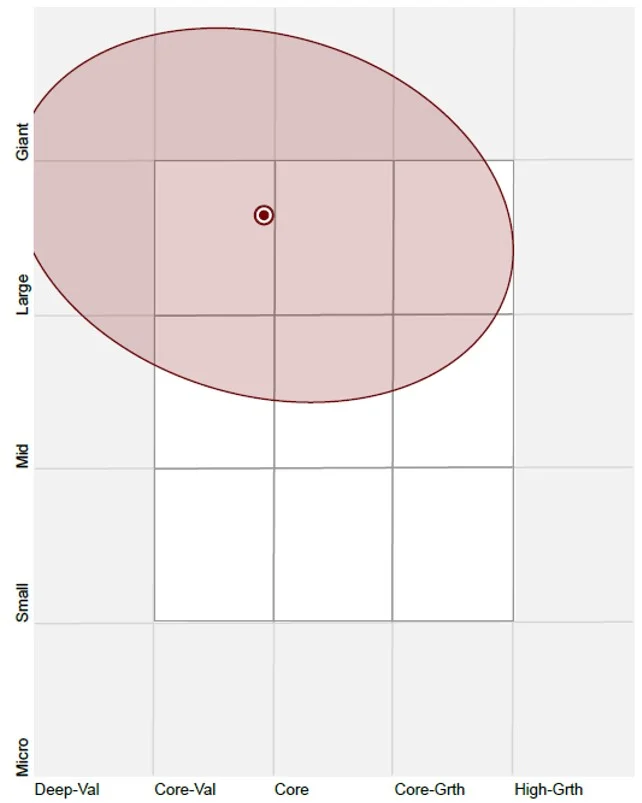
Source: Morningstar Direct, as at 31 January 2024.
MVW vs S&P/ASX 200 - Performance
Equal weight investing has served Australian investors. The month end had just rolled over and as of the end of February 2024, since its inception on ASX in 2014, MVW has outperformed the S&P/ASX 200 by 1.37% p.a. As always, past performance is by no means indicative of future performance.
Chart 6: Cumulative performance since MVW inception date to 29 February 2024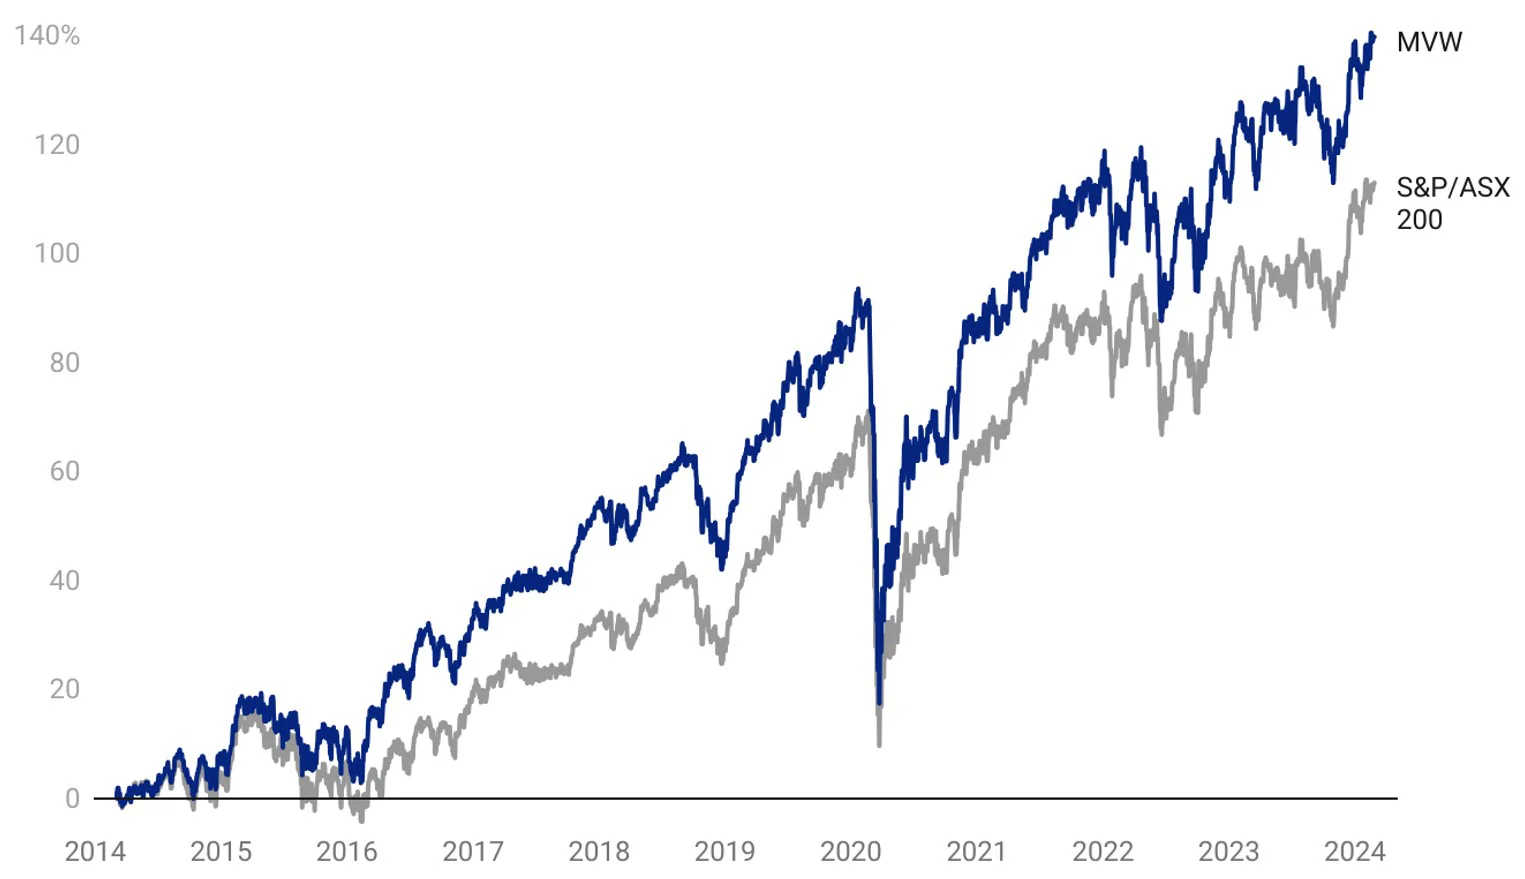
Table 2: Trailing performance to 29 February 2024
|
1 mth (%) |
3 mths (%) |
1 yr |
3 yrs |
5 yrs |
7 yrs |
Since inception |
|
|
VanEck Australian Equal Weight ETF (MVW) |
2.33 |
9.14 |
9.66 |
9.53 |
8.44 |
8.84 |
9.31 |
|
S&P/ASX 200 Accumulation Index |
0.79 |
9.39 |
10.64 |
9.32 |
8.61 |
8.60 |
7.94 |
|
Difference |
+1.54 |
-0.25 |
-0.98 |
+0.21 |
-0.17 |
+0.24 |
+1.37 |
*MVW Inception date is 4 March 2014 a copy of the factsheet is here.
Chart 6 and Table 2 source: Morningstar Direct, VanEck as at 29 February 2024. The chart and table above show past performance of MVW and of the S&P/ASX 200. You cannot invest directly in an index. Results are calculated to the last business day of the month and assume immediate reinvestment of distributions. MVW results are net of management fees and other costs incurred in the fund, but before brokerage fees and bid/ask spreads incurred when investors buy/sell on the ASX. Returns for periods longer than one year are annualised. Past performance is not a reliable indicator of future performance. The S&P/ASX 200 Index is shown for comparison purposes as it is the widely recognised benchmark used to measure the performance of the broad Australian equities market. It includes the 200 largest ASX-listed companies, weighted by market capitalisation. MVW’s index measures the performance of the largest and most liquid ASX-listed companies, weighted equally at rebalance. MVW’s index has fewer companies and different industry allocations than the S&P/ASX 200. Click here for more details.
MVW is being used by savvy investors as their core Australian equity portfolio, around which they add investment ideas. For example, should the economic environment become more favourable for banks, you can add to MVW by buying your preferred bank directly, as a satellite position. Alternatively, you could consider the VanEck Australian Banks ETF.
While each Australian equity approach, equal weight and market capitalisation, has its merit for portfolio inclusion, you should assess all the risks and consider your investment objectives.
This week we also launched a geared Australian equity fund that invests in MVW. For more information on the new fund – click here.
Past performance is no guarantee of future performance. The above is not a recommendation. Please speak to your financial adviser or stock broker.
Key risks
An investment MVW carries risks associated with: ASX trading time differences, financial markets generally, individual company management, industry sectors, country or sector concentration, political, regulatory and tax risks, fund operations and tracking an index. See the PDS for details.


Published: 29 February 2024
Any views expressed are opinions of the author at the time of writing and is not a recommendation to act.
VanEck Investments Limited (ACN 146 596 116 AFSL 416755) (‘VanEck’) is the issuer and responsible entity of all VanEck exchange trades funds (Funds) listed on the ASX. This is general advice only and does not take into account any person’s financial objectives, situation or needs. The product disclosure statement (PDS) and the target market determination (TMD) for all Funds are available at vaneck.com.au. You should consider whether or not an investment in any Fund is appropriate for you. Investments in a Fund involve risks associated with financial markets. These risks vary depending on a Fund’s investment objective. Refer to the applicable PDS and TMD for more details on risks. Investment returns and capital are not guaranteed.
MVIS Australia Equal Weight Index (‘MVIS Index’) is the exclusive property of MV Index Solutions GmbH based in Frankfurt, Germany (‘MVIS’). MVIS is a related entity of VanEck. MVIS makes no representation regarding the advisability of investing in the Fund. MVIS has contracted with Solactive AG to maintain and calculate the MVIS Index. Solactive uses its best efforts to ensure that the MVIS Index is calculated correctly. Irrespective of its obligations towards MVIS, Solactive has no obligation to point out errors in the MVIS Index to third parties.