Miners dig deep for a commodities comeback
Australian resource companies have performed strongly in recent weeks.
Looking ahead, there a several signs that suggest this momentum could continue.
Macro environment turned increasingly supportive
History shows that resources companies are typically pro-cyclical, outperforming the broader market in an environment of stronger growth and rising commodity demand. In Australia, an improving GDP growth outlook alongside recovering imports from China bode well for the sector in the medium to long term.
More broadly, as the global economy is navigating a chapter of renewed protectionism, critical mineral miners, including producers of rare earth, uranium and copper, could see further upside. Gold miners are another focus. They continued to benefit from margin expansion, driven by rising gold price, and bullish demand outlook for the yellow metal.
Chart 1: Resources outperform amid stronger GDP growth

Source: VanEck. Bloomberg. MVR Index is MVIS Australia Resources Index. Performance in AUD. From 31 December 2014 to 31 October 2025. Past performance is not indicative of future performance of the index or MVR.
Valuations remain compelling
Australian resources are currently trading at more reasonable levels relative to their historical levels and are offering more attractive valuations than the S&P/ASX 200, meaning greater potential upside if the current resources rally continues.
Chart 2: 12-month forward price-to-earnings ratio
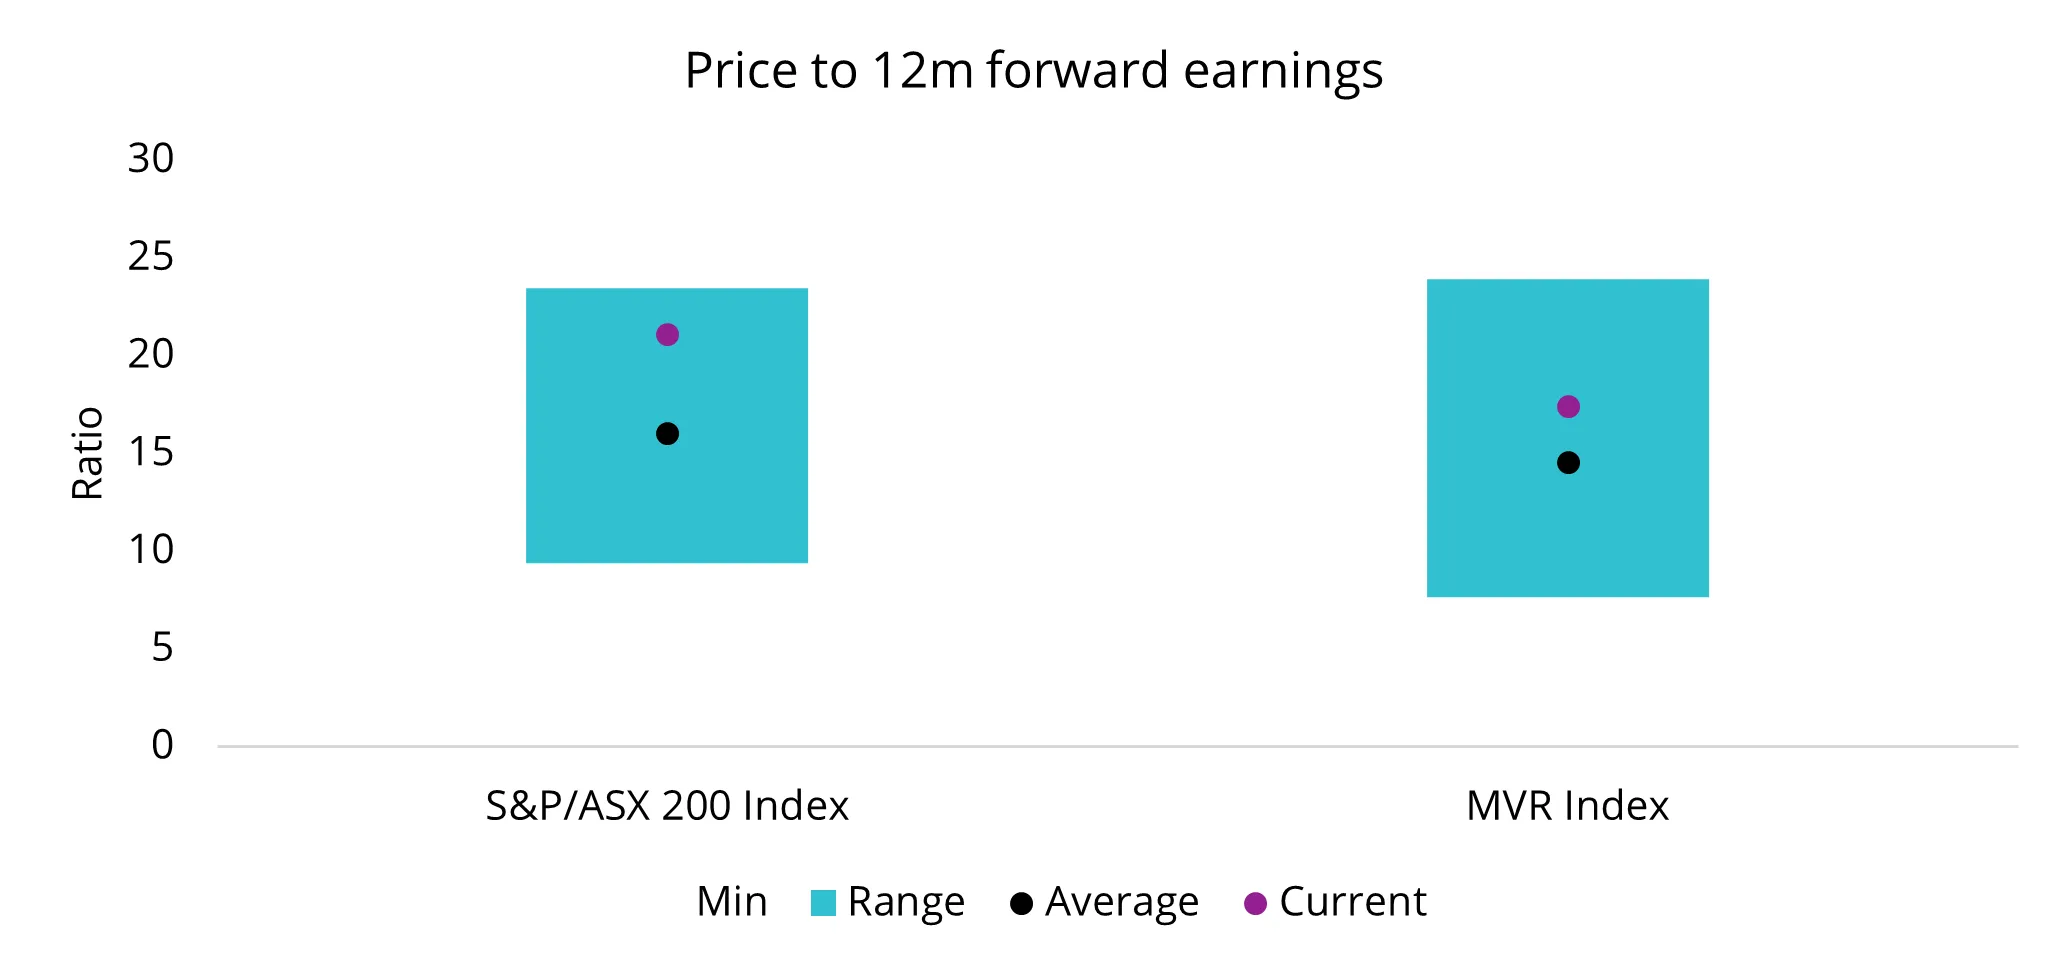
Source: VanEck. Bloomberg. MVR Index is MVIS Australia Resources Index. Date as at 31 October 2025.
Mining stocks in the spotlight
1. Lynas Rare Earth Ltd (ASX: LYC) – up 137% YTD as of 31 October 2025
The escalation of US-China trade conflicts this year has reignited threats of rare earth export restrictions from China, raising concerns on the sustainability of global supply. As the only major rare earth provider outside of China, Lynas has climbed nearly 161% this year as demand for non-China rare earth metals surged. The company has reported a 38% revenue increase over the second quarter this year, the fastest in the past three years. Moreover, street analysts are forecasting a steep growth of revenue in the near term with gross revenue reaching post-COVID levels by early 2026.
With this context, we remain bullish on this company’s outlook, considering geopolitical risk is likely to remain elevated despite on-going tariff negotiations.
Charts 3 & 4: Lynas Rare Earths vs market performance; Revenue outlook
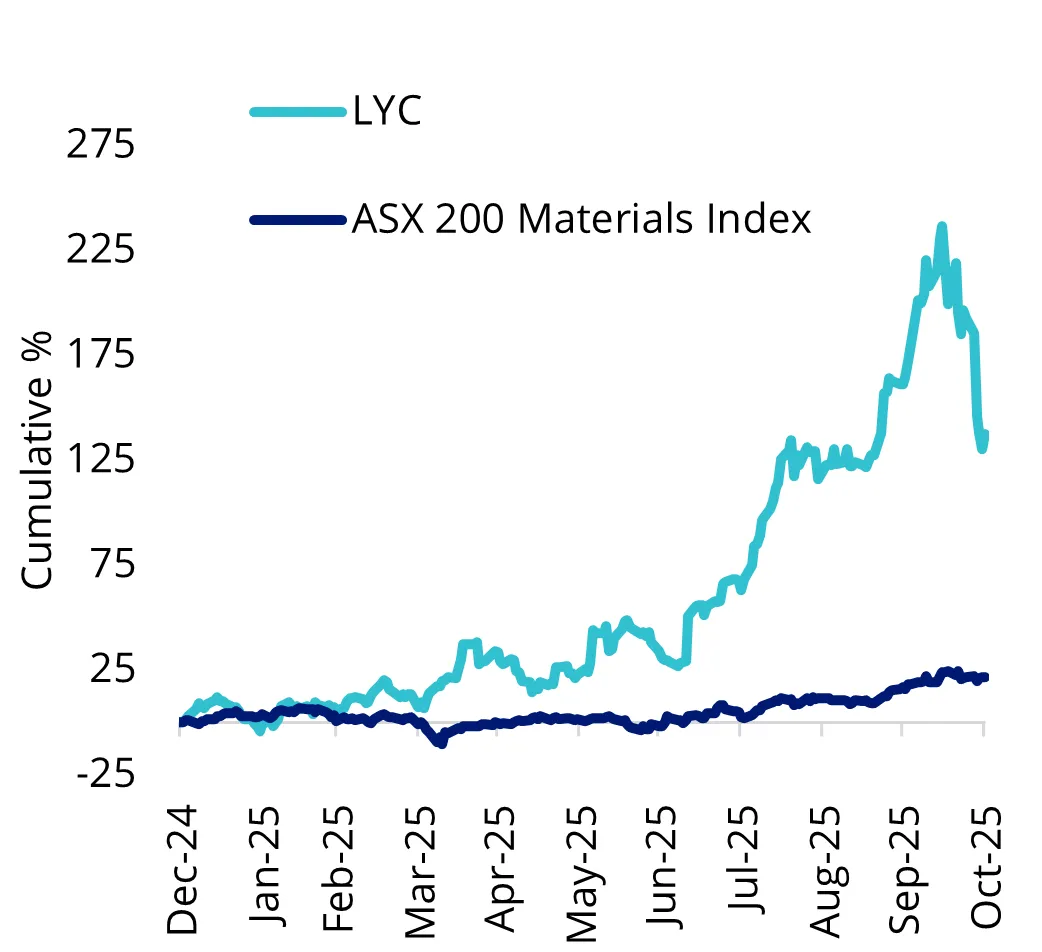
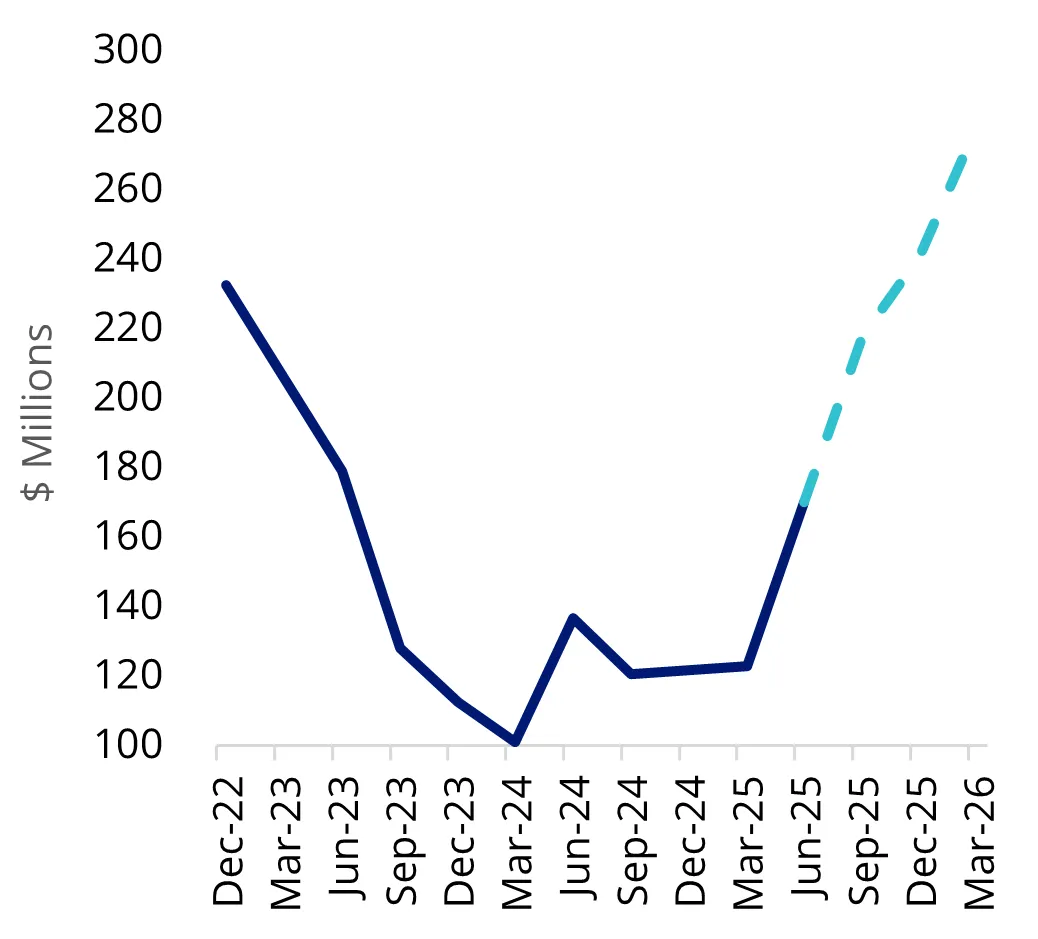
Source: VanEck. Bloomberg. Currency in AUD. Date as of 31 October 2025. Revenue as of 30 September 2025, with forecasts for the next three quarters. Forecasts cannot be guaranteed. Past performance is not indicative of future performance. This is not a recommendation to act.
2. Evolution Mining Ltd (ASX: EVN) – up 132% YTD as of 31 October 2025.
Gold hit a record high in September, and it has been one of the best-performing asset classes so far in 2025. Recently, its price exceeded US$4,200 per ounce.
With mining costs steady, gold miners have benefited from substantial profit margin expansion. As reflected in Chart 6, Evolution Mining has reported increasing profit margins since the 2024 financial year, with estimated margins stabilising at historical highs of around 25% for the coming two years.
With gold miners still trading at discounts to the spot price of gold and macro drivers likely to remain supportive, the risk-reward continues to skew favourably. Over the coming months, we see further upside potential in gold, as well as quality producers such as Evolution Mining, which have reasonable scale, balance sheet strength, and leverage to sustained pricing.
Charts 5 & 6: Evolution Mining vs market performance and profit margin

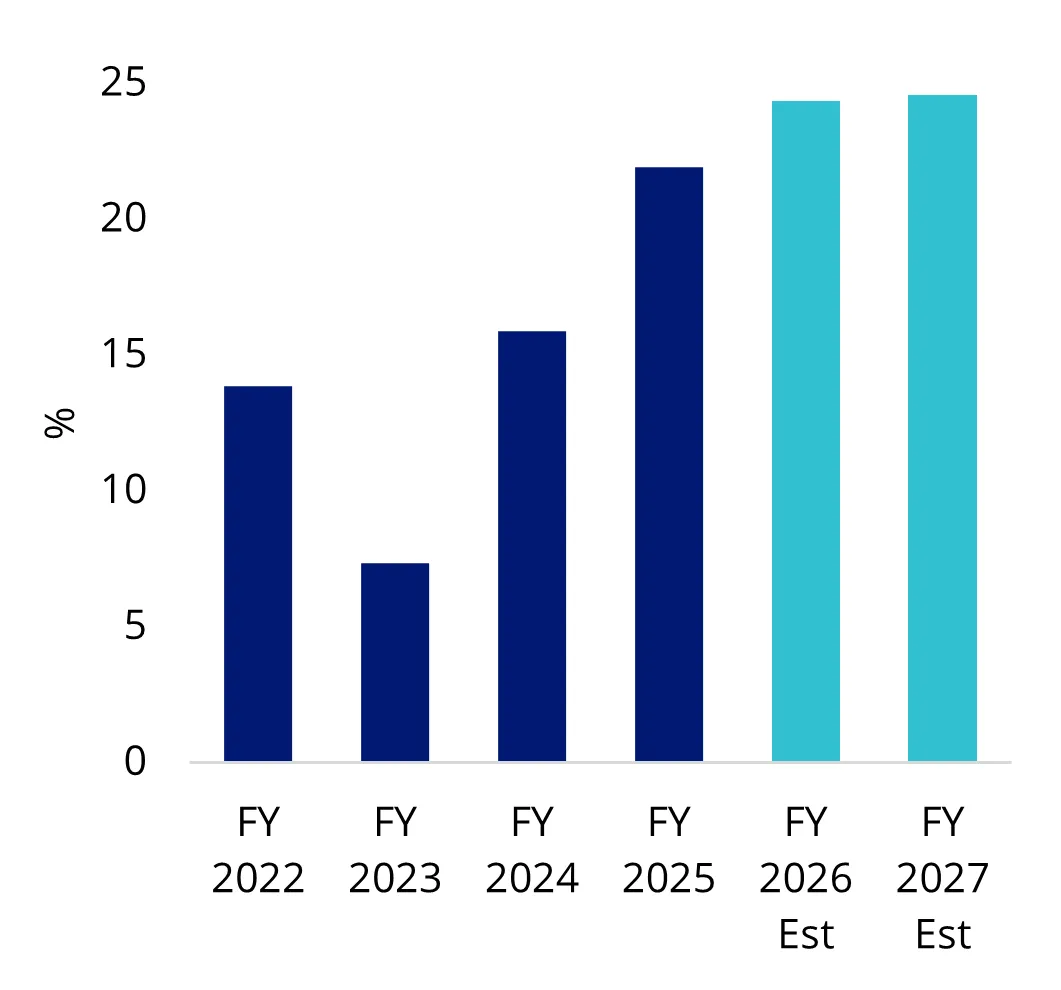
Source: VanEck. Bloomberg. Currency in AUD. Date as of 31 October 2025. Net income profit margin as of 30 June 2025, with forecasts for the next two financial years. Forecasts cannot be guaranteed. Past performance is not indicative of future performance. This is not a recommendation to act.
Investing in Australian resources companies
The VanEck Australian Resources ETF (MVR) provides overweight exposure to mid and small cap miners, and has outperformed both the S&P/ASX 200 and S&P/ASX 200 Resources indices by 20.46% and 6.15% respectively year to date, as at 31 October 2025. This has been driven by several catalysts:
- Gold miners: These companies have been the beneficiary of the gold price surging to an all-time high of US$4,200 per ounce due to elevated geopolitical tensions, tariff-driven stagflation concerns, rising government debt and persistent central bank buying. This momentum has seen profit margins expand.
- Critical minerals: Rare earth, lithium and uranium miners have rallied given their importance to national security and advancements of AI.
- Iron ore miners: On the other hand, the price of iron ore, where MVR is underweight, has remained steady as China’s industrials activity remains subdued.
Chart 7: MVR outperforms resources benchmark and broad-based Australian equities in 2H 2025
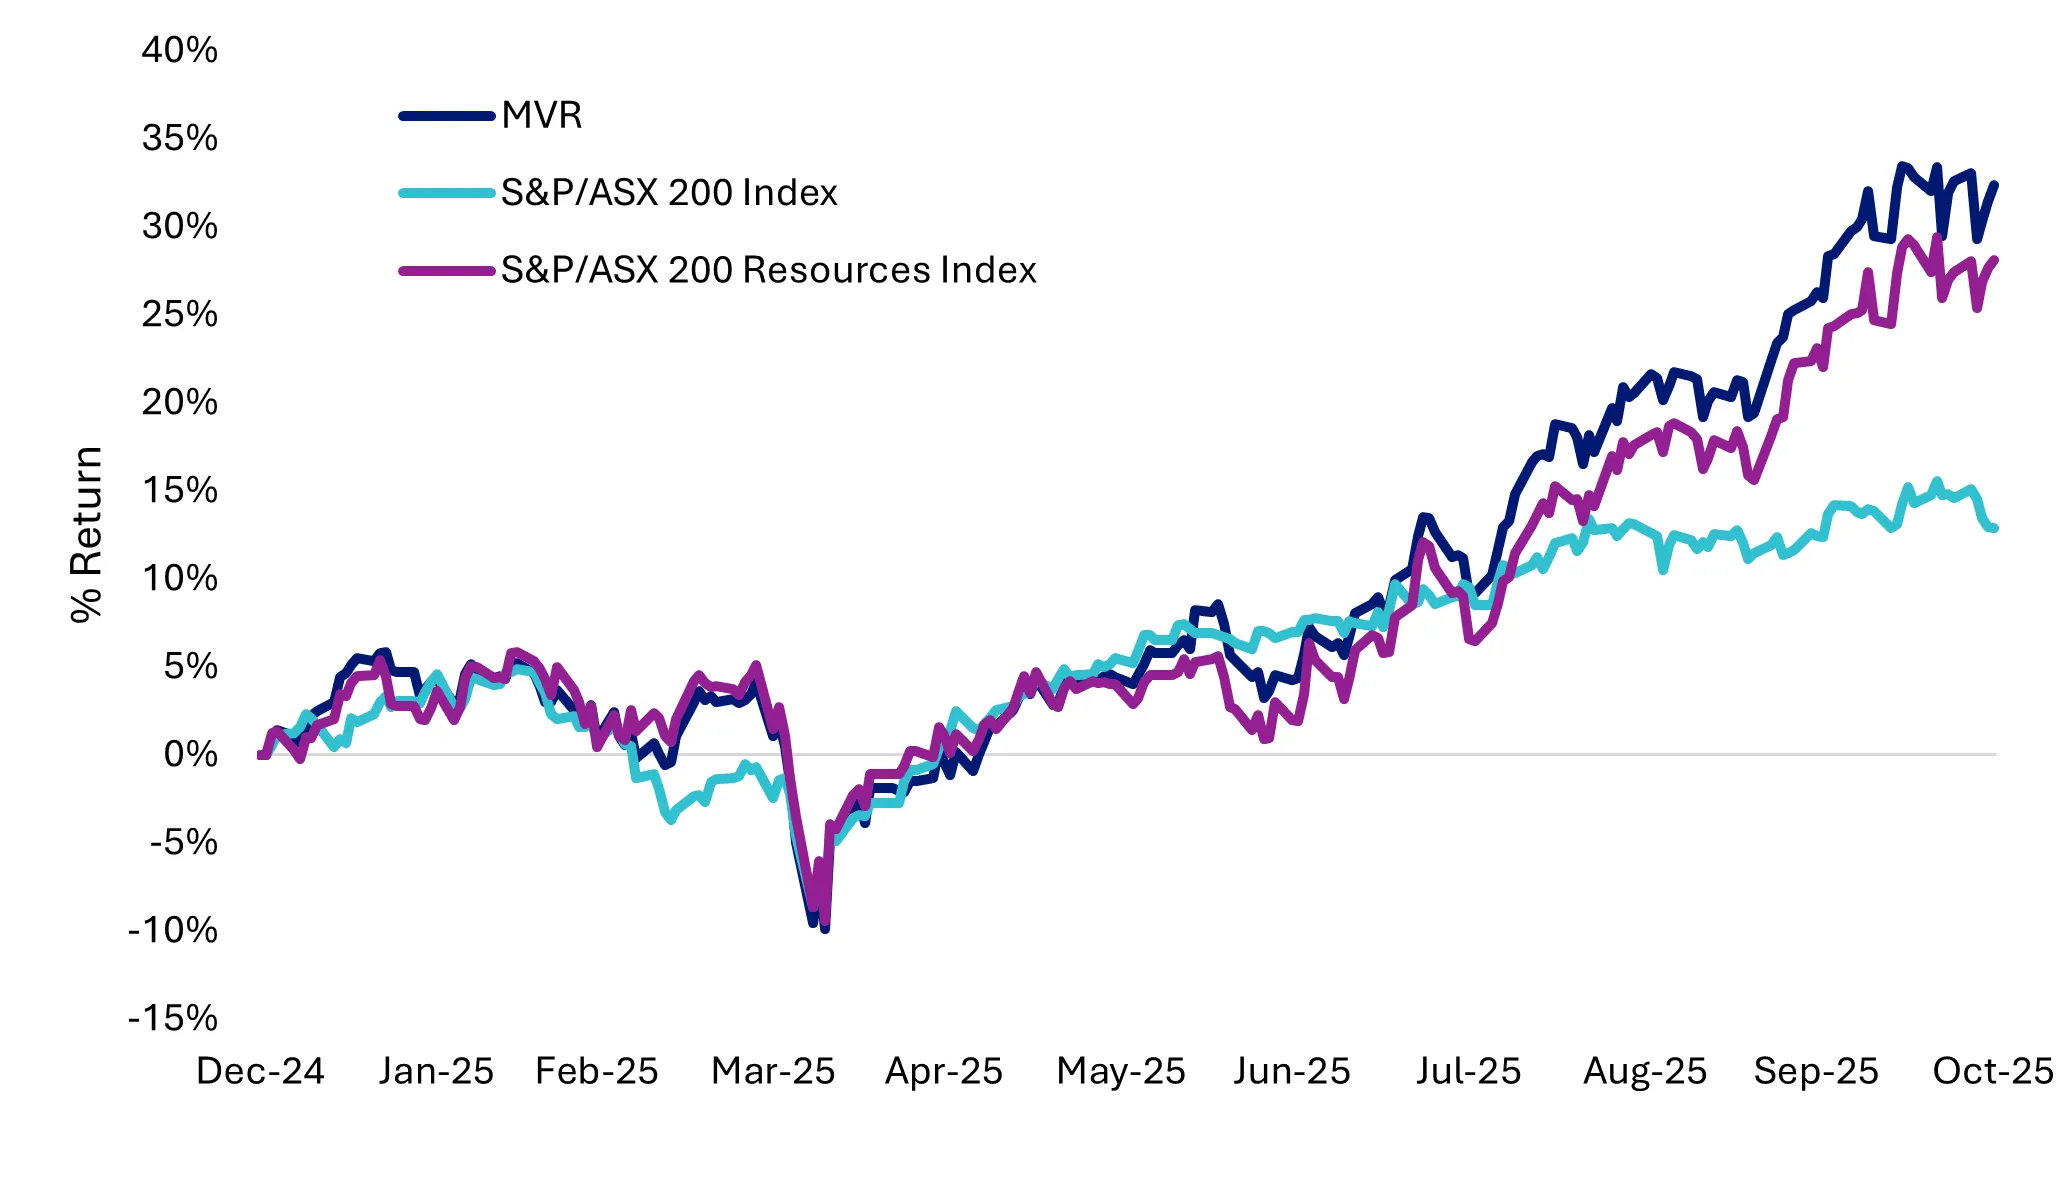
Source: VanEck. Bloomberg. Data from 1 January to 31 October 2025. Performance in AUD. You cannot buy an index. Past performance is not indicative of future performance. Returns assume immediate reinvestment of all dividends and include management fees (where applicable) but exclude brokerage costs and taxes.
The chart below highlights the diversified revenue exposure of MVR, which tracks the MVIS Australian Resources Index.
Charts 8 & 9: MVR revenue by segment breakdown & MVR vs ASX 200 Resources Index
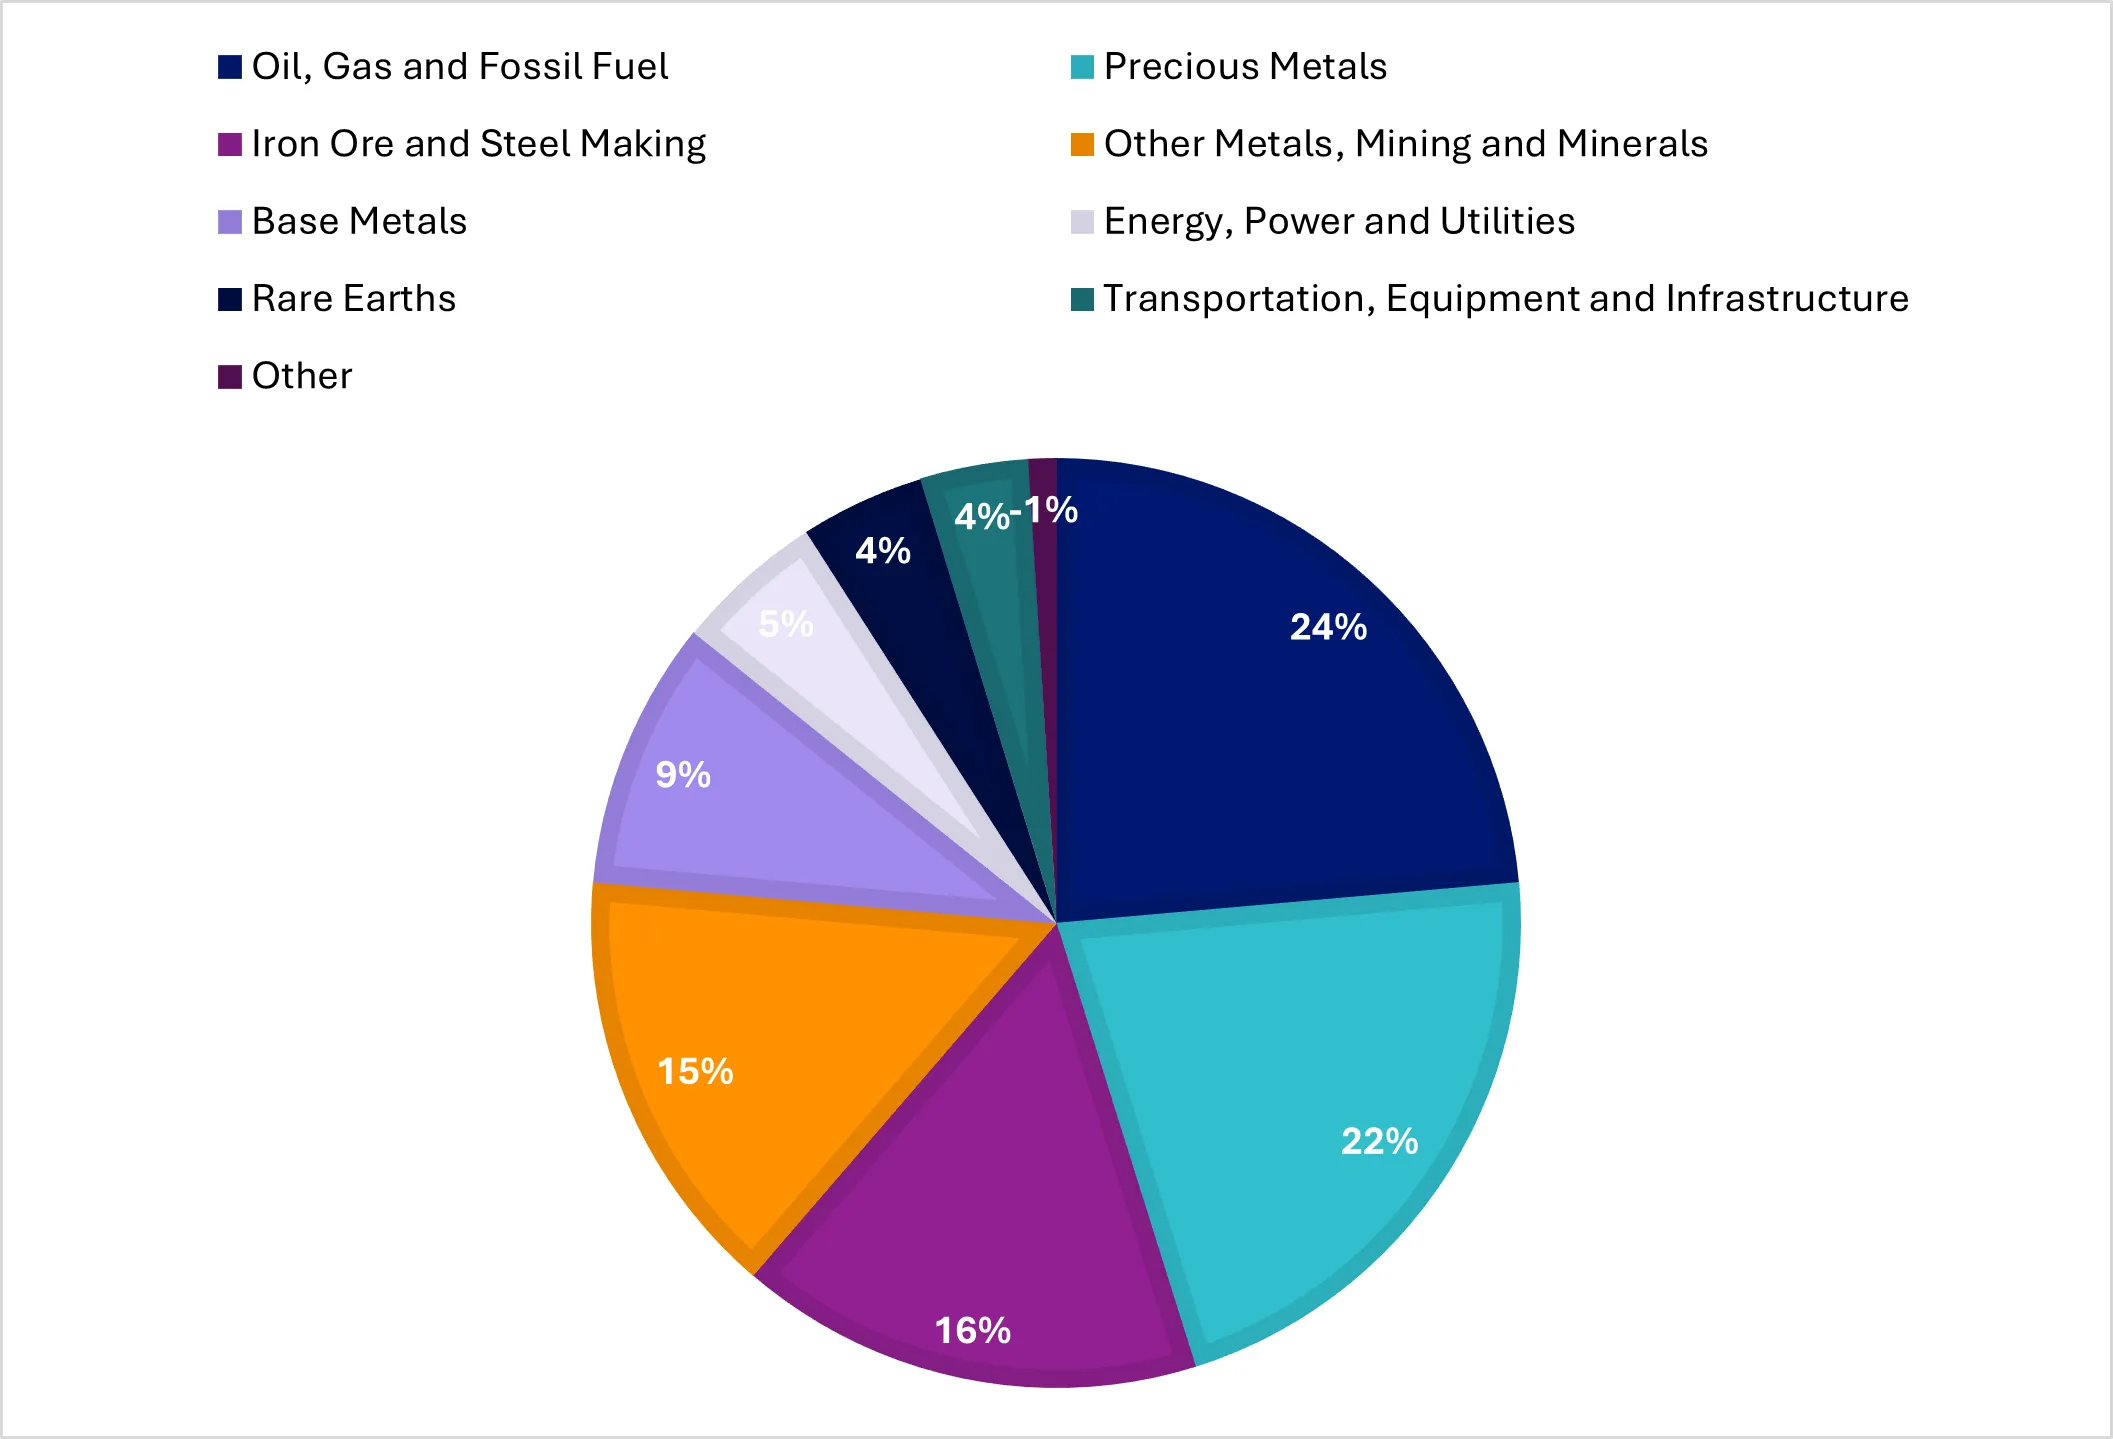

Source: VanEck. FactSet. Data as at 31 October 2025.
Key risks: An investment in our Australian Resources ETF carries risks associated with: financial markets generally, individual company management, industry sectors, stock and sector concentration, fund operations and tracking an index. See the VanEck Australian Resources ETF PDS and TMD for more details.
MVR is likely to be appropriate for a consumer who is seeking capital growth and a regular income distribution, is intending to use the product as a minor or satellite allocation within a portfolio, has an investment timeframe of at least 5 years, and has a high risk/return profile.


Published: 11 November 2025
Any views expressed are opinions of the author at the time of writing and is not a recommendation to act.
VanEck Investments Limited (ACN 146 596 116 AFSL 416755) (VanEck) is the issuer and responsible entity of all VanEck exchange traded funds (Funds) trading on the ASX. This information is general in nature and not personal advice, it does not take into account any person’s financial objectives, situation or needs. The product disclosure statement (PDS) and the target market determination (TMD) for all Funds are available at vaneck.com.au. You should consider whether or not an investment in any Fund is appropriate for you. Investments in a Fund involve risks associated with financial markets. These risks vary depending on a Fund’s investment objective. Refer to the applicable PDS and TMD for more details on risks. Investment returns and capital are not guaranteed.