Why moats matter
The stock market of the biggest economy in the world has both inspired Australian investors in allocating their wealth to household names such as Google, Facebook and Pfizer but also diversified their portfolios to the economic and sector opportunities underrepresented in Australia. Here we provide some insightful analysis for our popular US equity Morningstar Wide Moat ETF (MOAT) versus the US market capitalisation S&P 500 Index.
The stock market of the biggest economy in the world has both inspired Australian investors in allocating their wealth to household names such as Google, Facebook and Pfizer but also diversified their portfolios to the economic and sector opportunities underrepresented in Australia. Here we provide some insightful analysis for our popular US equity Morningstar Wide Moat ETF (MOAT) versus the US market capitalisation S&P 500 Index.
Australian investors have been investing in US equities for some time and the rise of ETFs has increased the opportunity set and further opened the investment landscape. Investing in the largest economy in the world makes sense. The size of the ASX is less than 2% of total assets invested on exchanges globally. No investor should be missing opportunities elsewhere. Some of these opportunities include companies like Google, Facebook, Microsoft and Pfizer. These are all household names but for Australian investors looking to access their growth, these investment propositions have not been readily available on the ASX.
In addition to accessing companies not listed on ASX, investing offshore also gives exposures to sectors underrepresented in Australia such as healthcare and technology. However, not all US companies are desirable from an investment point of view.
One of the most popular ways Australian investors access a dedicated US equities strategy is via a passive fund tracking the benchmark index, the S&P 500.
Innovations in index design for passive funds are delivering above market benchmark returns over the long term while retaining low costs. It is this approach that VanEck offers that is being used by savvy investors as a way to invest in US equities.
At VanEck, we have offered investors opportunities to diversify offshore since 1956. Our approach is synonymous with investing greats Benjamin Graham and his student Warren Buffett’s investment philosophies. Deeply embedded in Warren Buffett’s investing philosophy is the concept of ‘moats’. Buffett is quoted as saying, “In business, I look for economic castles protected by unbreachable ‘moats’”. Morningstar turns the moat investing philosophy into an actionable investment strategy.
The Moat Investing Philosophy
Morningstar assigns each company it analyses an Economic Moat Rating of ‘wide’, ‘narrow’ or ’none’. Companies assigned a wide moat rating are those in which Morningstar has very high confidence that excess returns will remain for 10 years, with excess returns more likely than not to remain for at least 20 years. Companies with a narrow moat rating are those Morningstar believes are more likely than not to achieve normalised excess returns for at least the next 10 years. A firm with either no sustainable competitive advantage or one that Morningstar thinks will quickly dissipate is assigned a moat rating of ‘none’.
Our US equity ETF (MOAT) tracks the Morningstar® Wide Moat Focus Index™ (MOAT Index) that is a rules-based, equal-weighted index intended to offer exposure to attractively priced companies with sustainable competitive advantages according to Morningstar’s equity research team.
So let’s walk through the difference between the MOAT and the market capitalisation index for US equities, the S&P 500 Index.
MOAT vs S&P 500 Index – Fundamentals
Table 1: Statistics and fundamentals
|
|
MOAT |
S&P 500 |
|
Index strategy |
Smart beta |
Market capitalisation weight |
|
Number of holdings |
48 |
500 |
|
12mth trailing Dividend Yield |
1.57% |
1.20% |
|
Dividend frequency |
Annually |
- |
|
Return on equity (ROE) (%) |
23.7 |
18.0 |
|
Financial leverage (debt to equity) (x) |
0.5 |
1.2 |
|
Earnings per share (EPS) growth rate (%) |
23.8 |
15.5 |
|
Price to earnings (x) |
23.6 |
25.2 |
|
Price to book (x) |
4.2 |
4.5 |
|
Price to Sales (x) |
3.4 |
3.8 |
Source: VanEck, MSCI, FactSet, as at 13 September 2021. You cannot invest directly in an index.
As you would expect, MOAT has higher ROE, lower debt to equity and a higher EPS growth rate. MOAT is also more attractive on a price to earnings, price to book and price to sales perspective.
MOAT vs S&P 500 Index - Performance
Moat investing has served Australian investors well. Across all periods, MOAT has outperformed the S&P 500 Index – testament to Moat’s value and quality approach.
Chart 1: Cumulative performance since MOAT ASX listing date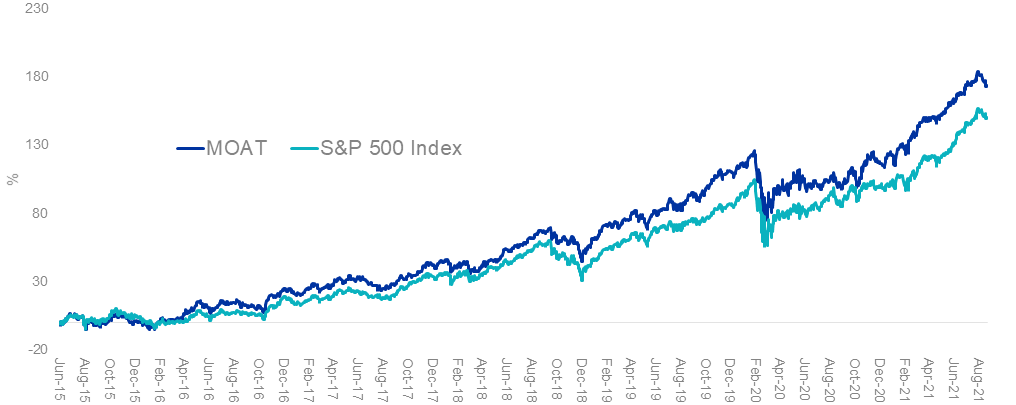
Table 2: Trailing performance
|
YTD (%) |
1 yr (%) |
3 yrs (% p.a.) |
5 yrs (% p.a.) |
Since Inception (% p.a.) |
|
|
MOAT |
26.77 |
37.14 |
17.73 |
19.76 |
17.50 |
|
S&P 500 Index |
25.44 |
33.95 |
16.44 |
18.77 |
15.79 |
|
Outperformance |
+1.33 |
+3.19 |
+1.29 |
+0.99 |
+1.71 |
*ASX Inception date is 26 June 2015
Chart 1 and Table 2 source: Morningstar Direct, VanEck as at 31 August 2021. The chart and table above show past performance of MOAT and of the S&P500 Index. You cannot invest directly in an index. Results are calculated to the last business day of the month and assume immediate reinvestment of distributions. MOAT results are net of management fees and other costs incurred in the fund, but before brokerage fees and bid/ask spreads incurred when investors buy/sell on the ASX. Returns for periods longer than one year are annualised. Past performance is not a reliable indicator of future performance. The S&P 500 is shown for comparison purposes as it is the widely recognised benchmark used to measure the performance of the broad US equities market. It includes the 500 largest US listed companies, weighted by market capitalisation. MOAT’s index measures the performance of 40 to 80 US companies with a Morningstar Economic Moat Rating™ of “Wide”. MOAT’s index has fewer securities and different industry allocations than the S&P 500. Click here for more details.
MOAT vs S&P 500 Index - Top 10 holdings
It has been well documented that the top 10 of the S&P 500 Index have been the drivers of much of the growth of that index. This has led to some unintended concentration within that index, as well as valuation concerns.
Below you can see the top 10 companies. Despite having a tenth of the number of holdings, MOAT’s top 10 make up less than the top 10 of a portfolio of 500 companies. This means that many of the small companies in the S&P 500 do not contribute much to portfolio performance – to see all the holdings in MOAT and their weightings click here. 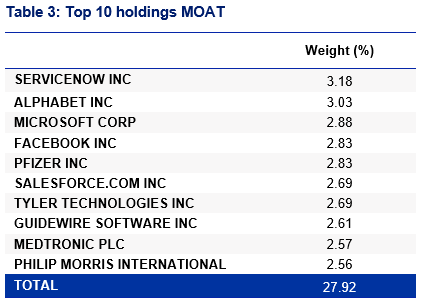
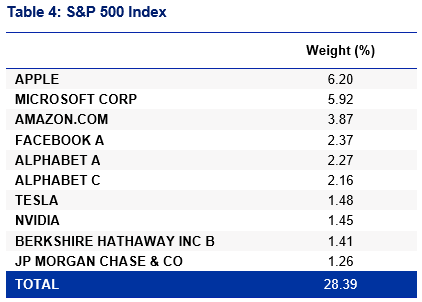
Source: VanEck, S&P, as at 31August 2021
MOAT vs S&P 500 Index - Style
When looking at portfolios it is important to determine what style e.g. value or growth and what size bias a portfolio holds e.g. giant, large, mid or small. Below we can see MOAT’s. Importantly MOAT holds large companies with a core-value orientation relative to the S&P 500 index.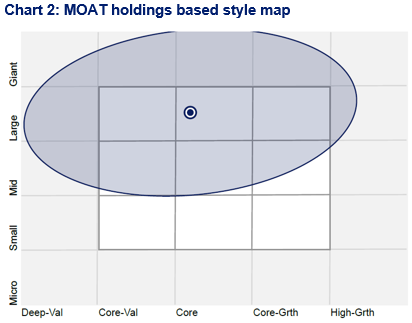
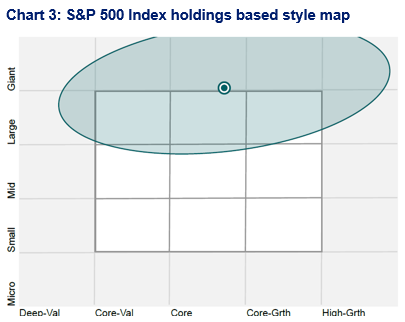
Source: Morningstar Direct, as at 31August 2021
While each US equity index has its merit for portfolio inclusion, you should assess all the risks and consider your investment objectives.
Past performance is no guarantee of future performance. The above is not a recommendation. Please speak to your financial adviser or stock broker.
For further information, visit the MOAT product page, or contact us via email or at +61 2 8038 3300.
Key risks
An investment in MOAT carries risks associated with: financial markets generally, individual company management, industry sectors, ASX trading time differences, foreign currency, country or sector concentration, political, regulatory and tax risks, fund operations and tracking an index. See the PDS for details.
Note: There is no suggestion that Warren Buffett endorses the Morningstar Wide Moat Focus Index or MOAT ETF.


Published: 17 September 2021
No member of the VanEck group of companies guarantees the repayment of capital, the payment of income, performance, or any particular rate of return from any fund.
Effective June 20, 2016, Morningstar implemented several changes to the Morningstar® Wide Moat Focus Index™ construction rules. Among other changes, the index increased its constituent count from 20 stocks to at least 40 stocks and modified its rebalance and reconstitution methodology. These changes may result in more diversified exposure, lower turnover and longer holding periods for index constituents than under the rules in effect prior to this date.