The great value rotation
The ‘value trade’ continues to do well as inflation concerns, whether you think it is transitory or real, point to rate rises and tapering of quantitative easing.
Europe is the most recent region to be hit by supply issues leading to price rises. The Eurozone’s input costs rose for manufacturers and services at their sharpest rate since 2000 with input price inflation in manufacturing sitting at close to all-time highs, according to IHS Markit’s monthly purchasing managers’ survey. Energy supply issues across the region have culminated in Boris Johnson calling in the Army as panic buyers flooded UK service stations. UK Gilts have been sold off after the latest Bank of England Meeting.
The yield on US Treasuries has been rising to levels not seen since June. This follows the most recent FOMC ‘dot plot’ forecasts whish showed that nine out of 18 members of the committee anticipate a rate rise by late next year, up from seven in June. Inflation, coupled with low economic growth are the characteristics of stagflation and it was a hallmark of the rescissions of the 1970s and early 1980s.
It was in these environments that value outperformed growth as it has been recently. Value stocks are less sensitive to changes to macroeconomic conditions and have a history of emerging as the winning ‘factor’ following a recession.
The threat of stagflation
Stagflation is characterised by periods of high inflation and low economic growth. We could be heading into a period of stagflation now, with pressure on inflation, but growth benign. Stagflation was a hallmark of the economy in the 1970s and early 1980s that experienced inflation at eight per cent, on average, and frequent returns to recessions. This era was an immense challenge for central banks and governments as increasing interest rates to curb inflation, resulted in higher unemployment and slower economic growth.
Chart 1: US CPI by recession periods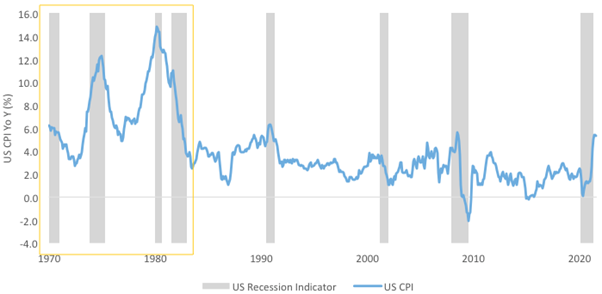
Source: Bloomberg, National Bureau of Economic Research (NBER), Bureau of Labor Statistics, US CPI Urban Consumers YoY as US CPI.
The threat of stagflation has returned
Now, US inflation exceeds 5 per cent for the first time since 2008, well above US Federal Reserve’s long-term target of two per cent. Markets and US Federal Reserve have so far shrugged off this concern, citing that the drivers are “transitory” as opposed to persistent, expecting inflation to “cool off”. We call this ‘inflacency’ in our recent ViewPoints – you can read that here.
The US Federal Reserve has committed to keeping rates lower for longer, though some form of tapering of quantitative easing is expected. The most recent FOMC ‘dot plot’ forecasts which showed that nine out of 18 members of the committee anticipate a rate rise by late next year, up from seven in June. The question markets are considering is what if the Fed is moving too slowly.
COVID-19 has disrupted supply chains. Companies are reporting significant input price pressures, notably higher wages, raw material prices and transportation costs. World shipping container costs have jumped over 400% in a year. These observations have surprised economists on the upside (see chart 2) as represent by Citi’s US Inflation surprise index.
Delta variant of coronavirus has also dented the global economic recovery. August US non-farm payroll print was below forecasts and it the first time in two years economic figures broadly have undershot expectations (see chart 3).
Chart 2: Citi US Inflation Surprise Chart 3: Citi US Economic Surprise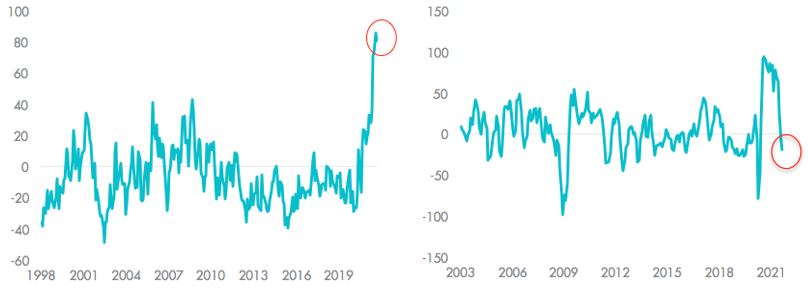
Charts 2 & 3: Sources: Citi, Bloomberg.
The combination of high inflation and lower economic growth points to stagflation.
The impact of stagflation on equity markets
The 1970s and early 1980s was the era for value investment managers. Value companies outperform when inflation and interest rates increase, as they are less sensitive to changes in macro-economic conditions.
Chart 4 - Five year per annum performance comparisons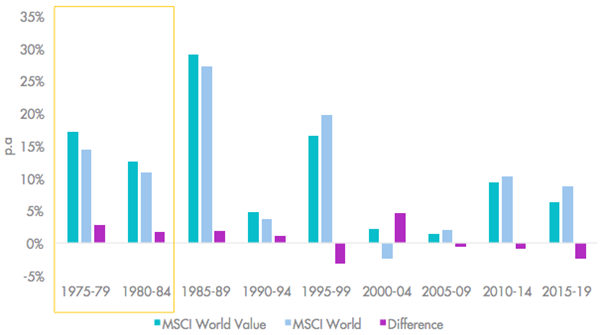
Source: Bloomberg. MSCI, MSCI World Value index inception 31 December 1974.
Given this, investors seeking to tap the current trends should consider investing in a portfolio of international value shares.


Published: 06 October 2021