Gold Ready to Cushion Hard Landing
After gold’s breakout, we expect it to consolidate around the US$1,400 level before a new trend develops. Heading into 2020, we believe a hard landing across the markets cannot be ruled out, which may highlight gold’s safe haven behavior.
Testing new technical levels
The gold price experienced a significant, and possibly historic breakout in June. We have commented extensively about the long six-year base that had formed around the price of gold in the US$1,200 to US$1,300 per ounce range. The technical price ceiling over this base period was US$1,365 per ounce. In June, gold blew through two formidable technical barriers. The first was US$1,365 on June 20, followed by US$1,400 the next day. It reached a six-year high of US$1,439 on June 28 and ended the month at US$1,409.55 for a gain of US$103.97 (8.0%).
The breakout in gold prices was a global effort. The move through the technical barriers at US$1,365 and US$1,400, as well as the US$1,439 high, all occurred during Asian trading hours. Support and momentum continued as trading moved to London and New York. Holdings in global bullion ETFs climbed to six-year highs, and June saw the largest monthly inflows in three years.
Gold stocks came to life, and the earnings leverage to the gold price that they are known for, historically, was on full display. The NYSE Arca Gold Miners Index jumped by 17.4%, its highest level in nearly three years. The MVIS Global Junior Gold Miners Index gained 17.8% to reach a 21-month high.
“Race to the bottom” fuels fundamentals
There were several fundamental drivers that enabled gold to break out. Gold saw gains early in the month from continuing US-China trade tensions, as well as comments from US Federal Reserve (Fed) officials voicing concerns over the economy. Throughout the month, there was a steady stream of weakening manufacturing data, beginning with the Institute for Supply Management (ISM) Purchasing Managers’ Index (PMI) in the US and German industrial production. Chinese authorities were also reported to be trying to contain the fallout from the failure of Baoshang Bank, as brokerages and asset managers were looking to restrict trading due to possible counterparty risks. Then the European Central Bank (ECB) indicated rate cuts are likely in the absence of any improvement in the economy. Markets later became convinced the Fed would also cut rates in the second half following the June 19 Federal Open Market Committee (FOMC) statement and press conference, which expressed a more dovish outlook. VanEck Chief Economist Natalia Gurushina characterised the situation as “a race to the bottom among major central banks.” All of this created a consensus shift in investor sentiment and outlook for weaker growth, hence increasing risks.
Supporting gold were lower interest rates as five-year US Treasuries now carry a real (inflation adjusted) rate of 0%. Ten-year German bunds fell to a record low -0.3%. The US dollar weakened, with the US Dollar Index (DXY) falling through near-term support levels.
Hard landing cannot be ruled out
Gold is consolidating its strong gains, as China and the US agree to resume trade talks, and the S&P 500 touched new all-time highs. The gold market is now transitioning from a six-year sideways price trend. We expect to continue consolidating at around the US$1,400 level till most of August, before a new trend develops. Heading into 2020, we see one of two scenarios playing out across the markets:
- Soft landing – Manufacturing has been weak and on the verge of recession in China, Europe and now the US A soft landing would occur if the global stimulus widely expected from central banks is able to keep a manufacturing recession from morphing into a broader recession across the entire economy. Averting a recession would be bullish for the stock market, interest rates would find a bottom, and the dollar would likely stabilise or strengthen. This might limit the upside for gold. In this scenario, we might see gold establish a new price range, supported by geopolitical risks and central bank demand.
- Hard landing – A hard landing occurs if the current manufacturing recession transitions into a broader economic recession, causing central banks to suffer a loss of confidence. US rates would likely fall to zero or less, and the stock market might enter a correction, while financial risks escalate. Central banks may restart quantitative easing (QE) or initiate other more radical policies. In this scenario, gold would probably form a positive price trend as a safe haven investment.
Last December, the Fed likely completed a rate hiking cycle that lasted three years. The current expansion is now the longest on record, as is the bull market in stocks. Since 1950, a recession has followed 10 of 13 hiking cycles, while three ended in a soft landing. The chart below shows the last recession started three months after the Fed’s first rate cut in September 2007, while the S&P 500 peaked in October 2007. The prior recession started two months after the first rate cut in January 2001
Historical U.S. Rate Hiking Cycles and Recessions
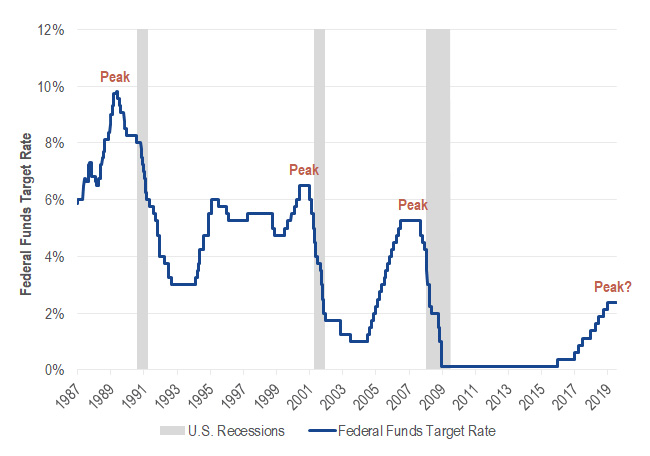
Source: VanEck, Bloomberg
While we are hopeful for a soft landing, a hard landing cannot be ruled out. The market is expecting a new cycle of rate cuts beginning in the second half of the year. Most people take out insurance on their houses, spouses, boats and cars, and the history of hard landings suggests it might be time to think about financial insurance. UBS found that over the last three decades, gold gained in four out of five periods when the Fed was cutting rates.
Gold could gain from dangerous debt levels
Recessions aren’t necessarily gold drivers; however, the financial stress that often accompanies recessions can bring a bull market for gold and gold stocks. Debt or overleverage is usually the culprit, as was seen with subprime mortgages in 2008. The chart below shows the household debt bubble of the last cycle has been replaced by a sovereign debt bubble and also a possible corporate debt bubble.
U.S. Debt to GDP
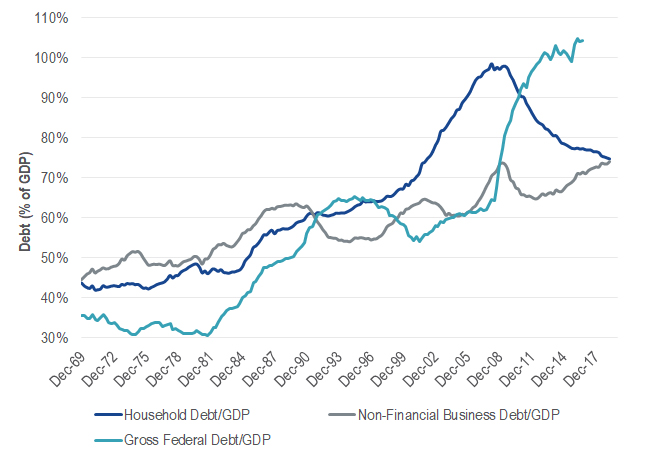
Source: VanEck, Bloomberg
Sovereign debt surged following the financial crisis. Republicans used to be deficit hawks; however, since Trump was elected, deficits have been used to fund tax cuts and more spending. Few in Washington seem concerned, and perhaps it is a reflection of the mood evolving across the country. A Pew Research Center survey found 48% of Americans said deficit reduction should be a priority, compared with 72% in 2013. Trillion-dollar shortfalls are expected next year and beyond. In a recession, receipts decline and expenses increase, so the shortfall grows further. With no end in sight, we believe there would eventually be a breaking point when foreign and/or domestic investors would no longer buy US Treasuries in such quantities. At that point, Treasury rates rise, US credit may get downgraded, and the US dollar may collapse. No one knows when we will reach the breaking point, but a recession increases the likelihood.
The second potential debt problem is corporate. As a percentage of GDP, the chart shows corporate debt has now surpassed the peak of the last cycle in 2009. The key risk in this cycle is lower credit standards. The amount of triple-B rated US corporate debt – the lowest category of investment grade – has more than doubled since the crisis. It now accounts for 55% of the investment-grade market. Morgan Stanley figures that in a downturn, over US$1 trillion of this debt is at risk of being downgraded to junk status. Many funds unable to hold junk debt would be forced to sell.
Another source of risk is the US$1.3 trillion leveraged lending market, which are often packaged into collateralised loan obligations (CLOs). 80% of corporate leveraged loans have weak debt covenants, up from 6% in 2006. While banks are in better financial shape since the crisis, 85% percent of leveraged debt is held by non-banks. This suggests that significant systemic risk now rests outside of the banking sector.
As gold advocates, we focus on the risks to the financial system that may impact investment portfolios. In our view, it seems the potential for a hard landing is growing. Meanwhile, we believe debt and poor credit quality have reached levels that may bring another financial crisis.
IMPORTANT DISCLOSURE
Issued by VanEck Investments Limited ABN 22 146 596 116 AFSL 416755 (‘VanEck’). VanEck is a wholly owned subsidiary of Van Eck Associates Corporation based in New York, United States. VanEck Vectors ETF Trust ARBN 604 339 808 (the ‘Trust’) is the issuer of shares in the VanEck Vectors Gold Minders index ETF (‘US Fund’). The Trust and the US Fund are regulated by US laws which differ from Australian laws. Trading in the US Fund’s shares on ASX will be settled by CHESS Depositary Interests (‘CDIs’) which are also issued by the Trust. The Trust is organised in the State of Delaware, US. Liability of investors is limited. VanEck Associates serves as the investment adviser to the US Fund. VanEck, on behalf of the Trust, is the authorised intermediary for the offering of CDIs over the US Fund’s shares and issuer in respect of the CDIs and corresponding Fund’s shares traded on ASX.
This information contains general advice only about financial products and is not personal advice. It does not take into account any person’s individual objectives, financial situation or needs. Investing in international markets has specific risks that are in addition to the typical risks associated with investing in the Australian market. These include currency/foreign exchange fluctuations, ASX trading time differences and changes in foreign laws and tax regulations. Before making an investment decision in relation to a fund, you should read the PDS and with the assistance of a financial adviser consider if it is appropriate for your circumstances. The PDS is available at www.vaneck.com.au or by calling 1300 68 38 37.
Past performance is not a reliable indicator of future performance. No member of the VanEck group of companies or the Trust gives any guarantee or assurance as to the repayment of capital, the payment of income, the performance or any particular rate of return from the US Fund.
An investment in the US Fund may be subject to risks that include, among others, competitive pressures, dependency on the price of gold and silver bullion that may fluctuate substantially over short periods of time, periods of outperformance and underperformance of traditional investments such as bonds and stocks, and natural disasters, all of which may adversely affect the US Fund. Foreign investments are subject to risks, which include changes in economic and political conditions, foreign currency fluctuations, changes in foreign regulations, and changes in currency exchange rates that may negatively impact the US Fund’s return. Small- and medium- capitalisation companies may be subject to elevated risks. The US Fund’s assets may be concentrated in a particular sector and may be subject to more risk than investments in a diverse group of sectors.
NYSE Arca Gold Miners Index is a trademark of ICE Data Indices, LLC or its affiliates (“ICE Data”) and has been licensed for use by VanEck in connection with the US Fund. Neither the Trust nor the Fund is sponsored, endorsed, sold or promoted by ICE Data. ICE Data makes no representations or warranties regarding the Trust or the Fund or the ability of the NYSE Arca Gold Miners Index to track general stock market performance.
ICE DATA MAKES NO EXPRESS OR IMPLIED WARRANTIES, AND HEREBY EXPRESSLY DISCLAIMS ALL WARRANTIES OF MERCHANTABILITY OR FITNESS FOR A PARTICULAR PURPOSE WITH RESPECT TO THE NYSE ARCA GOLD MINERS INDEX OR ANY DATA INCLUDED THEREIN. IN NO EVENT SHALL ICE DATA HAVE ANY LIABILITY FOR ANY SPECIAL, PUNITIVE, INDIRECT, OR CONSEQUENTIAL DAMAGES (INCLUDING LOST PROFITS), EVEN IF NOTIFIED OF THE POSSIBILITY OF SUCH DAMAGES.
Please note that the information herein represents the opinion of the author, but not necessarily those of VanEck, and this opinion may change at any time and from time to time. Non-VanEck proprietary information contained herein has been obtained from sources believed to be reliable, but not guaranteed. Not intended to be a forecast of future events, a guarantee of future results or investment advice. Historical performance is not indicative of future results. Current data may differ from data quoted. Any graphs shown herein are for illustrative purposes only. No part of this material may be reproduced in any form, or referred to in any other publication, without express written permission of VanEck.


Published: 12 July 2019