VanEck reasserts case for gold investing as price hits all-time highs
Gold prices have reached all-time highs in recent days, and we believe signs point to a longer sustained secular rally.
Our outlook has been bullish on gold since last summer, and the case for investing in gold has not been this compelling in years. Gold prices have reached all-time highs in recent days, surpassing the previous high set in September 2011, and we believe current price trends suggest a longer, sustained rally in gold, similar to the 2001-2008 secular rally.
We think the best guidance for the current gold market is to look at prior gold bull markets.
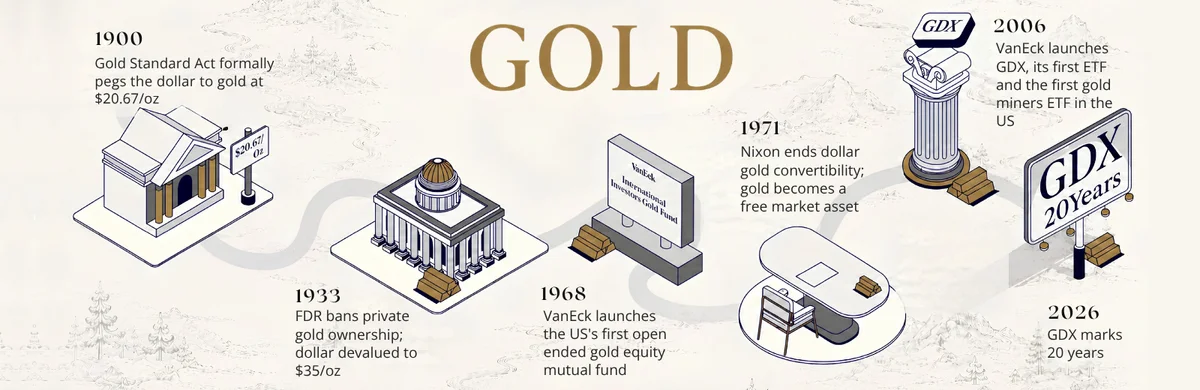
Since 1968, when gold was US$35 per ounce, gold bull markets have fallen into two categories: inflationary and deflationary. We don’t see inflation spiking to 5% to 10% in the near future, like in the 1970’s, so we believe this is a deflationary cycle. Deflationary conditions imply smaller negative real interest rates compared to the high inflation negative real interest rates of the 1970s—and therefore, we believe we will see a more modest price increases in gold than the 1970s.
Gold Price vs. Real Interest Rates
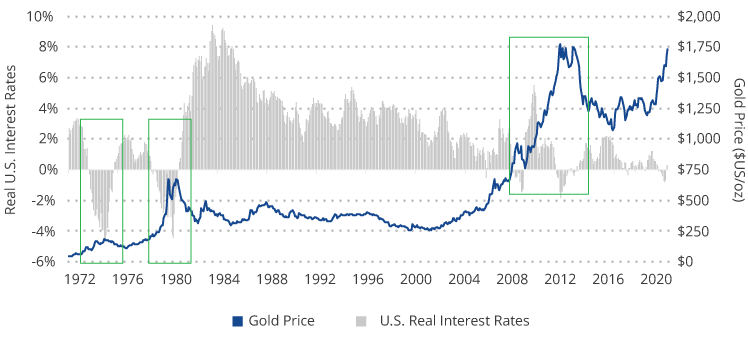
Source: VanEck, FactSet, Bloomberg. Data as of May 2020. Past performance is no guarantee of future results.
But both recent deflationary gold bull markets suggest that a price over US$3,000 is reasonable in our view. If one measures the start of this bull market from the 2015 lows, then it appears similar to the long 2001-2008 bull market when gold rose over 200%, which may be over US$3,000 per ounce.
Historical gold bull market rallies
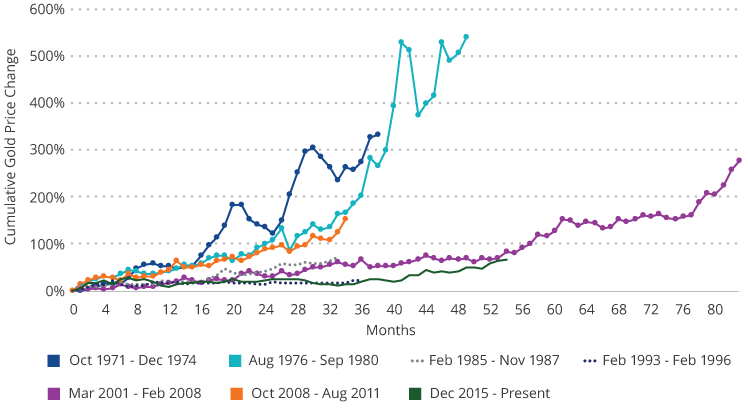
Source: VanEck, Bloomberg. Data as of June 2020. Past performance is no guarantee of future results.
If one believes, as we do, that the current central bank stimulus to fight the COVID-19 virus, along with elevated levels of systemic risks, are similar to those during the global financial crisis, then US$3,400 may be the target for this bull market. This target comes from taking the post-financial crisis move of 150% on top of the US$1,350 gold price base in the summer of 2019.
Of course, if there is a burst of inflation, major U.S. economic weakness or uncertainty, prices may go much higher. On the negative side, gold could underperform alternatives like bitcoin, which outperformed gold in 2017, or silver, which outperformed in the bull market that peaked in 2011.1
Along with the persistence of negative real rates, we believe supply and demand dynamics appear in favour of the metal moving forward. Gold continues to be a scarce commodity, and the fact that there have been no significant new gold discoveries since 2016 only adds to its supply pressure. Demand for gold, however, has continued to rise as investors have sought exposure and central banks have added to their gold reserves.
Investors have long been attracted to gold’s many potential benefits. It has historically improved portfolio diversification, acted as an inflation hedge, and proven a safe haven asset in times of market uncertainty. But some may be surprised by its impressive total return since the turn of the century, proving gold’s appreciation potential.
Gold outperformance (1/1/2000 – 6/30/2020)
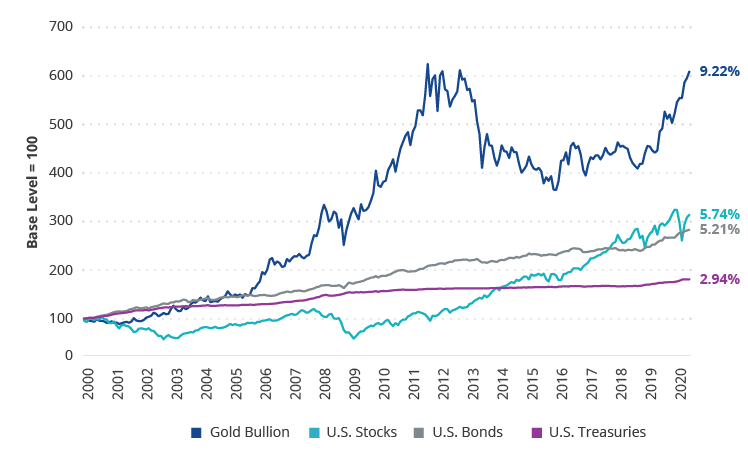
Source: Morningstar. US Stocks represented by S&P 500 Index; US Bonds represented by Bloomberg Barclays US Aggregate Bond Index; Gold Bullion represented by LBMA PM Gold Price; US Treasuries represented by the Bloomberg Barclays US 1-3 Year Treasury Bond Index. Past performance is not indicative of future results. Indices are not securities in which investments can be made. An index’s performance is not illustrative of a fund’s performance.
Investors can consider exposure to gold via companies that search for and extract gold from the ground, or gold miners. Gold miners, while historically more volatile than physical bullion investments, potentially offer greater upside and downside, have re-emerged from a period of management turnover and fiscal/corporate restructuring and are now better positioned to return value to shareholders in our view.
Current Gold Bull Market: Bullion and Miners Volatility (1/1/2016 – 6/30/2020)
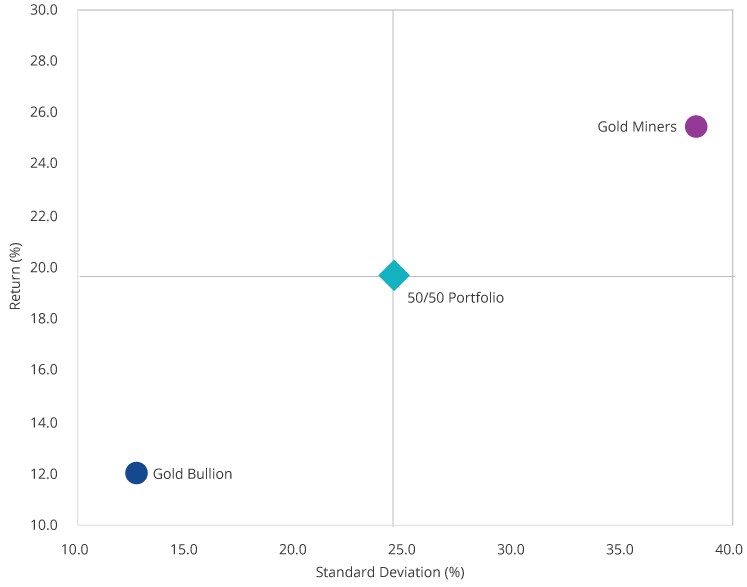
Source: Morningstar; VanEck. Volatility is measured by standard deviation. Standard deviation is a historical measure of the variability of returns relative to the average annual return. Past performance is no guarantee of future results.


Published: 04 August 2020
IMPORTANT NOTICE:
Issued by VanEck Investments Limited ABN 22 146 596 116 AFSL 416755 (‘VanEck’) as the responsible entity and issuer of units in the VanEck Vectors ETFs traded on ASX. This is general information only about financial products and not personal financial advice. It does not take into account any person’s individual objectives, financial situation or needs. Before making an investment decision, you should read the relevant PDS and with the assistance of a financial adviser consider if it is appropriate for your circumstances. PDSs are available at www.vaneck.com.au or by calling 1300 68 38 37. All investments carry some level of risk. Investing in international markets has specific risks that are in addition to the typical risks associated with investing in the Australian market. These include currency/foreign exchange fluctuations, ASX trading time differences and changes in foreign regulatory and tax regulations. See the PDS for details.
No member of VanEck group of companies gives any guarantee or assurance as to the repayment of capital, the payment of income, the performance, or any particular rate of return of any VanEck funds. Past performance is not a reliable indicator of future performance.
©2020 VanEck