Growth investing where timing isn’t a factor
History shows timing the market is very difficult. Find out how using a blend of factor ETFs could harness outperformance over the long term.
Momentum can be an unstoppable force, even in markets. Last week, headlines trumpeted the Australian bourse hitting 9,000. Australia is not the only market hitting highs, but whenever a market hits new highs, there are also the naysayers warning of impending doom. A broken clock is right twice a day, so too are the naysayers eventually proved correct.
In 2017, CNBC proclaimed 2017 looked eerily like 1987. While they stopped short of predicting a crash, they did point out that 73% of the sub-industries in the S&P 500 were higher than before the previous crash (it was 95% in 1987). In markets, the only certainty is that bull markets will follow bear markets and bear markets will follow bull markets.
Anyone who may have panicked and sold down in 2017 missed another three years of positive returns.
The US equity market has been in its current bull market since October 2022. According to the data, this is the 27th bull market in the S&P 500 since 1928. The average length of the past bull markets was 1,011 days (33 months), with an average rise of about 114%. The longest was almost 11 years, from 2009 until the COVID-19 crisis.
Table 1: S&P 500 bull and bear markets
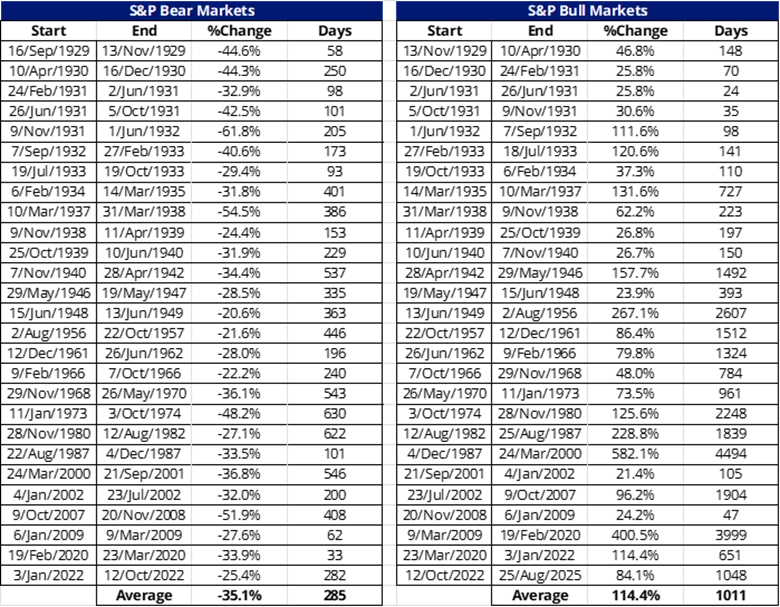
* current period, data to COB 25 August 2025
Source: BofA US Equity & Quant Strategy, Dartmouth University Data Library, Bloomberg, S&P, Morningstar. Returns in US dollars. You cannot invest in an index. Past performance is not a reliable indicator for future performance. Bull market starts when the market increases 20% following the most recent bear market. A Bear market starts when the market decreases 20% following the most recent bull market. Bull market average does not include the current market.
Now compare these to bear markets. There have been 27 of these since 1928. Bear markets tend to be shorter, averaging 286 days (9.5 months). The average fall during a bear market is 35%. The longest was in 1973/74 for almost 2 years.
It has been well noted that since 1928, overall, the US share market has been positive. There are two reasons for this:
- The asymmetry of returns – You’ll note above that the average bull market return was more than 100%. It is impossible during a bear market for shares to go down by more than that much. Therefore, there is potential for bull markets to experience higher returns than bull market losses. Over the last century, the larger positive returns of bull markets offset the negative returns of bull markets.
- Markets are positive most of the time – Bear markets comprise only about 20% of the months since 1928. Bull markets around 80%. Therefore, roughly 80% of the time, share markets were rising, and they rose by more than they fell.
There is no doubt that during each of the bull markets, the media was rife with stories about heady valuations and equity markets smashing through previous highs.
It is during these periods of share market expansion that the growth factor comes to the fore. This was particularly pronounced during the 11-year bull-run after the GFC.
Chart 1: Since the GFC, growth has outperformed

Source: Bloomberg. You cannot invest in an index. Past performance is not indicative of future performance.
Accepting that it is impossible to time the market, it is worthwhile then to consider different approaches to growth.
A new way to access growth
Traditionally, ‘growth’ has been the domain of active managers.
Investing with a skillful ‘growth’ active manager, who is selective and curates their portfolio, has been rewarding for investors, irrespective of the era. Growth investing focuses on identifying companies poised for rapid revenue and earnings expansion, often driven by innovation, market disruption or evolving consumer preferences.
VanEck has a distinguished history of harnessing technological advancement and advanced analysis to identify and unlock opportunities for Australian investors. For over a decade, we have pioneered smart beta ETF strategies in Australia, with a vast number of our smart beta ETFs being the first of their kind on the ASX, offering investors the ability to construct portfolios with a targeted outcome in mind.
It is with this mindset that we contemplated the growth factor and a selective, systematic approach.
The result is the VanEck MSCI International Growth ETF, which started trading last week on the ASX under the ticker ‘GWTH’.
The new ETF aims to track the MSCI World ex Australia Growth Select Index (GWTH Index).
GWTH invests in around 100 international companies that have been selected, according to MSCI, as being among the top companies based on:
- Long-term forward earnings-per-share (EPS) growth rate
- Short-term forward EPS growth rate
- Current internal growth rate
- Long-term historical EPS growth trend
- Long-term historical sales-per-share growth trend
Based on back testing, the GWTH Index net of GWTH’s 0.40% p.a. management fee displays strong long-term performance, as highlighted by the chart below. Noting that the past performance of the index should not be relied upon as an indication of future performance of GWTH.
Chart 2: Modelled calendar year performance: GWTH’s index after fees

Table 2: Modelled trailing returns: GWTH Index after fees and MSCI World ex Australia Index

Source: Morningstar Direct, MSCI, VanEck as at 31 July 2025. Chart 2 and Table 2 are hypothetical comparisons of the performance of the GWTH Index and the MSCI World ex Australia Index (“Parent Index”). Chart 2 contains returns for past 20 calendar years, and Table 2 contains annualised performance data. GWTH Index performance prior to its launch in August 2025 is simulated based on the current index methodology. Results are calculated to the last business day of the month and assume immediate reinvestment of all dividends, and exclude the costs associated with investing in GWTH. You cannot invest in an Index. Past performance information is not a reliable indicator of future performance of the indices or GWTH. The Parent Index is shown for comparison purposes as it is the widely recognised benchmark used to measure the performance of developed market large- and mid-cap companies, weighted by market capitalisation. The GWTH index measures the performance of approximately 100 companies selected from the Parent Index based on MSCI growth descriptors. Consequently, the GWTH Index has fewer companies and different country and industry allocations than the Parent index.
Using growth in a portfolio
As evidenced above, the performance of factors can be cyclical. You can see, when the market fell in 2008 and in 2021/2022, growth underperformed. Growth investing is a strategy associated with high volatility. The growth factor can turbo-charge the returns of a portfolio one year, only to weigh it down in another.
The periods it does well tend to correlate with low volatility market environments. In the past, the GWTH Index has outperformed these risk-on environments.
Chart 3: Hypothetical relative performance of GWTH Index versus VIX

Chart 4: Hypothetical GWTH's index return comparison by VIX range

Charts 3 & 4: Source: MSCI Data/Calculations, Bloomberg, 29 January 1999 to 31 July 2025. Chart shows performance of MSCI World ex Australia Growth Select relative to MSCI World ex Australia compared to VIX Index. Results include the reinvestment of all dividends, but exclude fees and other costs associated with an investment in GWTH. You cannot invest in an index. Past performance is not a reliable indicator of future performance of the index or GWTH.
It’s not too late to add GWTH
We think adding growth is an important diversifier that can help investors traverse the macroeconomic environment. Smart beta ETFs are an efficient tool to facilitate this.
The Purchasing Managers' Index (PMI) is an index used to measure the prevailing direction of economic trends in the manufacturing and service sectors. It measures the change in production levels across the economy from month to month, so it is considered a key indicator of the state of the economy. The chart below shows the three-month rolling PMI changes since the start of 1998, highlighting the stage of the economic cycle at that time.
Chart 5: ISM Manufacturing PMI Index

Source: VanEck, Bloomberg. November 1998 to July 2025.
You can see for the first time since February 2025, PMIs have gone below 50. Should the economy recover, we think GWTH could do well.
We analysed the performance of the indices that our Quality, Value and Growth ETFs track. The performance differential (outperformance relative to the MSCI World ex Australia Index) of each factor broken up by each stage of the economic cycle is presented below.
Table 3: Total performance (% per annum) during different economic regimes

Source: VanEck, Bloomberg. December 1998 to July 2025. Past performance is not a reliable indicator of future performance.
You can see in a recovery and expansion, growth is the winning factor. Quality is the winning factor in a slowdown and contraction.
Savvy investors can use ETFs to position for the macro environment into the rest of 2025 and beyond. We think GWTH could be used as a portfolio tool to blend with ‘quality’ and ‘value’ style strategies and benchmark agnostic active managers.
Key risks: GWTH invests in international markets, which have specific risks that are in addition to the typical risks associated with investing in the Australian market. These include foreign currency, ASX trading time differences, country or sector concentration, political, regulatory and tax risks. The PDS and TMD detail the key risks.
GWTH is intended for investors seeking capital growth, intending to use it as a major, core, minor, or satellite allocation within a portfolio, with an investment timeframe of at least five years and a high risk/return profile.


Published: 03 September 2025
Any views expressed are opinions of the author at the time of writing and is not a recommendation to act.
VanEck Investments Limited (ACN 146 596 116 AFSL 416755) (‘VanEck’) is the issuer and responsible entity of all VanEck exchange traded funds (Funds) listed on the ASX. This is general advice only and does not take into account any person’s financial objectives, situation or needs. The product disclosure statement (PDS) and the target market determination (TMD) for all Funds are available at vaneck.com.au. You should consider whether or not any Fund is appropriate for you. Investments in a Fund involve risks associated with financial markets. These risks vary depending on a Fund’s investment objective. Refer to the applicable PDS and TMD for more details on risks. Investment returns and capital are not guaranteed.
GWTH, VLUE and QUAL are not sponsored, endorsed, or promoted by MSCI, and MSCI bears no liability with respect to GWTH, VLUE or QUAL, or respective, or Parent Index. The PDS contains a more detailed description of the limited relationship MSCI has with VanEck and GWTH and VLUE and QUAL.