Taking the right ‘value’ approach
As investors shift away from expensive growth stocks the value factor continues to gain attention.
As investors rotate away from high-priced growth stocks and focus on tangible cash flows, robust balance sheets, and reasonable valuations, the value factor has continued to come to the fore.
Value investing is an investment strategy that focuses on buying companies the market may be undervaluing. While this seems an intuitively straightforward path to investment success and history supports that argument, taking the right 'value' approach is important.
Read how the Value factor may be used with quality and growth factors – here.
Enhancing value
Some ‘value’ companies are cheap for a reason, and these could be ‘value traps’. MSCI analysis found that using forward earnings can help protect against ‘value traps’. Additionally, MSCI found that considering whole-firm valuation measures, such as enterprise value, can reduce concentration in leveraged companies.
Therefore, MSCI developed its Enhanced Value Indices, which apply three valuation ratio descriptors on a sector-relative basis:
- price-to-book value - Ratio of the price to the company’s book value or what is on the balance sheet. The lower the price to book, the cheaper the company;
- price-to-forward earnings - A version of the ratio of price-to-earnings (P/E) that uses forecasted earnings for the P/E calculation. The forward earnings are the weighted average of the consensus of analysts’ predicted earnings. The lower the Forward P/E the cheaper the company.; and
- enterprise value-to-cash flow from operations - The ratio of the entire economic value of a company to the cash it produces. When you divide EV by CFO, you're essentially calculating the number of years it would take to buy the entire business if you were able to use all the company's operating cash flow to buy all the outstanding stock and pay off all the outstanding debt. The lower the ratio the faster a company can pay back the cost of its acquisition, or generate cash to reinvest in its business.
Value in contractions and slowdowns
To illustrate how the value factor may perform in the current economic environment, in Chart 3 below, we overlay the manufacturing activity (a proxy for economic activity) with the relative performance of quality (MSCI World Enhanced Value Index/MSCI World Index). In the chart below, each economic regime is represented by a colour: recovery (blue), expansion (green), slowdown (orange) and contraction (purple).
Chart 1: US ISM Manufacturing PMI Index and relative MSCI World Enhanced Value performance

Source: Bloomberg, MSCI, February 2026. Past performance is not indicative of future performance. You cannot invest in an index. Enhanced Value and MSCI World represented by the MSCI World Enhanced Value Index and MSCI World Index, respectively.
The black line illustrates enhanced value had periods of outperformance and underperformance. We analysed the returns on enhanced value in each of the four economic regimes. The table below represents the returns of the value factor through the cycle.
Table 1: Value Factor performance during different economic regimes

Source: Bloomberg, MSCI, February 2026. Past performance is not indicative of future performance. You cannot invest in an index. Value and benchmark is represented by the MSCI World Enhanced Value Index and MSCI World Index, respectively.
You can see that value historically outperformed most during recoveries and subsequent expansions. Arguably, the global economy is on a path of recovery, and should the expansion continue, value may continue to perform well.
It is challenging for investors to navigate economic conditions and prevailing markets. ETFs that capture factors are being used by savvy investors as tools to either hold through the cycle or blend to help mitigate the troughs of the cycle.
We have written about factor investing, and we have many resources available, including a microsite on value investing – here
Investors seeking to tap into the current trends may wish to consider adding our VanEck MSCI International ETF (VLUE) to their international equities exposure.
VLUE’s stellar start to 2026
VanEck MSCI International Value ETF (VLUE) has started 2026 strongly, noting as always that past performance is not indicative of future performance.
Table 2: VLUE performance as at 18 February 2026

Source: VanEck, Morningstar, Bloomberg. Results assume immediate reinvestment of all dividends and include management fees but exclude brokerage costs and taxes. Past performance is not indicative of future performance.
VLUE inception date is 8 March 2021 and a copy of the factsheet is here.
The MSCI World ex Australia Index (“MSCI World ex Aus”) is shown for comparison purposes as it is the widely recognised benchmark used to measure the performance of developed market large- and mid-cap companies, weighted by market capitalisation. VLUE’s index measures the performance of 250 international large- and mid-cap companies selected from the MSCI World ex Australia Index with high value scores relative to their peers at rebalance. Exclusions apply for weapons and tobacco. Consequently, VLUE’s index has fewer companies and different country and industry allocations than MSCI World ex Aus. ‘Click here for more details’.
Two reasons explaining VLUE’s stellar start to 2026
Before the beginning of the year, an equity rotation was underway, and value was making a comeback. There have been two key reasons driving this shift:
- Market sentiment shift– There is no doubt that the concentration in US tech stocks (Magnificent 7) has raised concerns about stretched valuations and limited upside. As a result, investors are reallocating toward other international equity markets and value sectors that offer potentially better long-term risk-reward.
- Inflation fears and the rates environment – When the Fed started cutting rates at the end of 2024, the US 10-year yield shot up, peaking at 4.80%, reflecting fears that inflation in the US may be stubbornly higher amid solid US economic data and the potential impact of tariffs and other policies, at that stage, proposed by the incoming Trump administration.
While the 10-year yield had dropped to below 4% by October 2025 as the Fed continued to ease (despite inflation remaining above the target band). Since November, it has shot back up, sitting at above 4%, and the current Fed Chair looks to be in no rush to cut rates, despite the apparent wishes of the President.
While a new Fed Chair is due in May, it's likely the incumbent will be more amenable to the President's wishes, the market is effectively still forecasting rates above 4% over the next ten years.
Chart 2: US 10-year yields since 1 January 2024

Source: Bloomberg, to 18 February 2026.
A higher rate environment, in the past, has historically benefited value companies.
Many investors value stocks using a net present value (NPV) model. This is important for valuing high-growth stocks, which have little or no earnings yet, so investors assess expected earnings in the future. This means they discount projected earnings back to the present using a discount rate, typically the yield on 10-year US treasuries. Therefore, when this rate goes up, as it has, valuations go down.
In this environment, expensive stocks in areas like growing tech companies underperform the cheapest companies, which tend to be cyclicals such as financials and energy. The forward price-to-earnings (PE) multiples of the most expensive stocks, therefore, become inversely correlated with 10-year yields. The reverse is true for value stocks.
We have seen this play out since the turn of the century. The chart below shows the performance of the value factor, as represented by the VLUE Index, across three interest rate regimes since 1999. The first was a high-rate environment, in which US 10-year yields sat between 3% and 5.5%. Following the low-growth, low-inflation period after the GFC and through COVID, the US 10-year yield was below 3% - a low-rate environment. Most recently, the US 10-year yield has been around 4%.
You can see in the chart that during the periods when the US 10-year was above 3%, the value factor outperformed. Should the market continue to keep 10 year yields high, we think value could potentially outperform the broader market.
Chart 3: Value vs broad market performance across different interest rate regimes since 1999
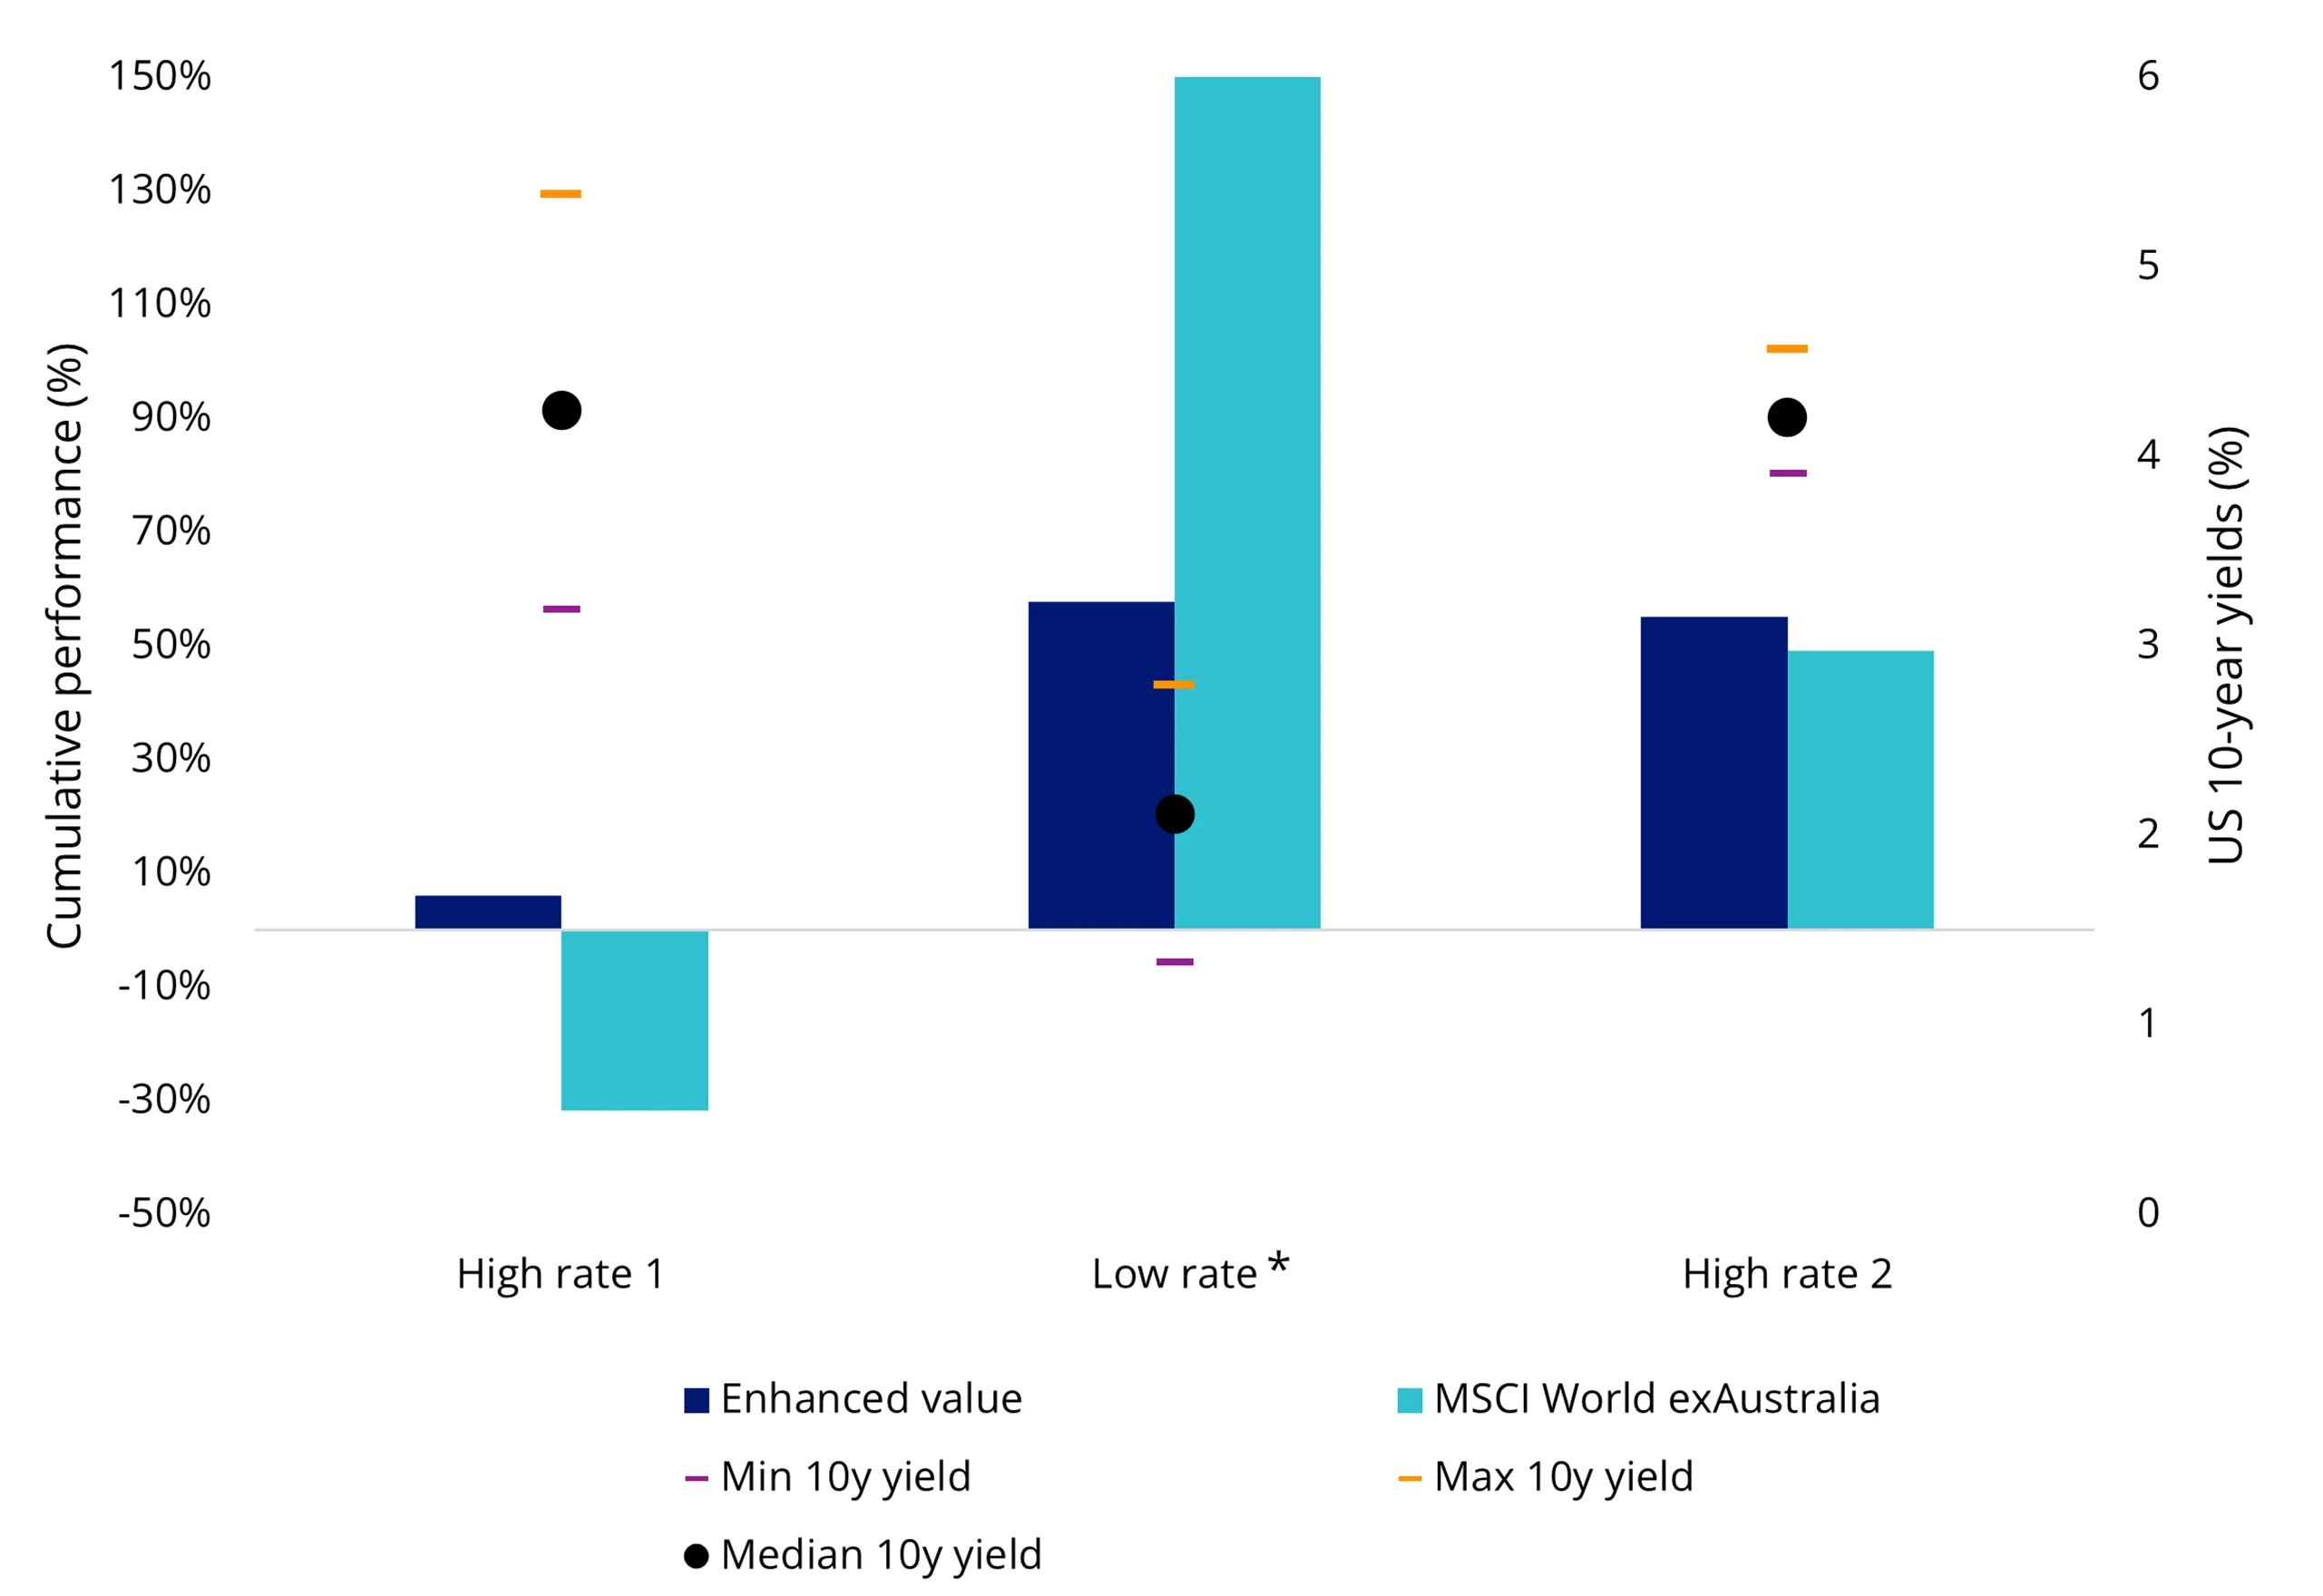
*Low rate: MSCI World ex Australia value is 313.9%
Source: Bloomberg, VanEck. High rate 1 is 31 December 1999 to 30 June 2011, Low rate is 1 July 2011 to 29 July 2023, High rate 2 is 1 August 2023 to 31 December 2025. Enhanced Value is the MSCI World ex Australia Enhanced Value Top 250 Select Index. Past performance is not indicative of future performance. You cannot invest in an index.
We don't think it's too late to reposition before the shift becomes consensus. But selectivity is key.
Key points of VLUE:
International companies exhibiting value characteristics
Access a portfolio of international companies that are selected for their high value score relative to sector peers as measured by MSCI based on: (i) price to book value; (ii) price to forward earnings; and (iii) enterprise value to cash flow from operations.
Long term focus, capturing value across the market cycle
The index is designed to capture a high level of exposure to value while minimising unintended and unwanted sector bets
Diversified across countries, sectors and companies
Offering investors a portfolio of 250 companies across a range of geographies, sectors and economies
HVLU is an Australian-dollar hedged version of VLUE, so you can now also manage your desired currency exposure
Key risks
An investment in our international value ETF carries risks associated with: ASX trading time differences, financial markets generally, individual company management, industry sectors, foreign currency, country or sector concentration, political, regulatory and tax risks, fund operations, liquidity and tracking an index. See the VanEck MSCI International Value ETF PDS and TMD for more details.
VLUE is likely to be appropriate for a consumer who is seeking capital growth, is intending to use the product as a major, core, minor or satellite allocation within a portfolio, has an investment timeframe of at least 5 years, and has a high risk/return profile.


Published: 24 February 2026
Any views expressed are opinions of the author at the time of writing and is not a recommendation to act.
VanEck Investments Limited (ACN 146 596 116 AFSL 416755) (VanEck) is the issuer and responsible entity of all VanEck exchange traded funds (Funds) trading on the ASX. This information is general in nature and not personal advice, it does not take into account any person’s financial objectives, situation or needs. The product disclosure statement (PDS) and the target market determination (TMD) for all Funds are available at vaneck.com.au. You should consider whether or not any Fund is appropriate for you. Investments in a Fund involve risks associated with financial markets. These risks vary depending on a Fund’s investment objective. Refer to the applicable PDS and TMD for more details on risks. Investment returns and capital are not guaranteed.
VLUE is not sponsored, endorsed, or promoted by MSCI, and MSCI bears no liability with respect to VLUE, or Parent Index. The PDS contains a more detailed description of the limited relationship MSCI has with VanEck and VLUE.