The quality upgrade for 2026
After a six-month risk-on rally following the tariff announcements on Liberation Day, the tide has finally started to turn as concerns about frothy valuations have taken centre stage. We think the outlook is supportive for the quality factor.
Quality in 2025 echoes the prelude to previous market episodes
This year, low-quality, non-profitable companies have outperformed those considered ‘quality’. This is shown in the charts below. This performance exhibits similarities with three historical episodes: the lead-up to the Dot-com bubble in 1999, the post-GFC (Global Financial Crisis) rebound and the global COVID-19 reopening trade in late 2020. In the earlier cases, investor FOMO drove a surge in demand for low-quality stocks, which materially outperformed despite valuations reaching their respective peaks, while quality stocks lagged. Notably, equity valuations typically rise significantly during these episodes, which, in turn, plants the seed for valuation compression when sentiment cools later.
Charts 1 & 2: Historical performance & valuations
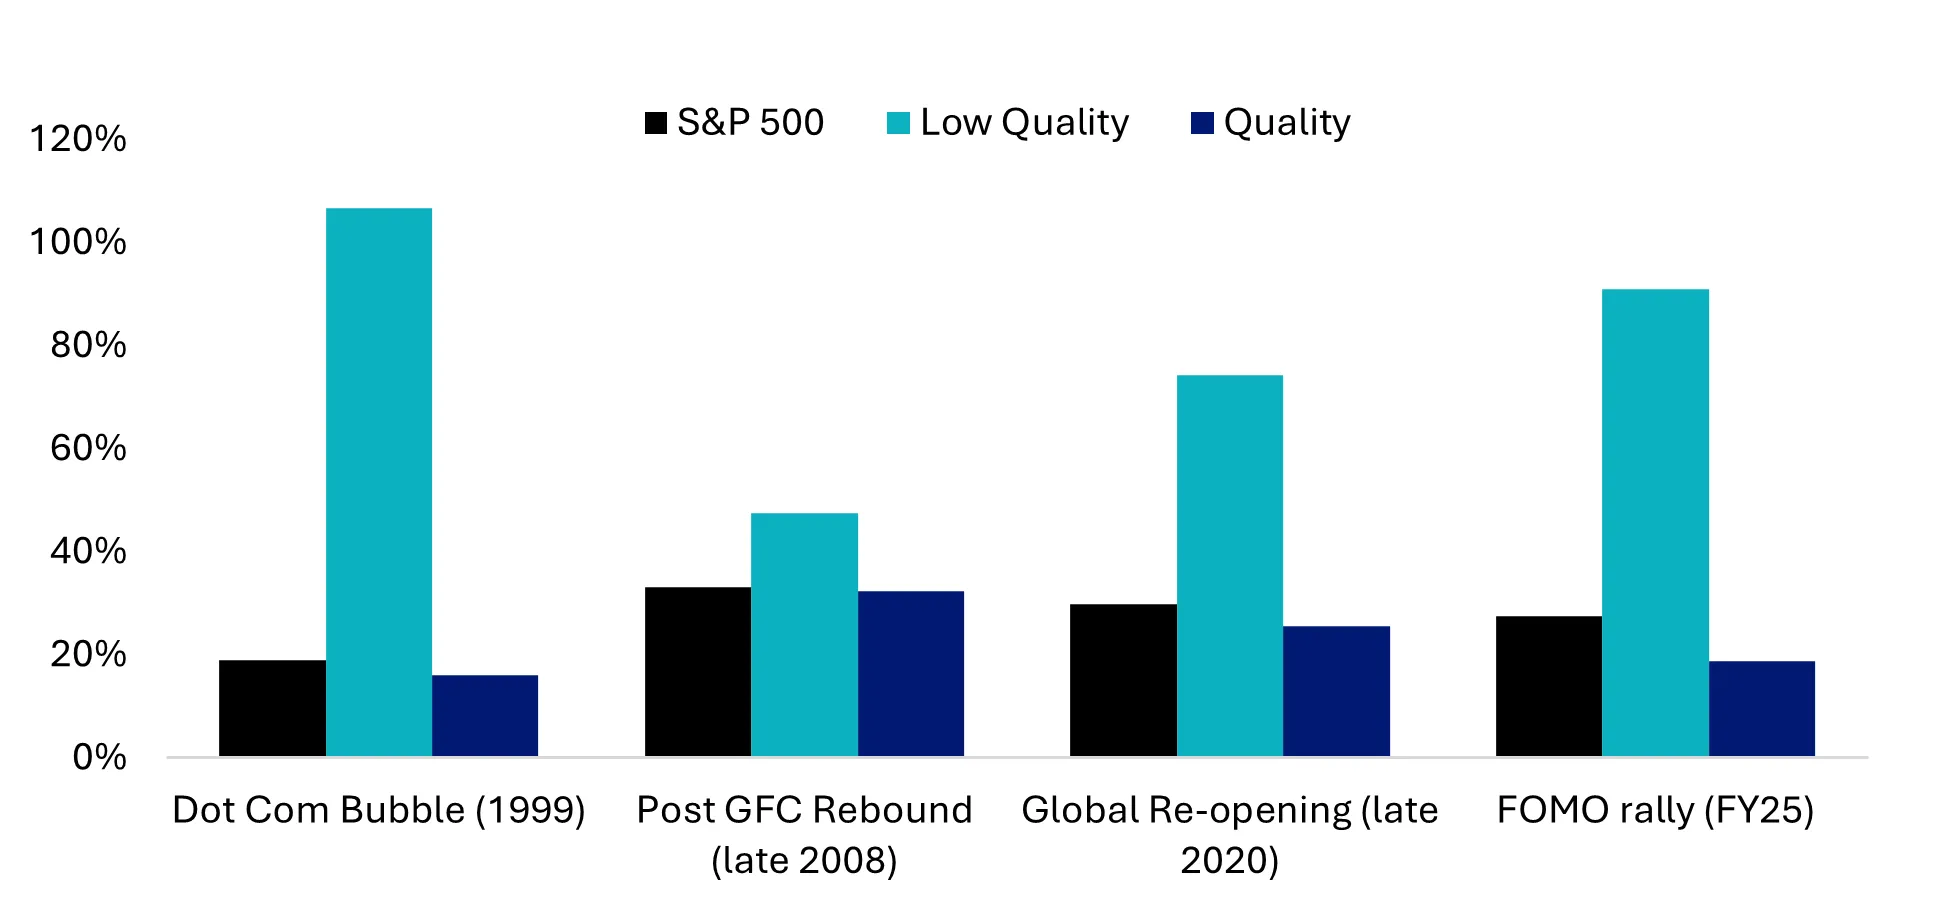
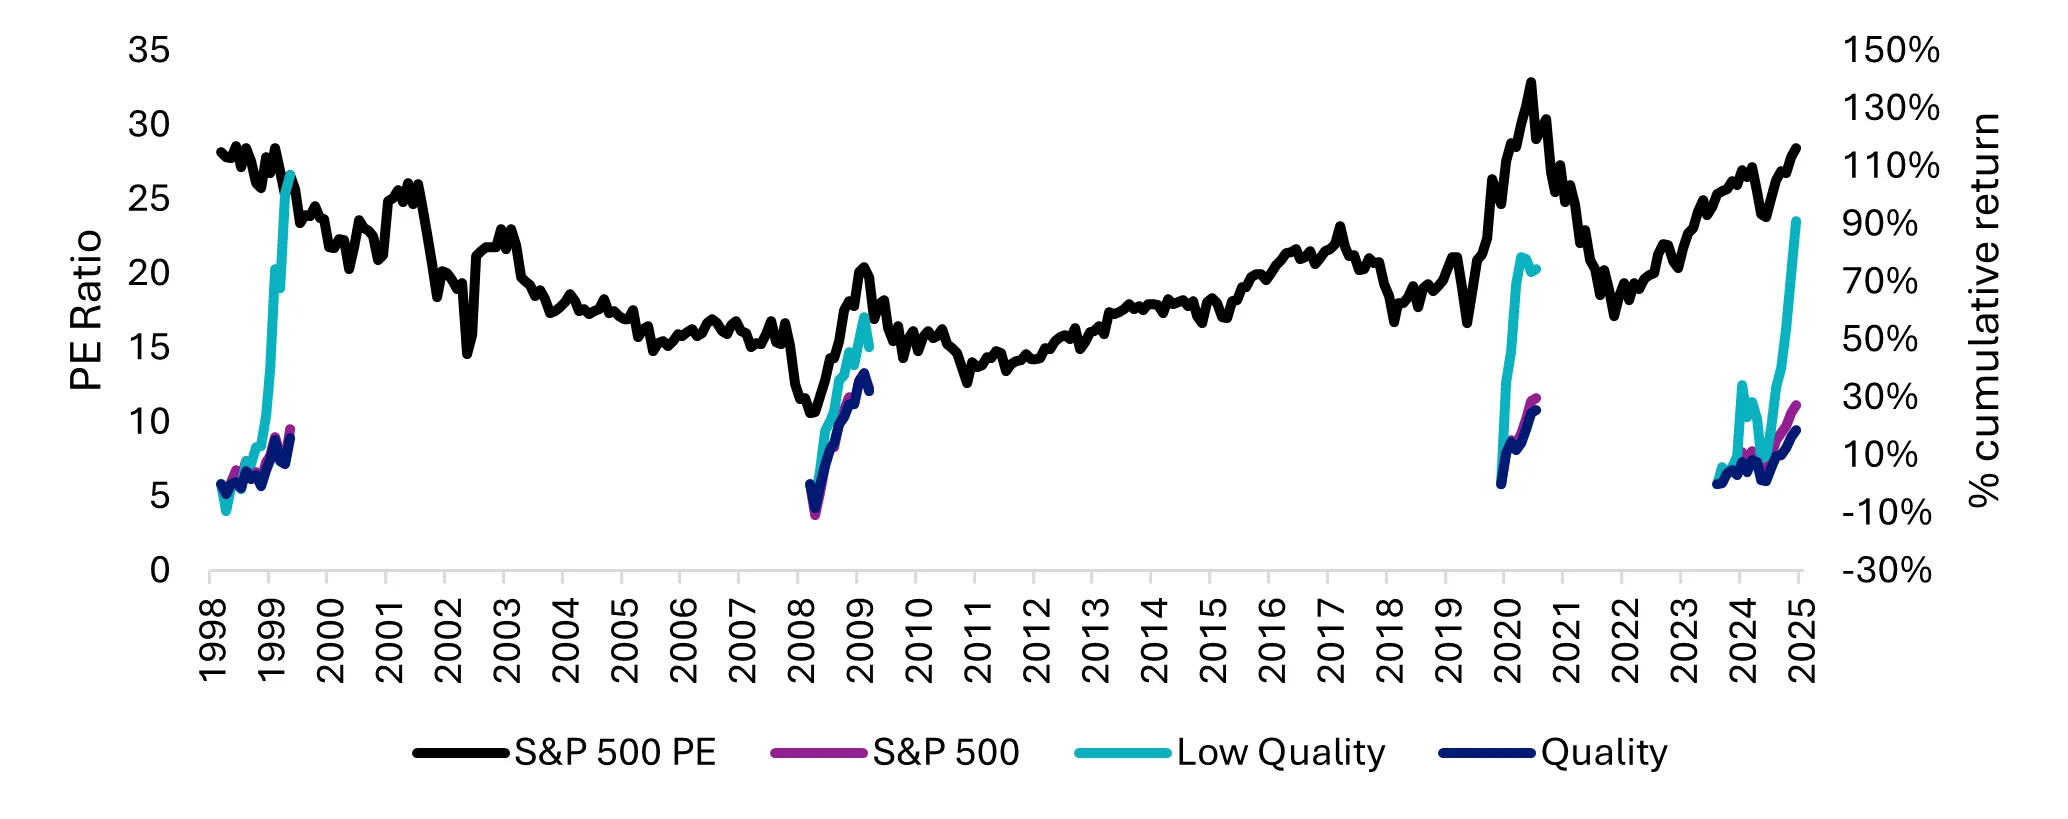
Source: Bloomberg, Quality is MSCI US Quality Index and Low Quality is UBS US Low Quality Index and the NASDAQ100 for the dot com bubble period. Dot Com Bubble as 1 January 1999 to 31 March 2001. Post GFC rebound 1 January 2009 to 31 December 2009, Global Re-opening as 1 November 2020 to 31 May 2021. FOMO Rally as 1 July 2024 to 30 June 2025. You cannot invest in an index. Past performance is not a reliable indicator of future performance.
In two out of the three past episodes, the unwinds were triggered by rising inflation and bond yields, which adversely impacted longer-duration growth assets, and, in the case of the Dot-com bubble, by a collapse in forward sales and earnings expectations. Additionally, valuations were at the respective peak of their cycle. The respective maximum drawdowns are shown below. Recently, we have seen US unprofitable tech and the most shorted US companies sold off by more than 20% while quality companies have remained resilient (see chart below). If history is any guide, we could be nearing an important inflection point.
Chart 3: Max drawdown
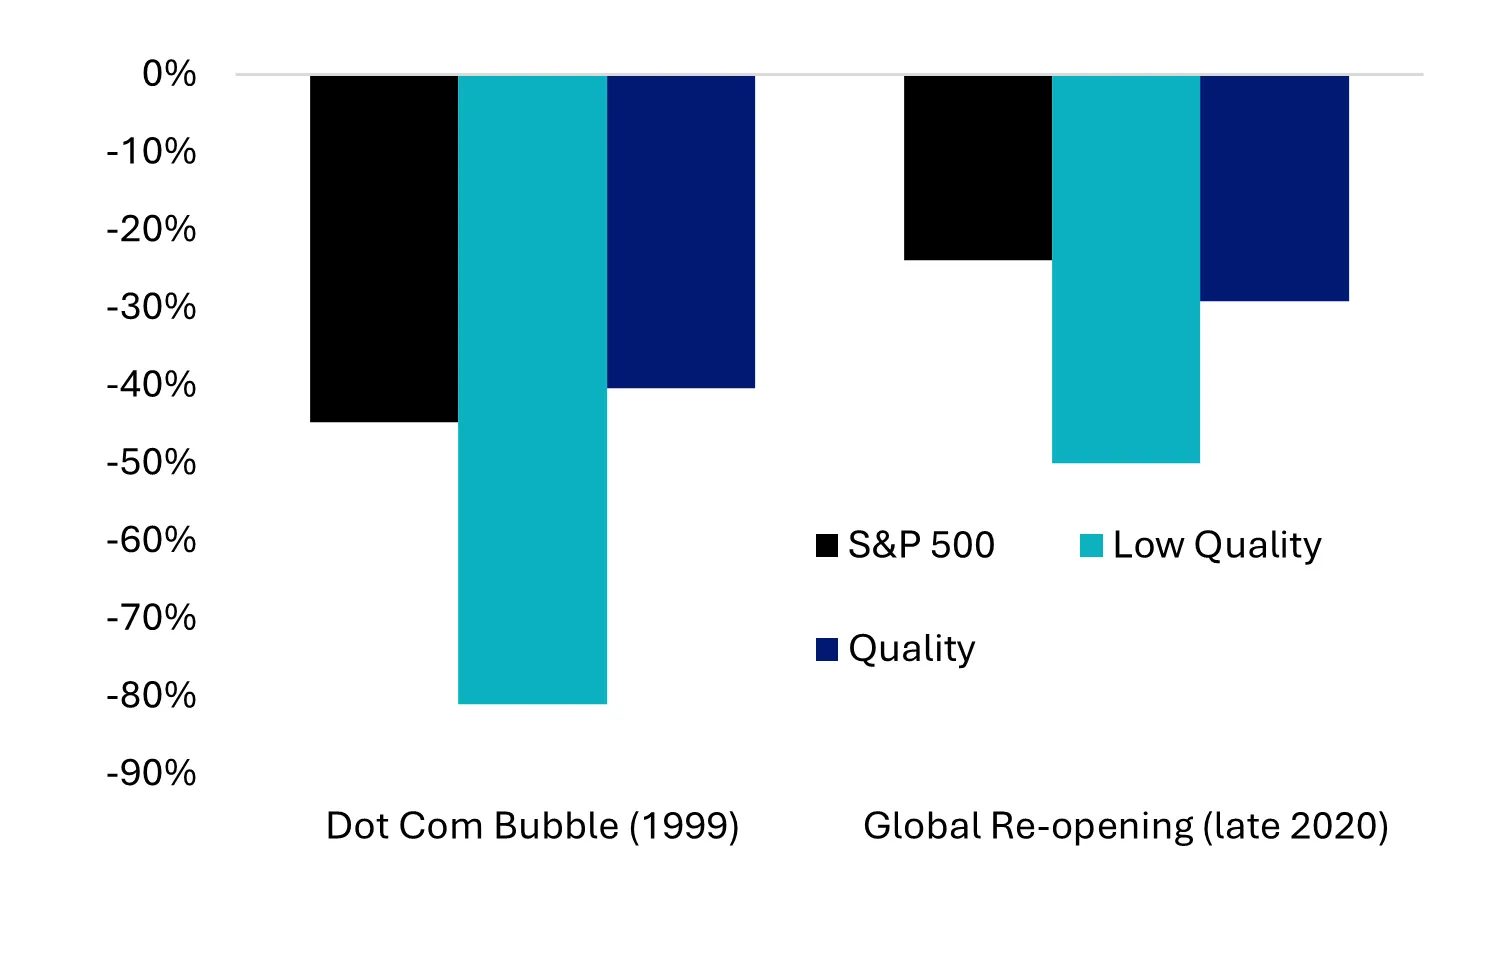
Source: Bloomberg, Quality is MSCI US Quality Index and Low Quality is UBS US Low Quality Index and NASDAQ 100 for dot com bubble period. You cannot invest in an index. Past performance is not a reliable indicator of future performance. Dot Com Bubble from 1 January 1999 to 31 March 2001. Global Re-opening from 1 November 2020 to 31 May 2021.
Chart 4: November has seen speculative equities falling sharply

Source: VanEck. Bloomberg. Performance in AUD. US unprofitable tech is Goldman Sachs Unprofitable Tech Index, US Low Quality is UBS US Low Quality Index. US Most Shorted is Goldman Sachs US Most Shorted Index. Quality is MSCI US Quality Index, Enhanced Value is MSCI US Enhanced Value Index. You cannot invest in an index. Past performance is not a reliable indicator of future performance.
The macro backdrop has changed and it’s supportive of quality
Backlogged US macro data released after the US government shutdown paints a potential stagflationary picture of slowing employment growth, deteriorating business activity, rising input costs, weakening consumer confidence, and retail sales losing steam. This has seen the market ramp up bets for further Fed rate cuts. As a result, risk sentiment has retreated, which has led to investors seeking fundamentally sound quality companies.
Chart 5-8: US macro data paints a stagflationary picture
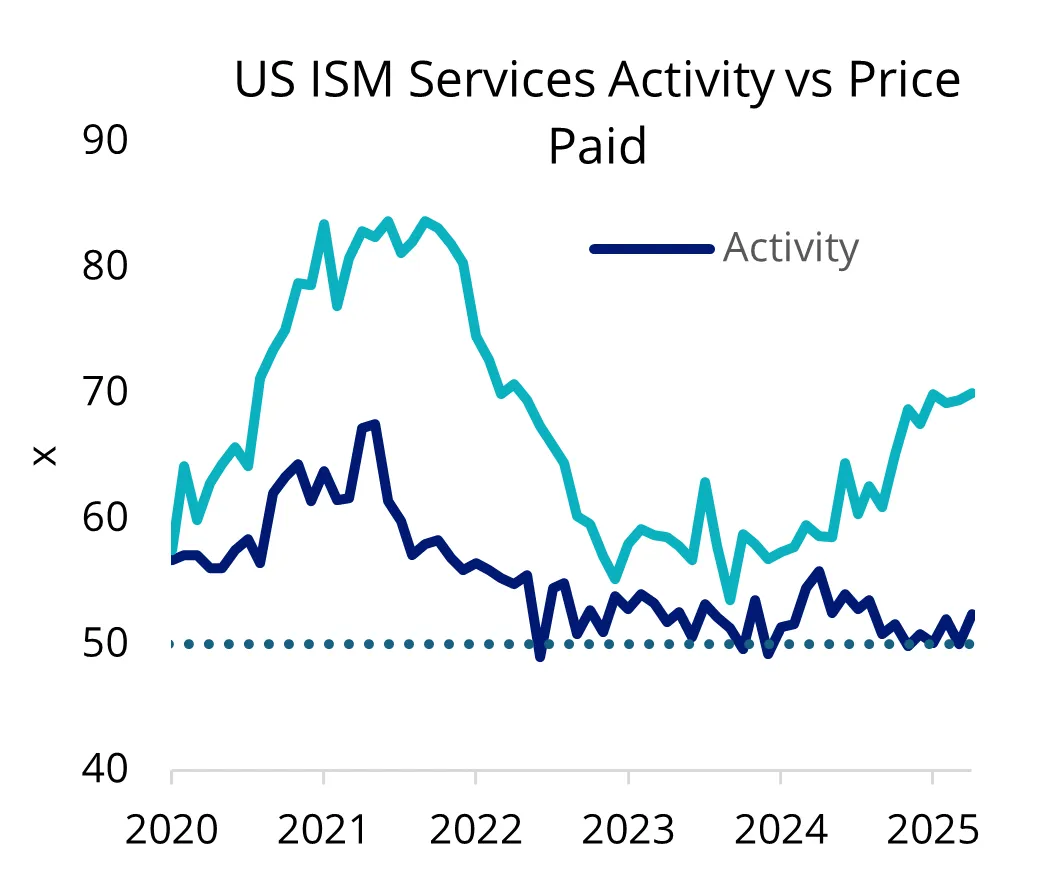
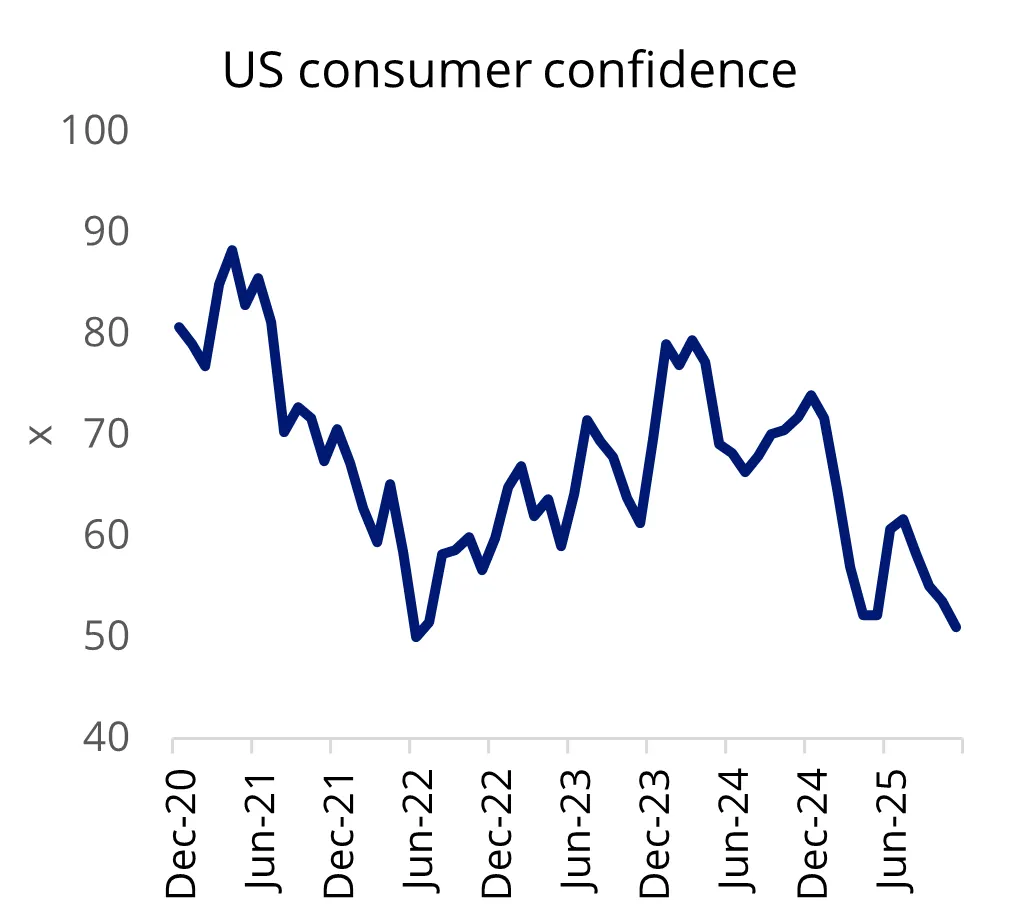
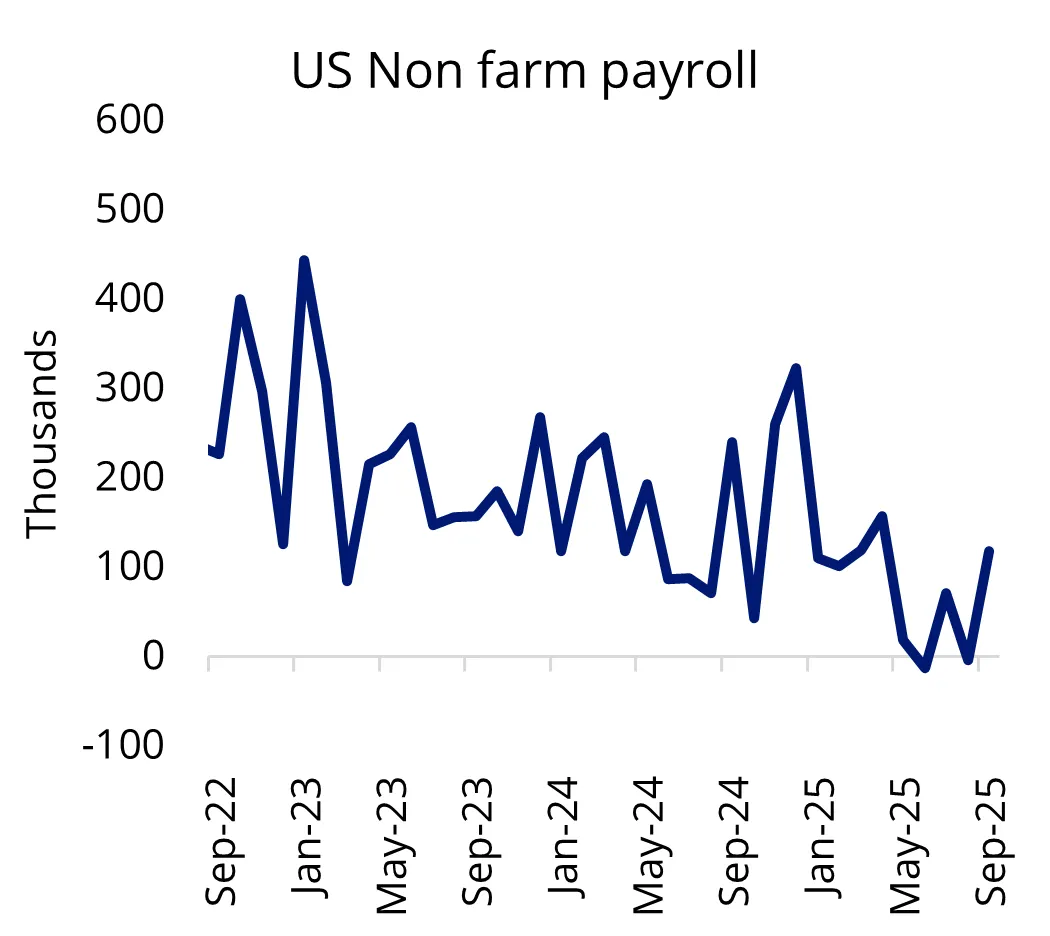
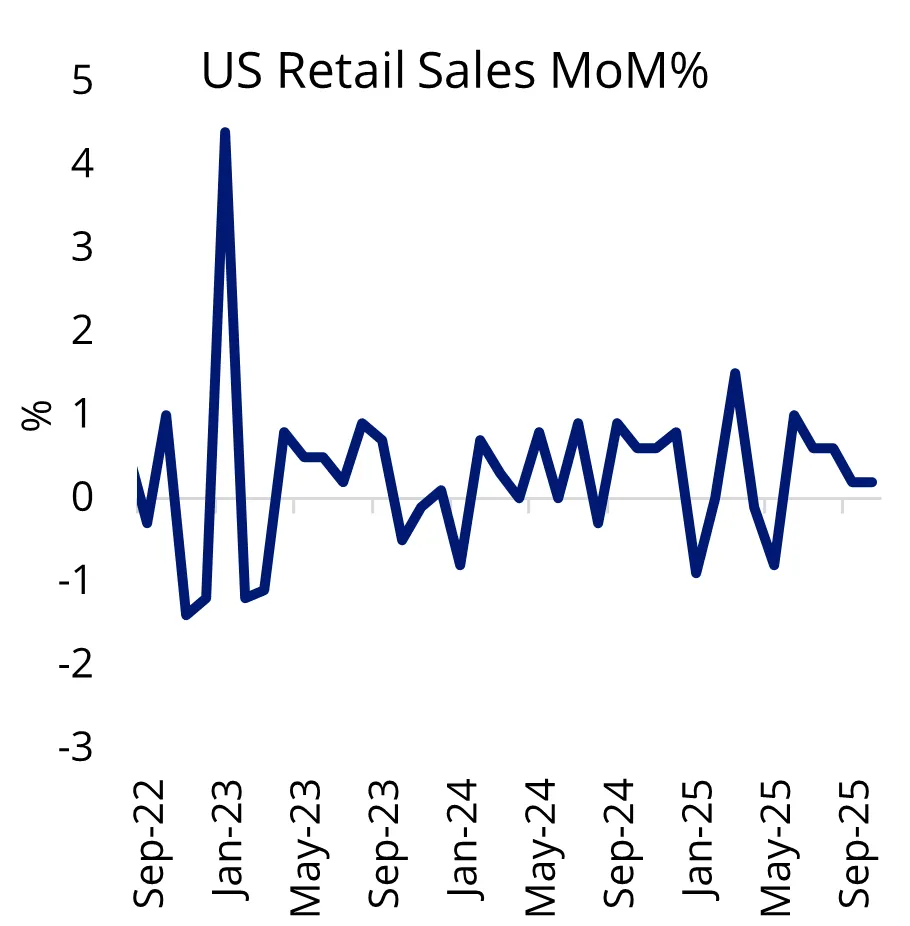
Source: VanEck. Bloomberg. ISM data as at 31 October 2025. All other data as at 30 September 2025.
Adding to growth concerns, questions about the sustainability of forward earnings growth and elevated valuations among US equities have been increasing. As of 30 November 2025, most market segments are trading at valuations above historical averages, and this level of price-for-perfection limits margins for error. This can be evidently seen in the Q3 US earnings season.
The ‘defensive rotation’ may be starting. In November 2025, quality companies, as represented by VanEck’s International Quality ETF (QUAL) outperformed the broader market (MSCI World ex Australia Index) by about 105 basis points. This is a short period and not indicative of future performance.
Valuations-wise, while quality companies typically trade at a premium to the broader market due to their defensive characteristics, the valuation differential has narrowed toward the 10-year average. This makes quality companies one of the less ‘frothy’ opportunities within international equities.
History suggests that quality companies outperform during economic slowdowns, experiencing smaller declines during market downturns, and recovering more swiftly to previous levels. In our view, looking ahead, should risk sentiment continue to roll back, or if US tariff implications progressively lead to a stagflationary environment and market volatility rises, a broader ‘flight to quality’ could be triggered.
Chart 9: Quality companies are becoming relatively 'cheap'
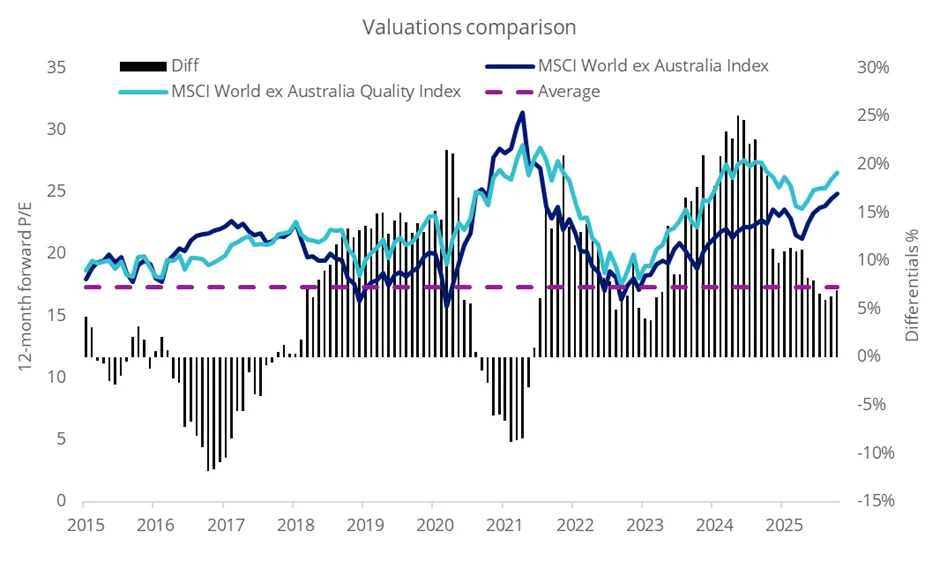
Source: Bloomberg. Data as at 31 October 2025. You cannot invest in an index.
Table 1: QUAL performance:
Performance as at 30 November 2025
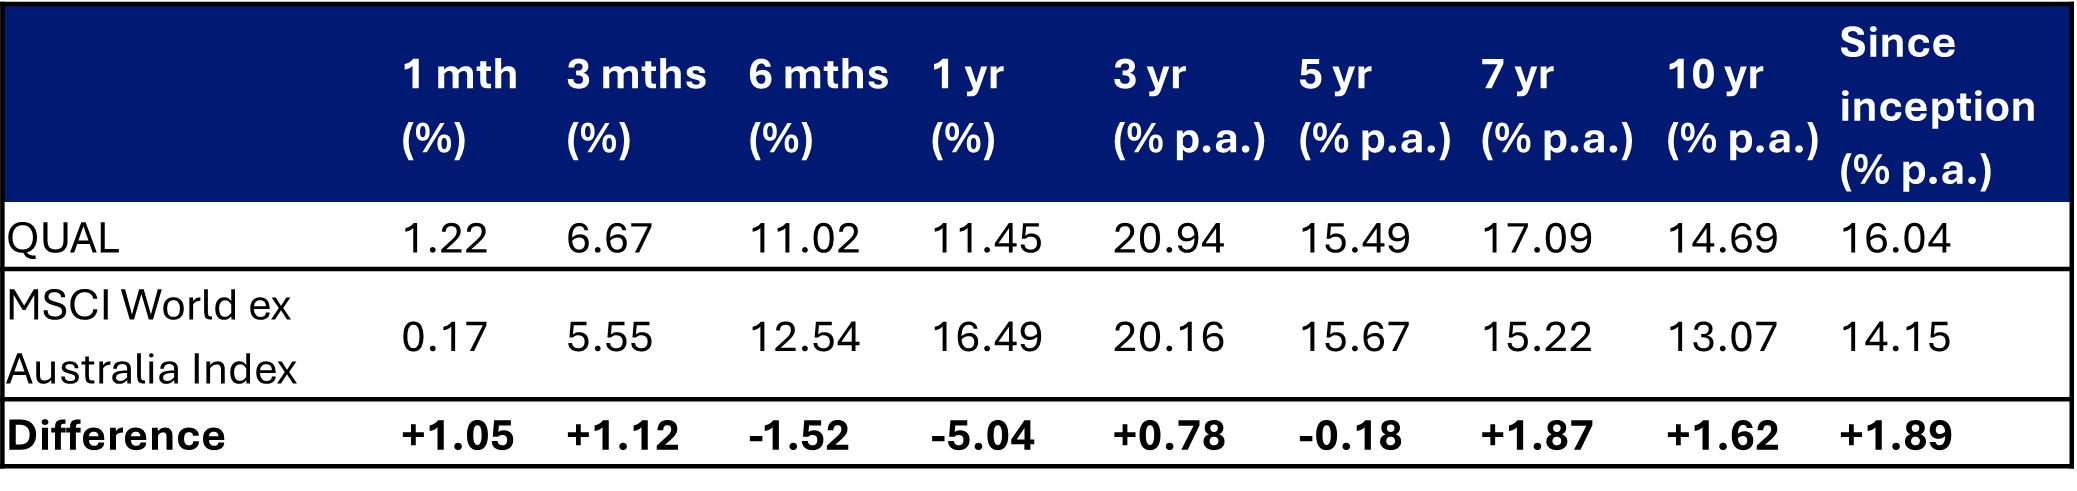
Inception date is 29 October 2014
Source: Morningstar Direct. The table above show the past performance of QUAL and of the MSCI World ex Australia Index. You cannot invest directly in an index. Results are calculated to the last business day of the month and assume immediate reinvestment of distributions. QUAL results are net of management fees and other costs incurred in the fund, but before brokerage fees and bid/ask spreads incurred when investors buy/sell on the ASX. Returns for periods longer than one year are annualised. Past performance is not a reliable indicator of future performance. The MSCI World ex Australia Index (“MSCI World ex Aus”) is shown for comparison purposes, as it is the widely recognised benchmark used to measure the performance of developed market large- and mid-cap companies, weighted by market capitalisation. QUAL’s index measures the performance of 300 companies selected from MSCI World ex Aus based on MSCI quality scores, weighted by market cap x quality score at rebalance. Consequently, QUAL’s index has fewer companies and different country and industry allocations than MSCI World ex Aus. Click here for more details.
A recent Financial Times article, “The best time to buy quality stocks is now”, highlighted the need to move away from highly indebted, unprofitable and volatile companies that have been soaring of late, driven by retail investors and big hopes for AI.
Based on our analysis, we think quality companies could benefit from further macro tailwinds in below two scenarios, heading into the next few months.
Scenario one: subdued growth + higher market
Macro environment:
There are no material changes in tariff rates which have led to elevated net exports. Rising input costs could continue to inflate goods prices and weigh on consumption. As a result, GDP growth is likely to remain subdued.
Meanwhile, market volatility could return to the spotlight as valuation compression becomes increasingly pronounced amid a weaker growth outlook and lower market risk appetite.
Market implications:
Investors become increasingly concerned about frothy valuations, turning away from richly value companies and rotate into more quality names. In that case, quality companies could outperform as strong balance sheets, consistent earnings and pricing power help companies navigate softer demand.
Chart 10: Global quality equities versus equity market volatility
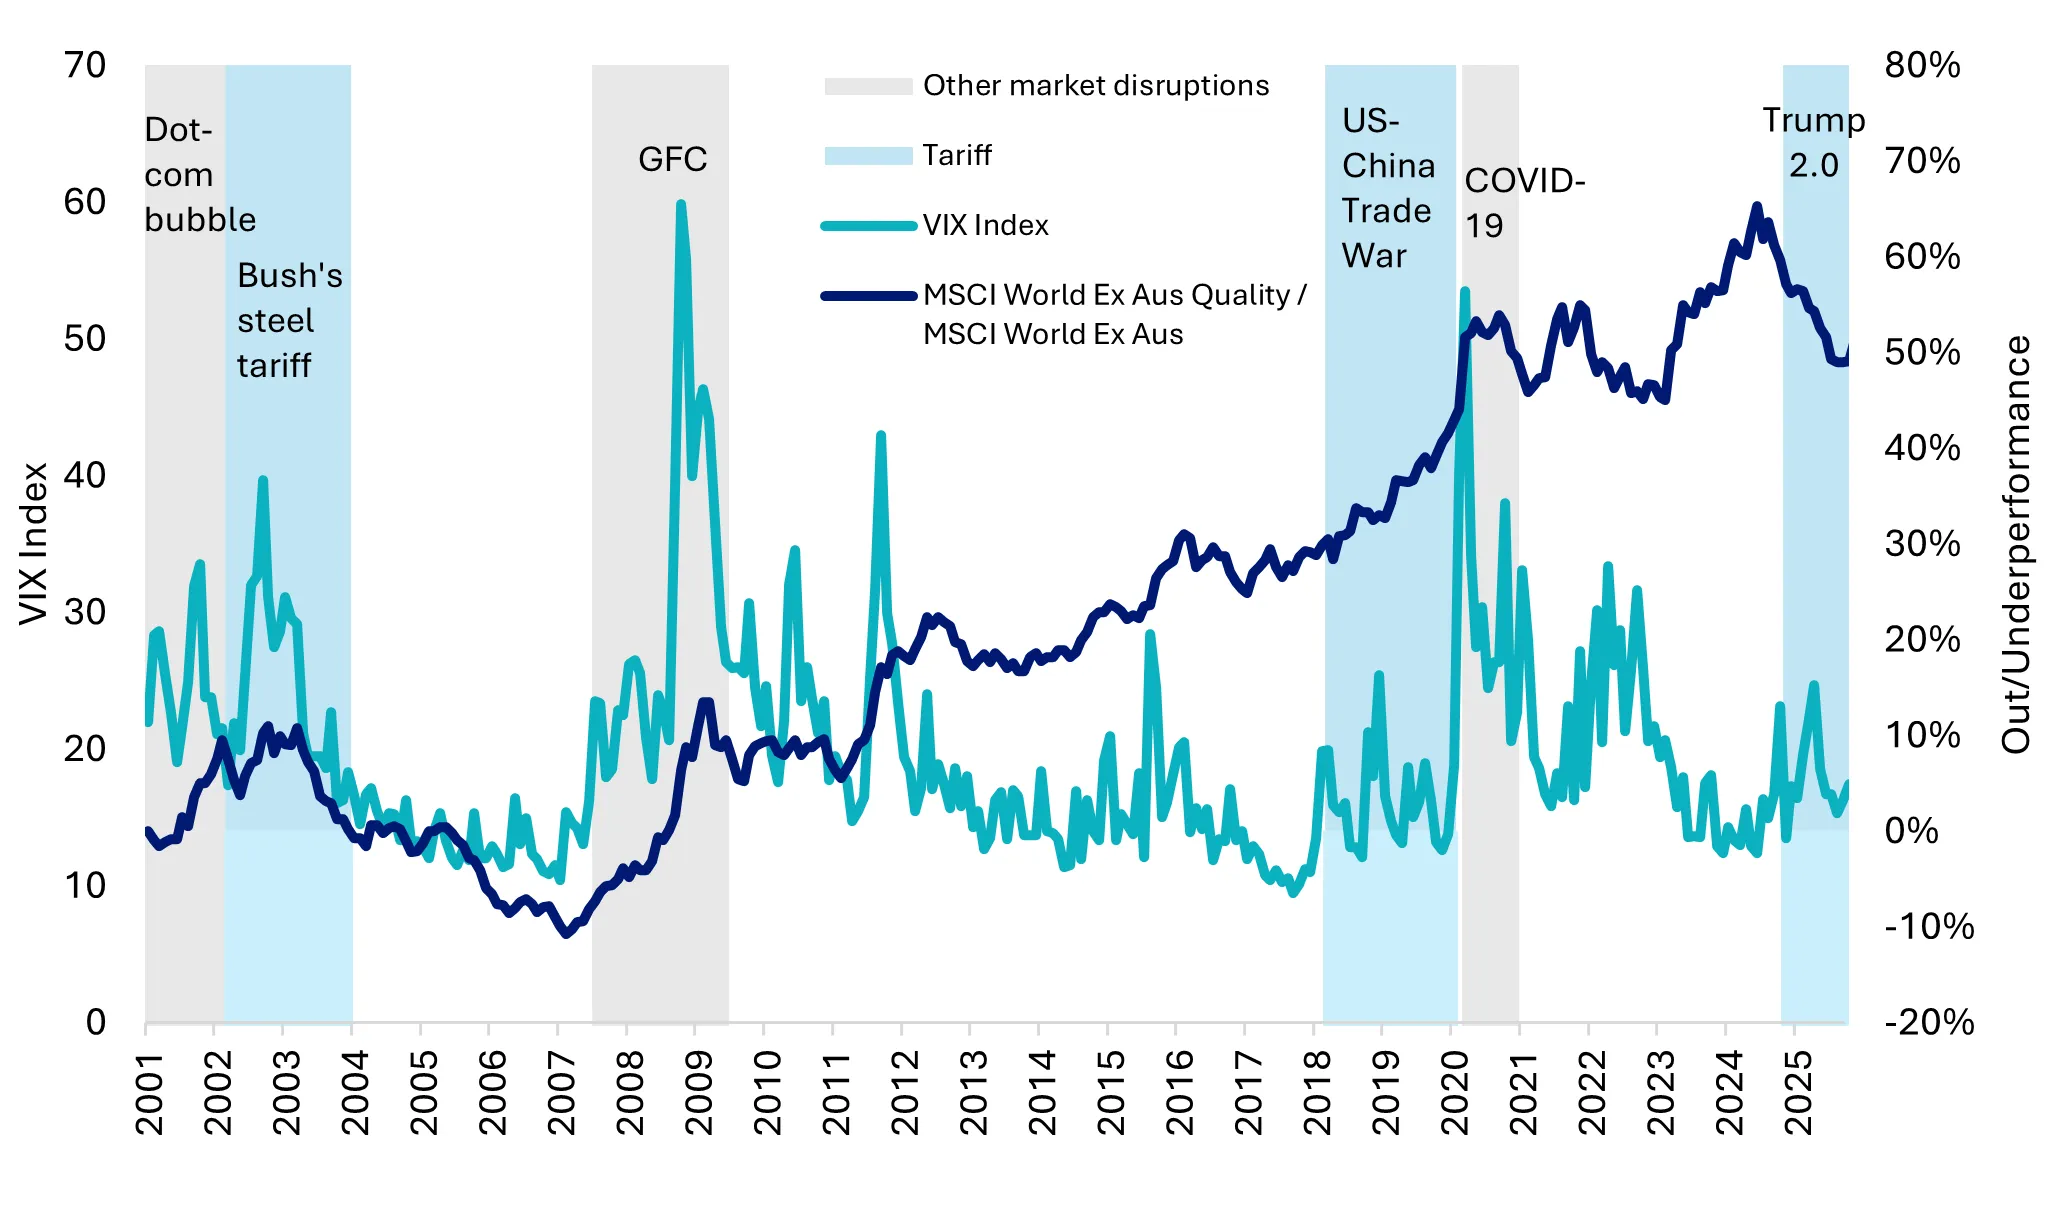
Source: VanEck Australia, Bloomberg. Performance in AUD. Data as at 26 November 2025. You cannot invest in an index. Past performance is not a reliable indicator of future performance. The MSCI World ex Australia Index (“MSCI World ex Aus”) is shown for comparison purposes, as it is the widely recognised benchmark used to measure the performance of developed market large- and mid-cap companies, weighted by market capitalisation.
Scenario two: What if: rising inflation + deteriorating growth (stagflation)
Macro environment:
Tariff impact has turned out to be more pronounced than expected, with geopolitical uncertainty further weakening the growth outlook. Surging input costs have suppressed business activity and led to meaningfully higher goods prices. The labour market is weakening as businesses rush to cut costs - a potential replay of the 1930s episode. The AI thematic has lost its appeal as the AI-linked debt market blows out, and investors rapidly reduce risk appetite and turn to defensive assets in equity markets.
Market implications:
A ‘flight to quality’ is triggered as risk-on assets dip into corrections, while quality stocks show resilience due to their defensive characteristics. Investors should consider allocating to quality companies in this scenario.
To prepare for the next cycle and capture international quality with one trade on the ASX, the VanEck MSCI International Quality ETF (QUAL) is a portfolio solution that provides investors with exposure to ~300 quality companies across geographies and sectors.
Furthermore, with QHAL, the Australian dollar hedged version of QUAL, you can also manage your desired currency exposure.
Key risks: An investment in the QUAL and QHAL carries risks associated with ASX trading time differences, financial markets generally, individual company management, industry sectors, foreign currency, currency hedging (QHAL), country or sector concentration, political, regulatory and tax risks, fund operations and tracking an index. See the PDS and TMD for details.
QUAL and QHAL are likely to be appropriate for a consumer who is seeking capital growth, is intending to use the product as a major, core, minor or satellite allocation within a portfolio, has an investment timeframe of at least 5 years, and has a high risk/return profile.


Published: 11 December 2025
Any views expressed are opinions of the author at the time of writing and is not a recommendation to act.
VanEck Investments Limited (ACN 146 596 116 AFSL 416755) (VanEck) is the issuer and responsible entity of all VanEck exchange traded funds (Funds) trading on the ASX. This information is general in nature and not personal advice, it does not take into account any person’s financial objectives, situation or needs. The product disclosure statement (PDS) and the target market determination (TMD) for all Funds are available at vaneck.com.au. You should consider whether or not an investment in any Fund is appropriate for you. Investments in a Fund involve risks associated with financial markets. These risks vary depending on a Fund’s investment objective. Refer to the applicable PDS and TMD for more details on risks. Investment returns and capital are not guaranteed.
QUAL and QHAL are indexed to a MSCI index. QUAL and QHAL are not sponsored, endorsed or promoted by MSCI, and MSCI bears no liability with respect to QUAL, QHAL or the MSCI Index. The PDS contains a more detailed description of the limited relationship MSCI has with VanEck and QUAL and QHAL.