So far this year, Value has beaten Silicon Valley
The AI-driven rally of the past 18 months has been remarkable, led by the momentum of a handful of companies. Markets have re-rated a handful of hyperscalers to near-historic valuations. Expectations of long-lasting growth and persistent AI adoption, and indeed, company results and guidance, have justified valuations.
Capital expenditure by these firms has surged to levels that would make some of the e-commerce companies of the dot-com era blush; impressive in scale, but increasingly a source of investor unease.
While the market chased the next AI headline, disciplined investors quietly compounded real returns.
Companies with robust balance sheets, tangible cash flows, and sensible multiples, long ignored in favour of “future optionality”, have been finding market favour as investors reassess what they are paying for growth. The dispersion in valuations between the market’s most expensive decile and the rest remains historically wide.
While the AI theme will continue to shape productivity and innovation, no one knows what the peak will be.
It has been in this environment that the growth and momentum factors have been popular. For allocators, the opportunity lies not in chasing the next headline, but in owning global businesses where fundamentals still determine outcomes. The value factor, unfashionable as it has been, is again proving that discipline outlasts hype.
VLUE has outperformed the tech-heavy AI barometer NASDAQ 100 by 7.49% since the beginning of the year (all data to 5 November 2025, source: Morningstar Direct), noting that past performance is not a reliable indicator of future performance.
Table 1: Performance as at 5 November 2025
| MTD (%) |
1 month (%) |
3 months (%) |
YTD (%) |
1 year (%) |
3 years (%p.a.) |
Since VLUE inception date (% p.a.) |
|
| VLUE | 0.23 | 2.78 | 11.99 | 24.12 | 29.52 | 18.78 | 13.94 |
| NASDAQ 100 | -0.20 | 5.03 | 10.78 | 16.63 | 29.94 | 33.42 | 21.94 |
| Difference | +0.43 | -2.25 | +1.21 | +7.49 | -0.42 | -14.64 | -8.00 |
| MSCI World Ex Australia Index | -0.04 | 2.17 | 7.02 | 13.33 | 22.30 | 21.80 | 16.47 |
Source: VanEck, Morningstar, Bloomberg. Results assume immediate reinvestment of all dividends and include management fees but exclude brokerage costs and taxes. Past performance is not a reliable indicator of future performance.
VLUE inception date is 8 March 2021 and a copy of the factsheet is here.
The comparison in table 1 to the NASDAQ 100 is shown for illustrative purposes only, as it is the widely recognised US and technology equities benchmark. VLUE’s index measures the performance of 250 international large- and mid-cap companies selected from the MSCI World ex Australia Index with high value scores relative to their peers at rebalance. Business involvement screens apply for weapons and tobacco. Consequently, VLUE’s index has more companies and different country and industry allocations than NASDAQ 100, which only includes US companies listed on the NASDAQ exchange. We normally compare VLUE's performance to the MSCI World ex Australia Index as it is the widely recognised benchmark used to measure the performance of developed market large- and mid-cap companies, weighted by market capitalisation. ‘Click here for more details’.
Value is a cyclical factor, and many investors may already be preparing for the next part of the cycle.
It’s not too late to add value
We believe that adding value is an important diversifier that can help investors navigate the impending macroeconomic environment. ETFs are an efficient tool to facilitate this.
The Purchasing Managers' Index (PMI) is an index used to measure the prevailing direction of economic trends in the manufacturing and service sectors. It measures the change in production levels across the economy from month-to-month, so is considered a key indicator of the state of the economy. The chart below shows the three-month rolling PMI changes since the start of 1998, highlighting the stage of the economic cycle at that time.
Chart 1: ISM Manufacturing PMI Index
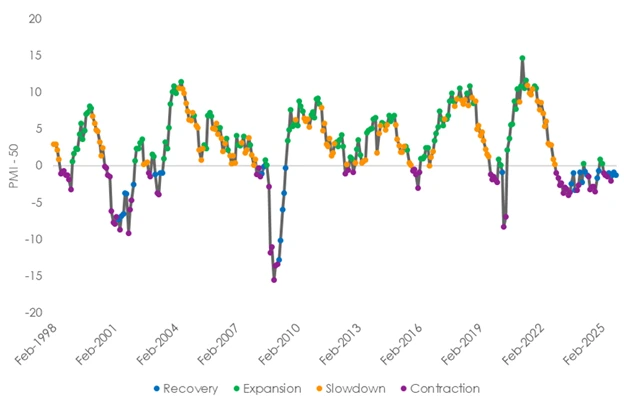
Source: VanEck, Bloomberg. November 1998 to October 2025.
We analysed the performance of MSCI’s equity style factors of enhanced value and growth over the different economic regimes charted above. The performance of enhanced value and growth broken up by each economic ‘regime’ is presented below.
Table 2: Total performance (% per annum) during different economic regimes
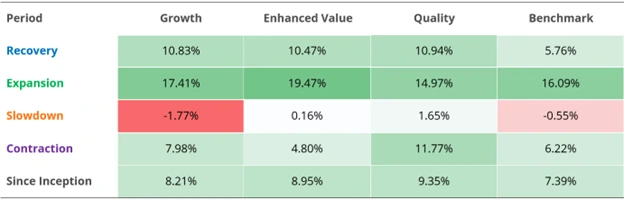
Source: VanEck, Bloomberg. November 1998 to October 2025. Past performance is not a reliable indicator of future performance. Growth is MSCI World Growth Index, Enhanced Value is MSCI Enhanced Value Index, Quality is MSCI World Quality Index and Benchmark is MSCI World Index.
US manufacturing activity has been stuck in a slowdown phase for the past three years. However, should manufacturing activity return to an expansionary environment, it could result in value continuing to outperform due to the 'pro-cyclical' nature of the factor. In past expansions and subsequent slowdowns, enhanced value outperformed growth.
Savvy investors can use ETFs to position for the macro environment for the rest of 2025 and beyond.
Investors may wish to consider the VanEck MSCI International Value ETF (VLUE) which tracks the MSCI World ex Australia Enhanced Value Top 250 Select Index (VLUE Index). In a market obsessed with momentum, VLUE’s rules-based enhanced value approach has delivered performance that’s anything but old-fashioned. VLUE represents a disciplined, data-driven, and targeted way to diversify away from concentrated U.S. tech risk and target the value factor.
HVLU is an Australian dollar hedged version of VLUE so you can now also manage your desired currency exposure.
Key risks: An investment in the ETF carries risks associated with: ASX trading time differences, financial markets generally, individual company management, industry sectors, foreign currency (VLUE), currency hedging (HVLU) country or sector concentration, political, regulatory and tax risks, fund operations, liquidity and tracking an index. See the PDS for details.
VLUE and HVLU are likely to be appropriate for a consumer who is seeking capital growth, intends to use each product as a major, core, minor, or satellite allocation within a diversified portfolio, has an investment timeframe of at least five years, and has a high risk/return profile.


Published: 07 November 2025
Any views expressed are opinions of the author at the time of writing and is not a recommendation to act.
VanEck Investments Limited (ACN 146 596 116 AFSL 416755) (VanEck) is the issuer and responsible entity of all VanEck exchange traded funds (Funds) trading on the ASX. This information is general in nature and not personal advice, it does not take into account any person’s financial objectives, situation or needs. The product disclosure statement (PDS) and the target market determination (TMD) for all Funds are available at vaneck.com.au. You should consider whether or not an investment in any Fund is appropriate for you. Investments in a Fund involve risks associated with financial markets. These risks vary depending on a Fund’s investment objective. Refer to the applicable PDS and TMD for more details on risks. Investment returns and capital are not guaranteed.
VLUE and HVLU are not sponsored, endorsed, or promoted by MSCI, and MSCI bears no liability with respect to VLUE and HVLU, or Parent Index. The PDS contains a more detailed description of the limited relationship MSCI has with VanEck and VLUE and HVLU.