Expert Analysis: Australian Small Companies
Australian investors are often attracted to Australian small companies because of their historical long-term outperformance above large companies. Historically, Australian small companies has been a domain that active managers have been able to show their worth. However, during the recent market falls, that is changing with many active small companies funds underperforming the S&P/ASX Small Ordinaries Index. Those with ‘value’ disciplines have held up well. Here we provide some insightful analysis for our popular VanEck Small Companies Masters ETF (MVS), which has a value and quality tilt, versus the S&P/ASX Small Ordinaries Index.
Australian investors are often attracted to Australian small companies because of their historical long-term outperformance above large companies. Historically, Australian small companies has been a domain that active managers have been able to show their worth. However, during the recent market falls, that is changing with many active small companies funds underperforming the S&P/ASX Small Ordinaries Index. Those with ‘value’ disciplines have held up well. Here we provide some insightful analysis for our popular VanEck Small Companies Masters ETF (MVS), which has a value and quality tilt, versus the S&P/ASX Small Ordinaries Index.
Most Australian portfolios have an allocation to Australian equities, often buying companies directly or via locally managed listed and unlisted funds. Often Australian investors’ exposures to are dominated by large- and mid-cap companies. This is because the benchmark index is Australia is dominated by mega-caps.
In Australia, the common definition of small listed companies are those outside the S&P/ASX 100. The Australian benchmark index for small companies, the S&P/ASX Small Ordinaries is designed to measure the performance of companies included in the S&P/ASX 300, but not in the S&P/ASX 100.
In the ‘smaller’ part of the market, companies tend to not be as heavily researched, not as much information is known about them, and therefore the market is considered inefficient. As a result, many active small-cap managers have been able to outperform the S&P/ASX Small Ordinaries Index (Small Ords) while charging high management costs. The problem is because of the small size of the market, in terms of capitalisation, many high pedigree small-cap managers are now capacity constrained and not open to new investors. Furthermore, the best ideas often get 'crowded' which means many managers chase the same names. This is bad in a downturn, in the face of redemptions, everyone in the crowded names head for the exit at the same time driving down the price.
In this current market environment many active small-cap managers who were outperforming, particularly those with a growth/momentum bias have struggled to match the Small Ords in 2022.
The rationale for considering small-cap companies is compelling, yet many investors are hesitant to invest in the Small Ords, preferring active management. But there is another ‘passive’ way to invest in Australian Small companies. VanEck Small Companies Masters ETF (ASX: MVS) is the only smart beta small-cap strategy available on ASX. MVS’s systematic approach to small companies investing focuses on liquidity and dividend payers and MVS has outperformed the Small Ords since the start of 2022. The most recent performance of MVS is available - here.
After we launched MVS, we released research: “Mastering small companies with smart beta” that analysed the reasons why MVS’s smart beta index, the MVIS Australia Small-Cap Dividend Payers Index (MVS Index) had outperformed the Small Ords over the long term.
The paper concludes that the outperformance is the result of its dividend filter, which produces a portfolio that:
- has a value and a quality tilt,
- provides exposure to stocks with low volatility, and
- avoids the problem of positive skew.
In past ‘value’ markets, similar to the one we are currently experiencing, MVS’s Index’s approach has outperformed. However it is important to note that past performance is by no means a reliable indicator of future performance.
Chart 1: Annual returns: MVS Index vs Small Ords, Value less Growth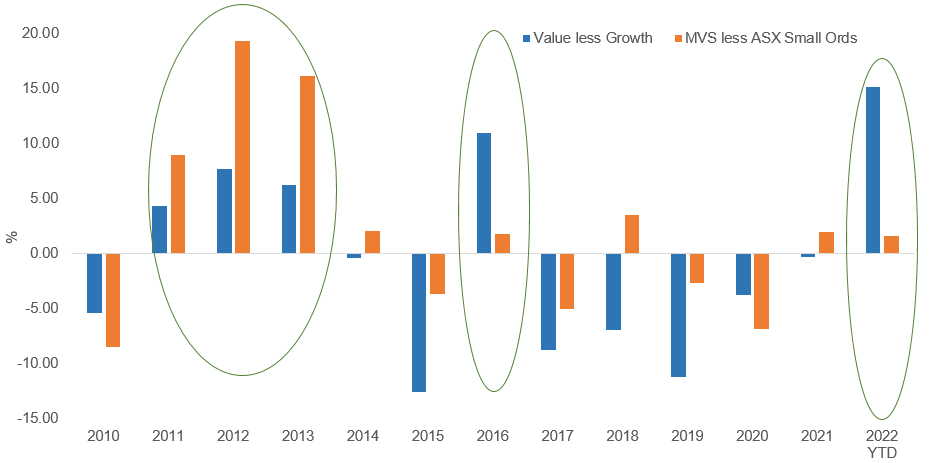
Source: Morningstar Direct as at 24 May 2022. Performance shown of the MVS Index prior to its launch date is simulated based on the current index methodology. Results assume immediate reinvestment of all dividends and exclude costs associated with investing in the ETF and taxes. You cannot invest directly in an index. Past performance is not a reliable indicator of future performance of the MVS Index or MVS. The S&P/ASX Small Ordinaries Index (“Small Ords”) is shown for comparison purposes as it is the widely recognised benchmark used to measure the performance of the 200 ASX-listed companies included in the S&P/ASX 300 but not in the S&P/ASX 100, weighted by market capitalisation. MVS’s index measures the performance of a portfolio of dividend paying small-cap companies, with a maximum weighting of 8%. It has fewer securities and different industry allocations than the Small Ords. ‘Click here for more details’
MVS’s total management cost makes it one of Australia’s lowest cost small-cap strategies and it does not have the same capacity constraints as many active managers.
Let’s walk through the difference between MVS and the Australian small-cap market capitalisation index that institutional and active managers compare themselves, the Small Ords.
MVS vs Small Ords – Fundamentals
Table 1: Statistics and fundamentals
|
|
MVS |
Small Ords |
|
Index strategy |
Smart beta – quality |
Market capitalisation weight |
|
Number of holdings |
81 |
200 |
|
12mth trailing Dividend Yield |
4.41% |
2.67% |
|
Dividend frequency |
Twice each year |
- |
|
Return on equity (ROE) (%) |
17.55 |
8.57 |
|
Price to earnings (P/E) (x) |
10.8 |
10.8 |
|
Price to book (P/B) (x) |
1.58 |
1.79 |
|
Price to sales (P/S) (x) |
1.59 |
1.85 |
|
Price to cash flow |
8.97 |
10.00 |
As you would expect, MVS, which focuses on dividend paying small companies has a higher yield. It also has higher return on equity and has lower value metrics such as price to book and price to sales.
MVS vs Small Ords – Sector holdings
Below you can see the sector holdings of MVS and the Small Ords. MVS is underweight materials because in the small-cap universe that sector includes many speculative explorers that are not paying dividends. MVS is overweight consumer staples and real estate.
Chart 2: MVS Sector weights Chart 3: Small Ords Sector weights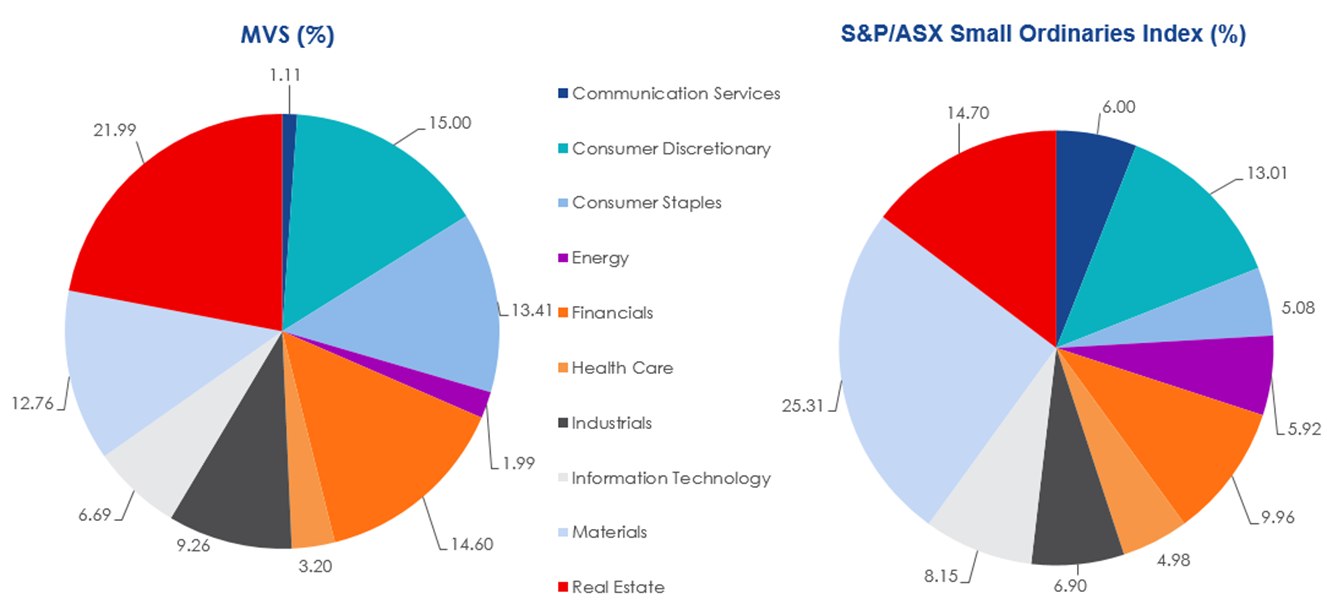
Source: VanEck, FactSet; as at 30 April 2022
Top 10 holdings
Below you can see the top 10 companies. As you would expect, in the Small Ords, with 200 companies the top 10 weights are small. The biggest holding is only 1.77% of the portfolio. MVS’s holdings represent a more meaningful exposure and it doesn’t have a long tail like the Small Ords - to see all the holdings in the holdings in MVS click here.
Table 2: Top 10 holdings MVS Table 3: Top 10 Small Ords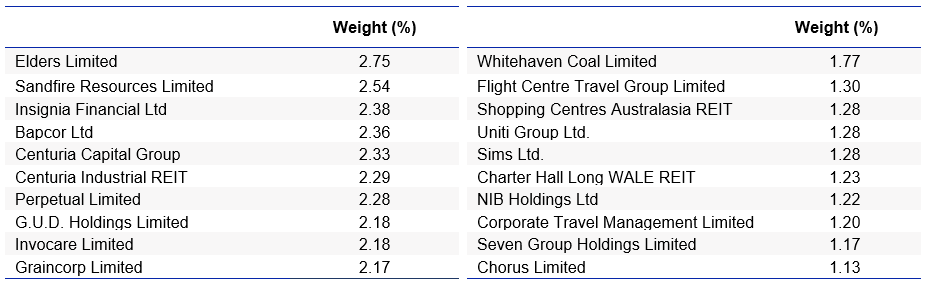
Source: FactSet, VanEck, S&P, as at 30 April 2022
MVS vs Small Ords - Style
When looking at portfolios it is important to determine what style, e.g. value or growth a portfolio holds. Below we can see MVS’s and the Small Ords’ style maps. MVS skews towards small/value compared to the Small Ords.
Chart 4: MVS holdings based style map Chart 5: Small Ords holdings based style map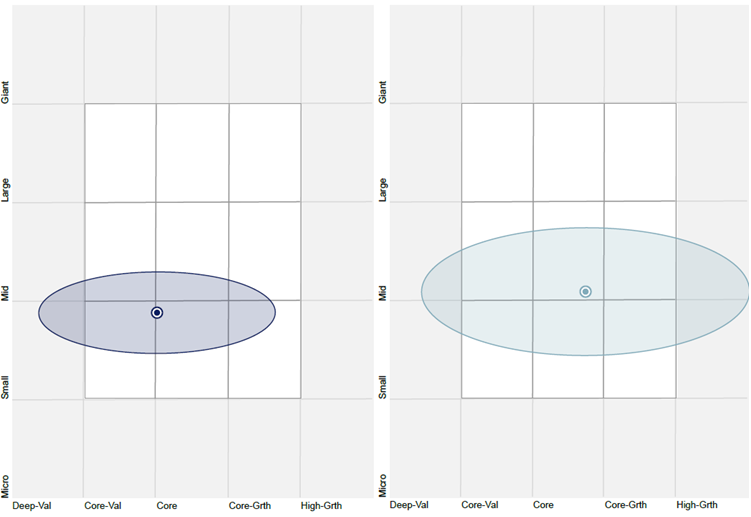
Source: Morningstar Direct, as at 30 April 2022
While small-cap investing has its perils. Each small-cap strategy has merits for portfolio inclusion, you should assess all the risks and consider your investment objectives.
Past performance is no guarantee of future performance. The above is not a recommendation. Please speak to your financial adviser or stock broker.
For further information you can contact us at +61 2 8038 3300.
Key risks
An investment in MVS carries risks associated with: financial markets generally, individual company management, industry sectors, stock and sector concentration, fund operations and tracking an index. See the PDS for details. No member of the VanEck group of companies guarantees the repayment of capital, the payment of income, performance, or any particular rate of return from any fund.


Published: 03 June 2022