The gaps in small caps: Australian vs international and the difference quality makes
Those backing the little companies should not despair. Australian investors need to know where to look.
Most Australian portfolios have an allocation to small companies. The attraction is supported by academic research. In 1981, Banz* found that “smaller firms (firms with low market capitalisation) have higher risk-adjusted returns than large firms on average”.
Intuitively, that makes sense, small sized companies have greater potential to grow in size more than larger companies that may already dominate the markets they compete. But Australian investors in small companies, have not experienced what the research suggested. The S&P/ASX Small Ordinaries Index has delivered lower cumulative returns relative to the broader, large-cap dominated S&P/ASX 200 Index over the long term.
Chart 1: Australian small companies have underperformed Australian larger companies
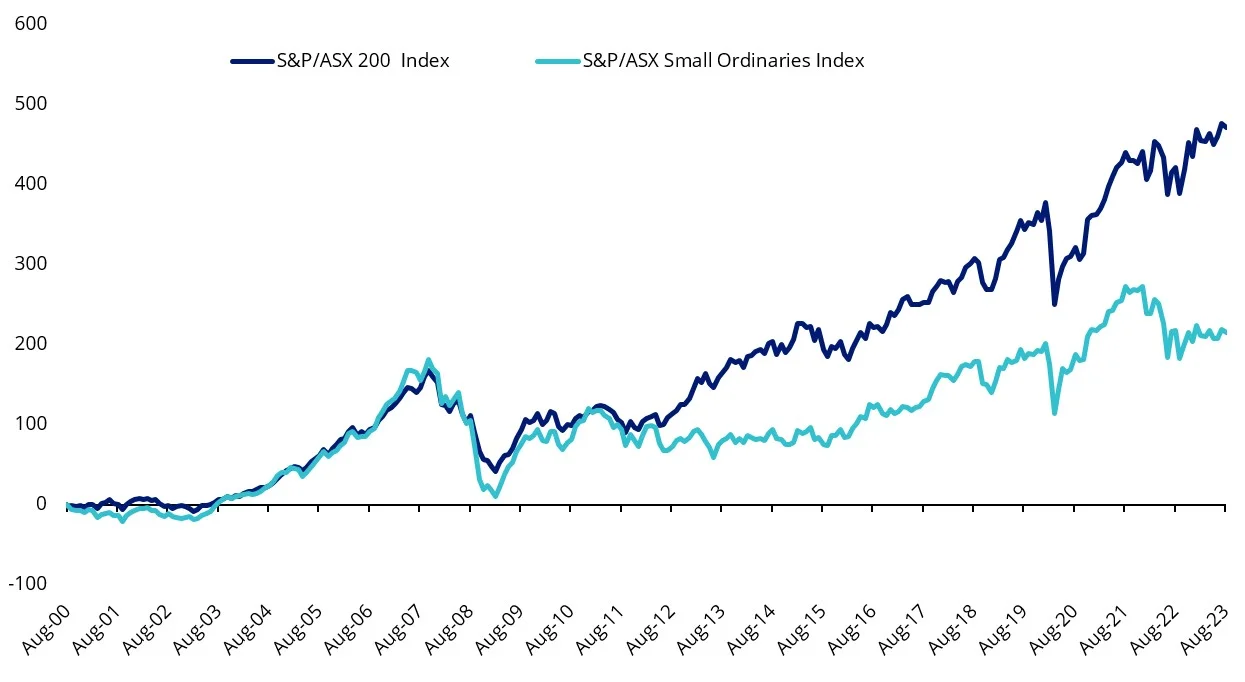
Source: Morningstar Direct, 23 August 2000 to 31 August 2023. Past performance is not indicative of future performance. You cannot invest in an index.
But let’s not discount small companies yet. There is a body of academic research supporting the notion that smaller-sized companies, tend to outperform larger-sized companies over the long term. So, let’s look offshore.
Size, too, is relative and the Australian share market represents just 2% of the global share market. If we consider global small companies, we can observe smaller firms, outperforming larger firms, on average. The MSCI World ex Australia Small Cap Index has outperformed the large-cap dominated versus MSCI World ex Australia Index over the long term.
Chart 2: International small companies have outperformed international larger companies
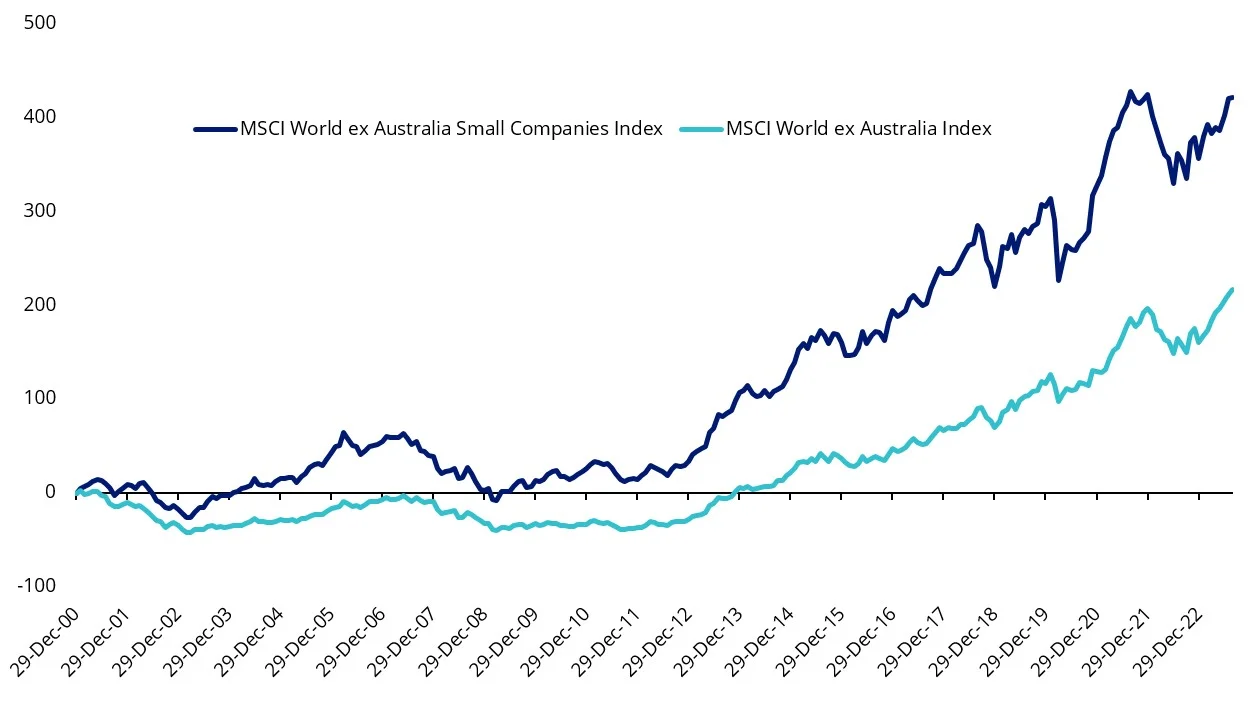
Source: Morningstar Direct, 31 December 1998 to 31 August 2023. Past performance is not indicative of future performance. You cannot invest in an index.
And, over the long term, global small companies have outperformed Australian small companies.
Chart 3: International small companies have outperformed Australian small companies
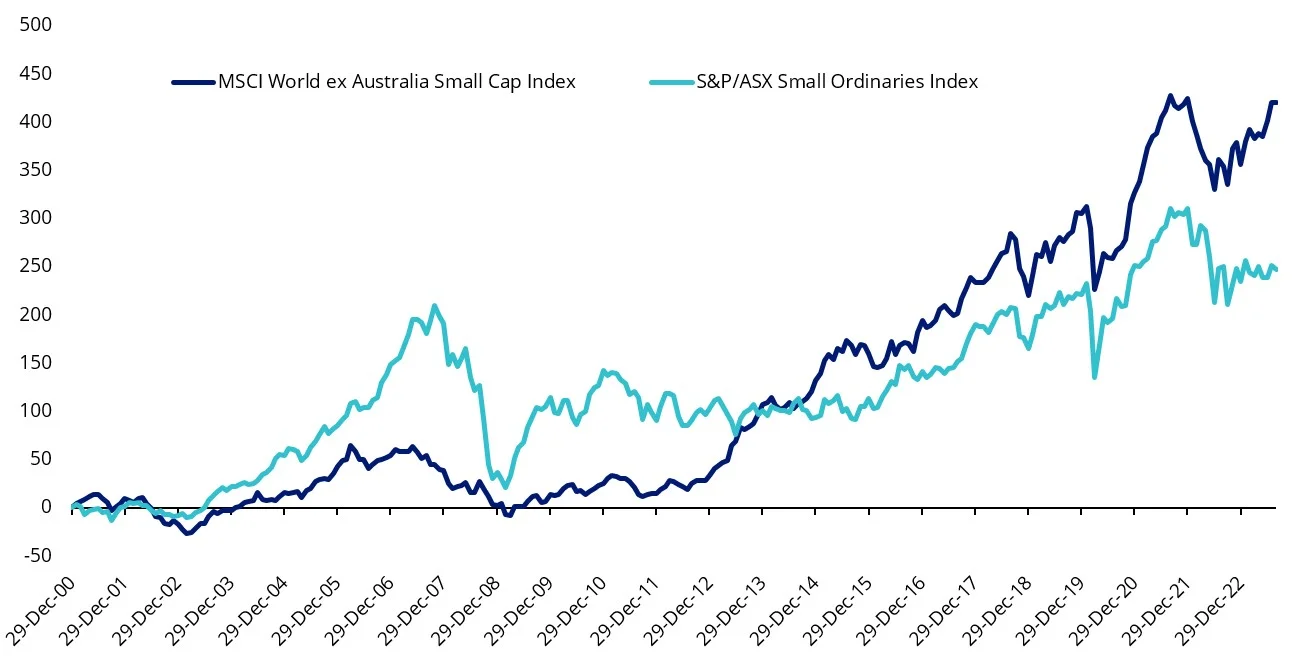
Source: Morningstar Direct, 31 December 1998 to 31 August 2023. Past performance is not indicative of future performance. You cannot invest in an index.
But most Australian portfolios do not have international small companies in their portfolios. The MSCI World ex Australia Small Cap Index (the International Small Cap Index) includes over 4,500 companies and there is no way they are all desirable from an investment point of view.
Earlier this year we wrote a research paper “Finding the pawns that will become Queens” that raised the question: Given many Australian portfolios have an allocation to Australian Small Caps, why not international Small Caps?
The rationale for considering international small-cap companies is compelling, potentially more so than Australian small-caps. Yet while Australian investors recognise the small-cap opportunity and are invested via the local small-cap market, because of limited opportunities and difficulty of access, it is likely that an Australian investor’s international small-cap exposure does not echo their domestic exposure.
In terms of approaches, many Australian investors would be aware of our international quality ETF, QUAL which tracks the MSCI World ex Australia Quality Index and targets international companies with a high return on equity (ROE), low leverage and stable earnings. VanEck also offers the VanEck MSCI International Small Companies Quality ETF, with the ticker QSML, and it tracks the MSCI World ex Australia Small Cap Quality 150 Index. We affectionately call QSML “baby QUAL” because it harvests the Quality Factor, using the same fundamentals as QUAL, but in the international Small Cap universe.
So, let’s walk through the difference between QSML and the International Small Cap Index.
QSML vs International Small Cap Index – Fundamentals
Table 1: Statistics and fundamentals
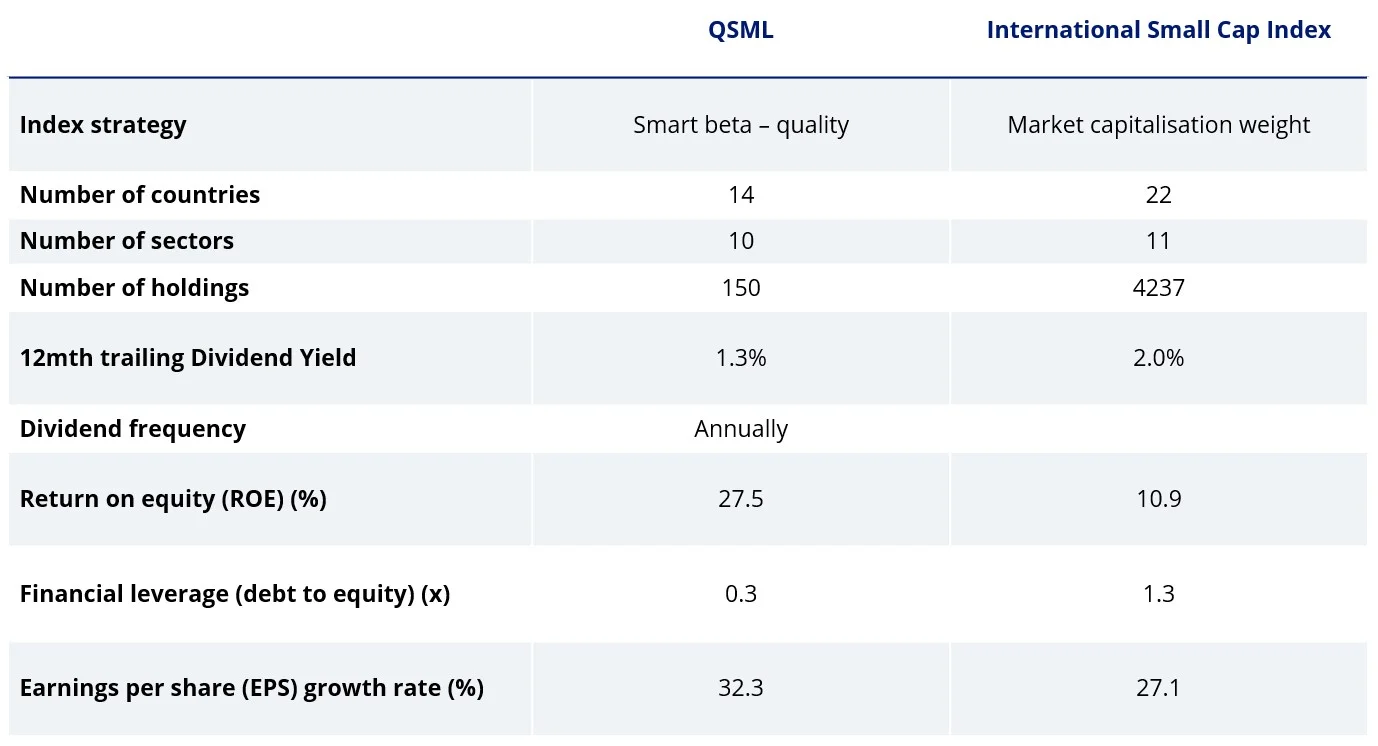
Source: VanEck, MSCI, FactSet, as at 31 August 2023. You cannot invest directly in an index. International Small Cap Index is MSCI World ex Australia Small Cap Index.
As you would expect, QSML has higher ROE, lower debt to equity and a higher EPS growth rate.
QSML vs International Small Cap Index - Performance
Above we presented index data back to 2000. QSML was listed on ASX in March 2021. In that time, it has outperformed the International Small Cap Index. Based on back testing after fees, QSML’s Index (net of QSML’s 0.59% p.a. management fee) displays long-term outperformance against the MSCI World ex Australia Small Cap Index, as highlighted by the chart below. And as we always caution, past performance is not indicative of future results.
Chart 4: Modelled cumulative performance: QSML Index after fees1vs MSCI World ex Australia Small Cap Index
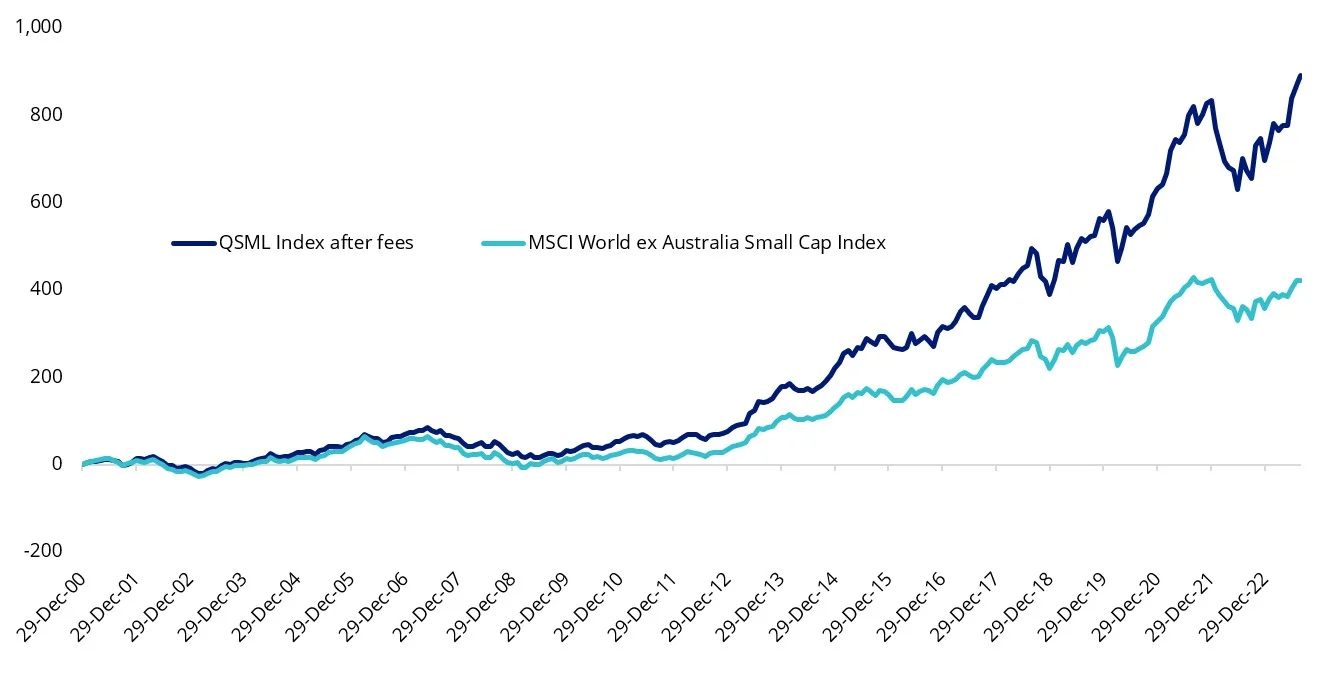
Table 2: Trailing returns: QSML, QSML Index after fees1 vs MSCI World ex Australia Small Cap Index
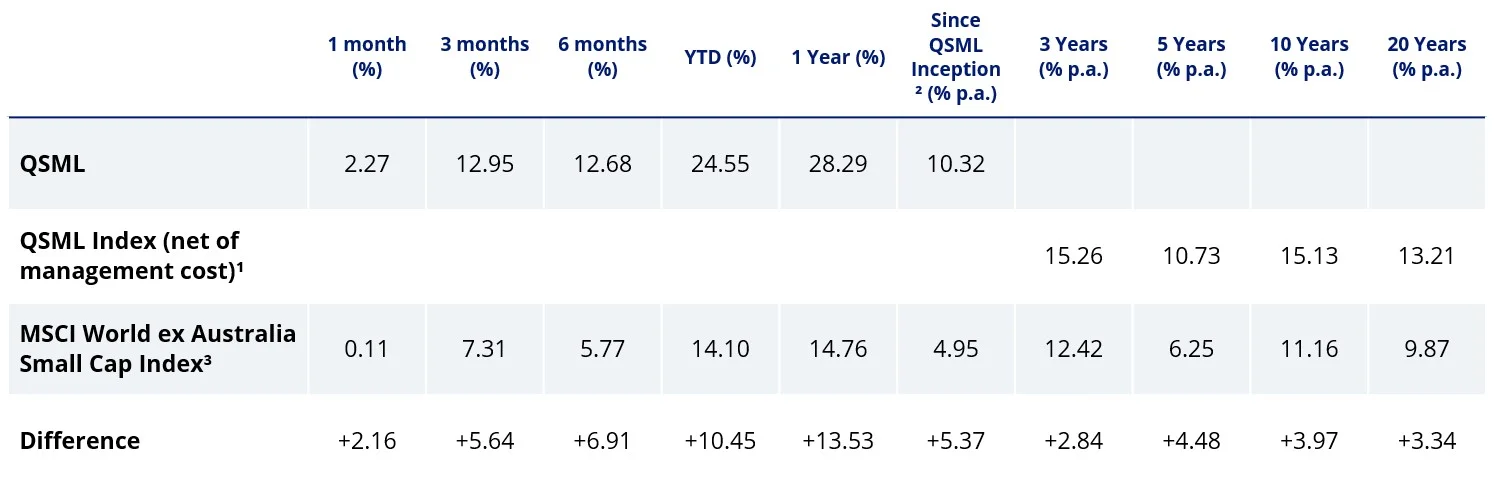
Chart 4 and Table 2 Source: VanEck, Morningstar, Bloomberg as at 31 August 2023. Past performance is not a reliable indicator of future performance. Results are calculated to the last business day of the month and assume immediate reinvestment of distributions. ETF results are net of management fees and costs, but before brokerage fees or bid/ask spreads incurred when investors buy/sell on the ASX. Returns for periods longer than one year are annualised.
1QSML Index results are net of QSML’s 0.59% p.a. management fee, calculated daily but do not include brokerage costs or buy/sell spreads of investing in QSML. You cannot invest in an index. QSML’s Index base date is 30 November 1998. QSML Index performance prior to its launch in February 2021 is simulated based on the current index methodology.
2QSML inception date is 8 March 2021 and a copy of the factsheet is here.
3The MSCI World ex Australia Small Cap Index (Parent Index) is shown for comparison purposes as it is the widely recognised benchmark used to measure the performance of developed market small companies, weighted by market cap. QSML Index measures the performance of 150 companies selected from the Parent Index based on MSCI quality scores. Consequently, the QSML Index has fewer companies and different country and industry allocations than the Parent Index. ‘Click here for more details’. .
QSML vs International Small Cap Index - Style
When looking at portfolios it is important to determine what style, e.g. value or growth and what size bias a portfolio holds, e.g. giant, large, mid or small. Below we can see QSML’s. Importantly QSML skews towards mid-sized companies and it has a greater growth bias than the International Small Cap Index.
Chart 5: QSML holdings based style map
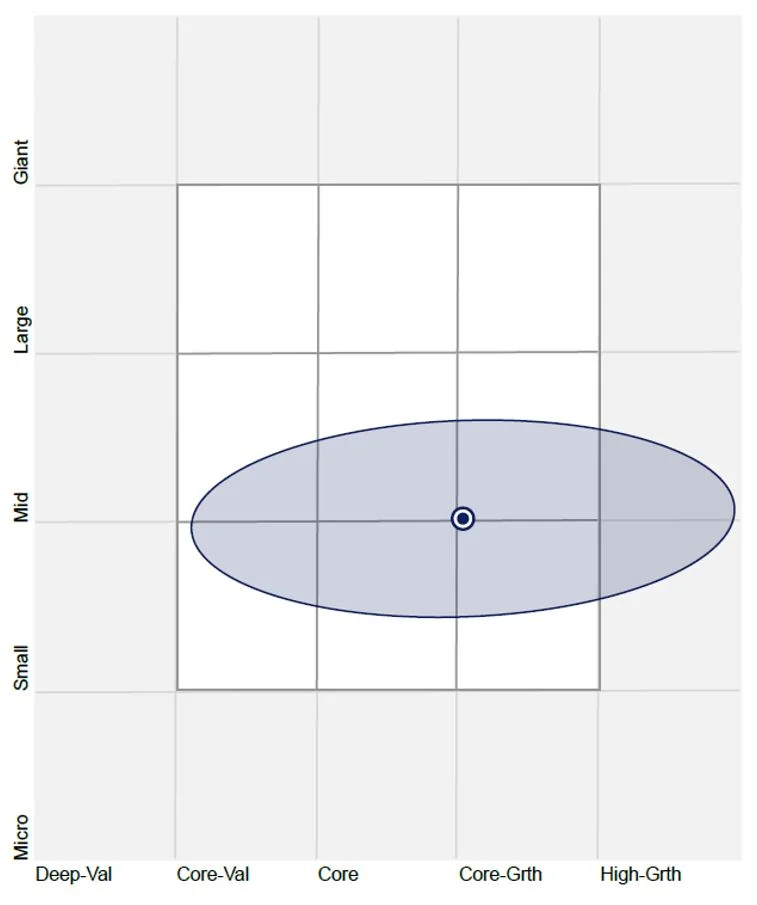
Chart 6: International Small Cap Index holdings based style map
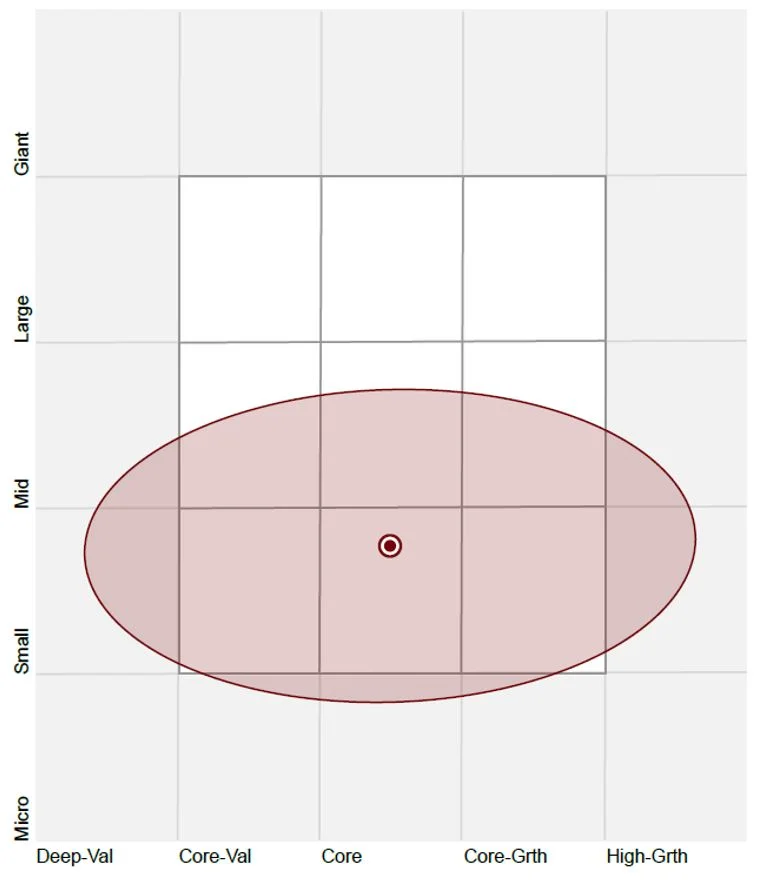
Source: Morningstar Direct, as at 31st August 2023.
While each International Small Company approach has its merit for portfolio inclusion, you should assess all the risks and consider your investment objectives.
Past performance is no guarantee of future performance. The above is not a recommendation. Please speak to your financial adviser or stock broker.
Key risks
An investment in QSML carries risks associated with: ASX trading time differences, financial markets generally, individual company management, industry sectors, foreign currency, country or sector concentration, political, regulatory and tax risks, fund operations, liquidity and tracking an index. See the PDS for details. No member of the VanEck group of companies guarantees the repayment of capital, the payment of income, performance, or any particular rate of return from any fund.
*Banz, R. W. (1981). “The relationship between return and market value of common stocks,” Journal of Financial Economics 9(1), 3–18.


Published: 15 September 2023
Any views expressed are opinions of the author at the time of writing and is not a recommendation to act.
VanEck Investments Limited (ACN 146 596 116 AFSL 416755) (VanEck) is the issuer and responsible entity of all VanEck exchange traded funds (Funds) listed on the ASX. This is general advice only and does not take into account any person’s financial objectives, situation or needs. The product disclosure statement (PDS) and the target market determination (TMD) for all Funds are available at vaneck.com.au. You should consider whether or not an investment in any Fund is appropriate for you. Investments in a Fund involve risks associated with financial markets. These risks vary depending on a Fund’s investment objective. Refer to the applicable PDS and TMD for more details on risks. Investment returns and capital are not guaranteed.
QSML and QUAL are indexed to a MSCI index. QSML and QUAL are not sponsored, endorsed or promoted by MSCI, and MSCI bears no liability with respect to QUAL, QSML or the MSCI Index. The PDS contains a more detailed description of the limited relationship MSCI has with VanEck, QUAL and QSML.