In small-caps, look for growth, but don’t overpay
Most Australian portfolios have an allocation to small companies. The attraction is supported by academic research. In 1981, Banz1found that “smaller firms (firms with low market capitalisation) have higher risk-adjusted returns than large firms on average”.
Small companies have long presented opportunities for growth but a lack of research coverage. Australian investors may be familiar with the S&P/ASX Small Ordinaries Index (“Small Ords”) and information and analysis of many of the 200 companies in this index is not readily available. This means that many investment opportunities go unnoticed as small companies are often mispriced and in Australia, trade in an inefficient market.
But the problem for Australian investors is that, traditionally, to invest in Australian small companies it has been either:
- time consuming and risky for direct investors; or
- costly for indirect investors in actively managed small companies funds.
Among the analysis that many active small company managers undertake is a review of the growth potential of the company. They also assess profitability and cash flows. Of course they are wary of overypaying for a company too, so look for value. This type of analysis is a growth at a reasonable price. In the industry the jargon for this is GARP.
GARP analysis has typically been the domain of active managers.
Now innovations in index design allow ETFs to track indices that have been created using many of the tools active managers use to assess companies. MarketGrader is one such company at the forefront of this innovation.
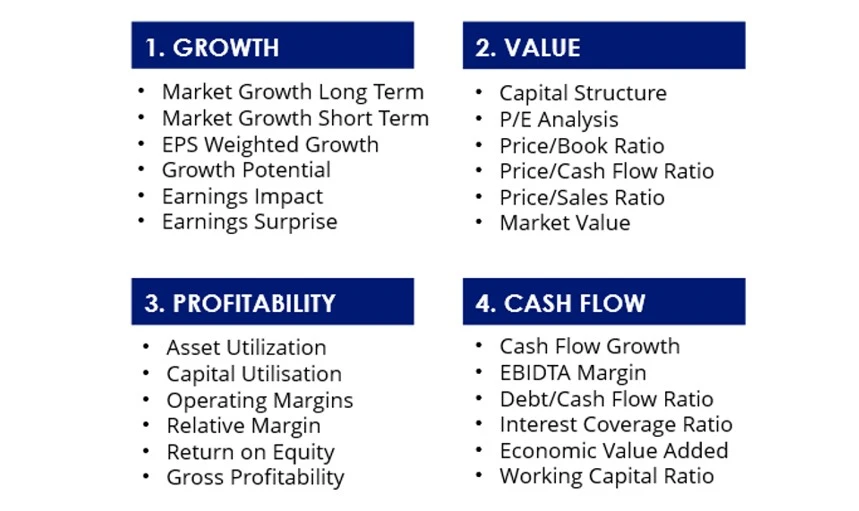
The MarketGrader Australia Small Cap 60 Index assesses all companies in the universe of Australian Small Companies, and then grades all of these based on 24 fundamental indicators across four analytical categories: growth; value; profitability; and cash flow.
Chart 1: MarketGrader Research: A focus on fundamentals
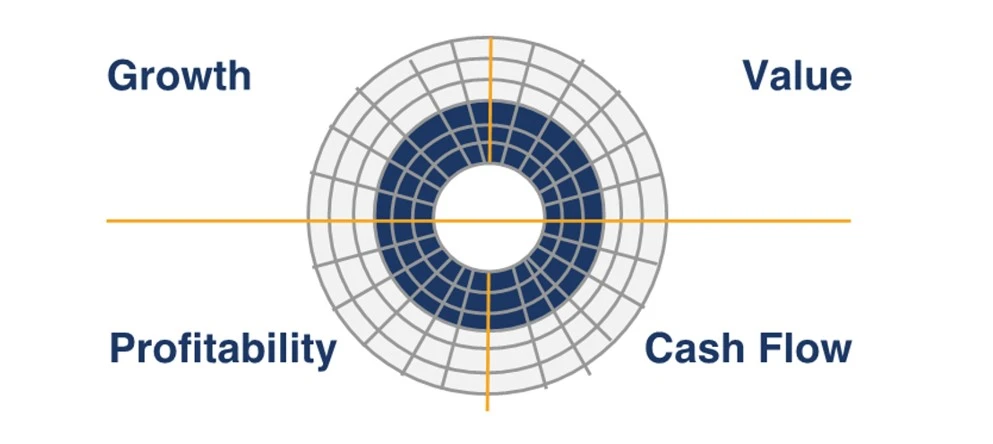
Source: MarketGrader Research
This is a GARP analysis. The index includes securities that offer the best potential for ‘growth at a reasonable price’, grading securities from 0 to 100.
Companies with a score less than 40 (which would make them a ‘sell’) are excluded. The small companies remaining are then ranked by their earnings yield, to ensure only companies with strong balance sheets are included. The top 60 are selected.
The VanEck Small Companies Masters ETF (MVS) now tracks MarketGrader Australia Small Cap 60 Index.
Let’s look under the hood of MVS relative to the small ords.
MVS vs S&P/ASX Small Ordinaries Index – Fundamentals
Table 1: Statistics and fundamentals
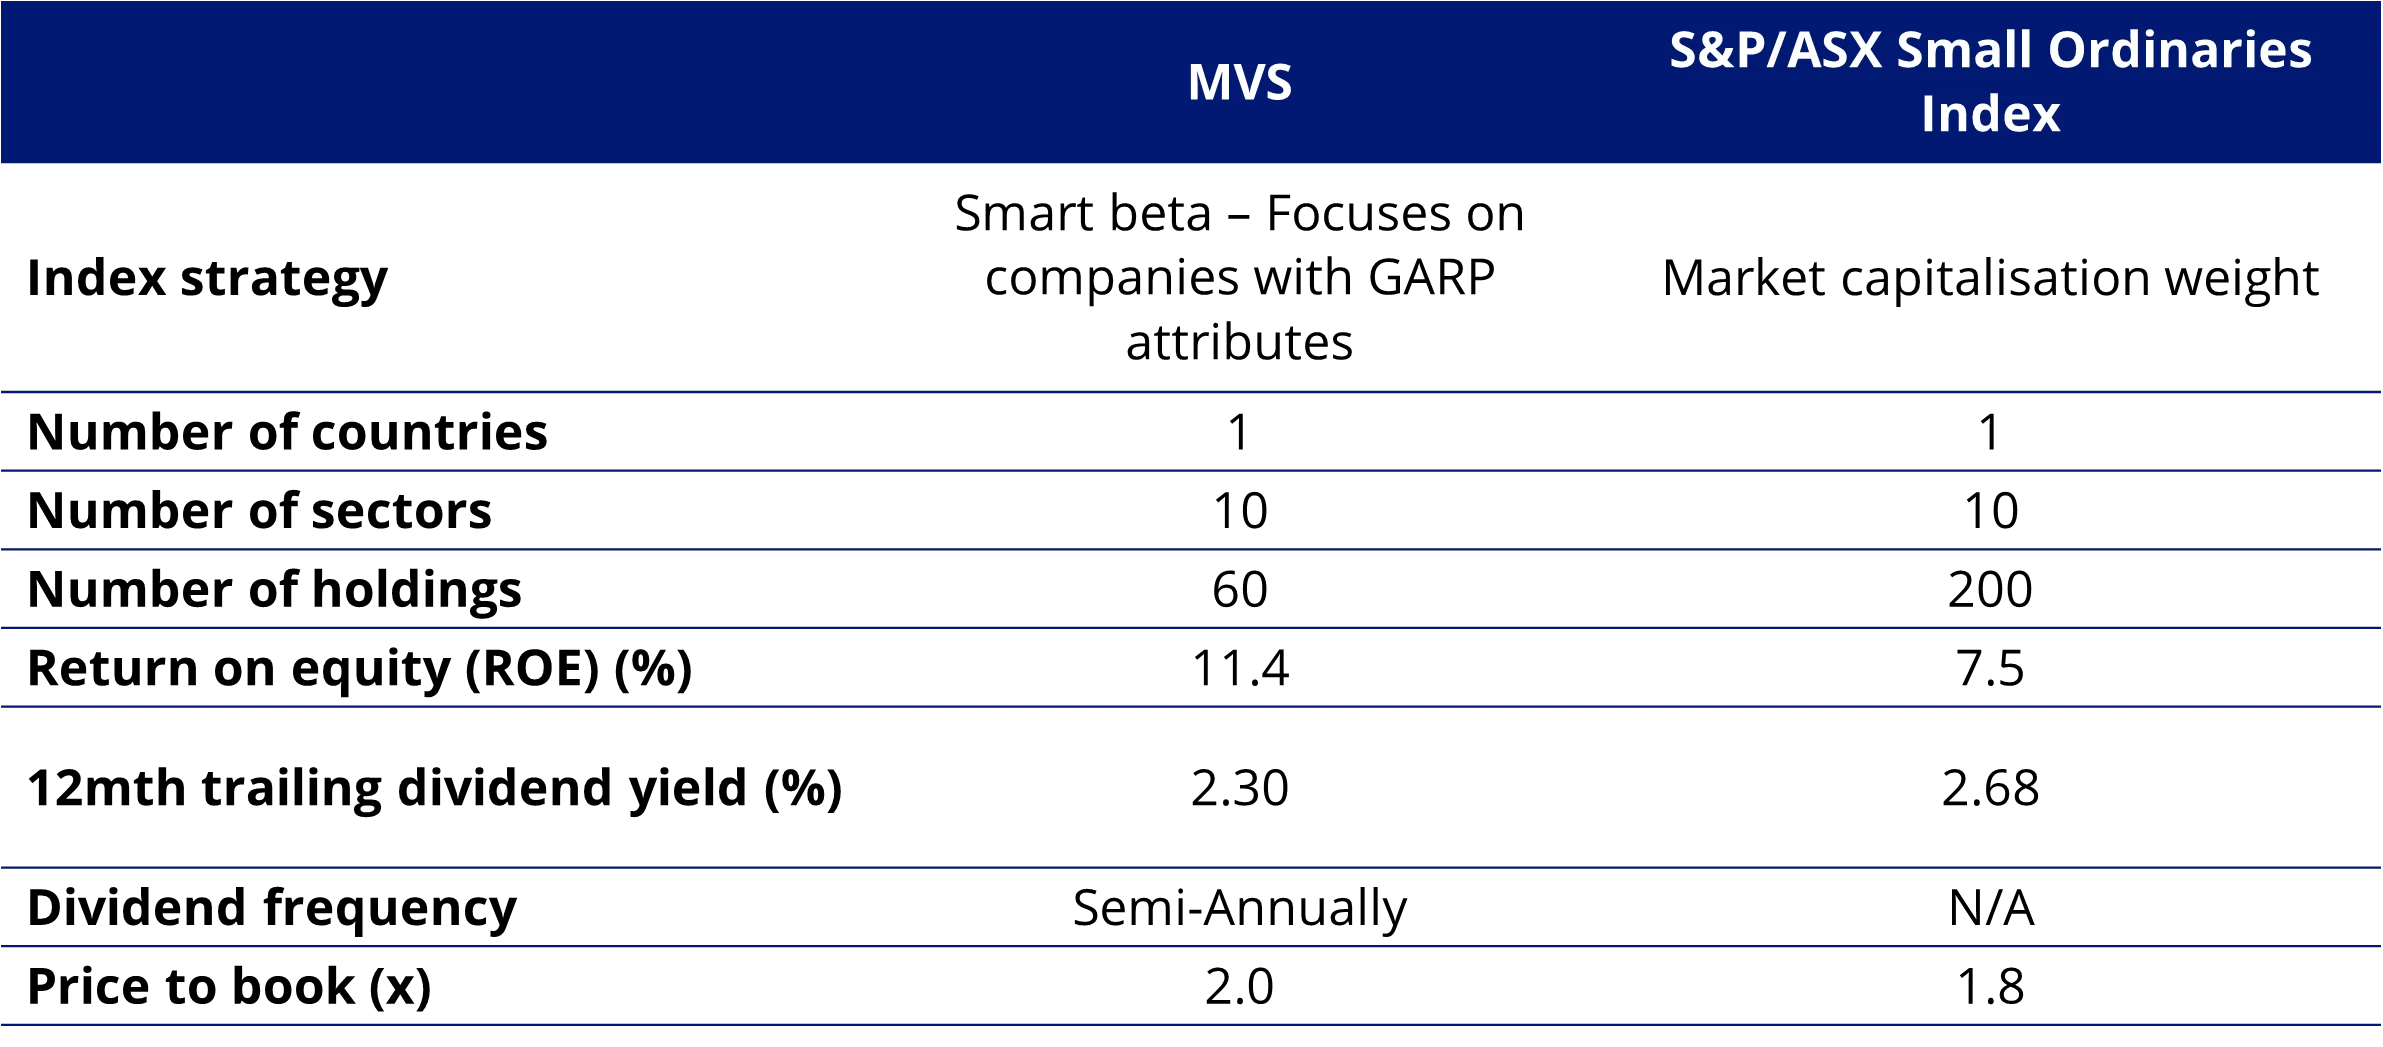
Source: FactSet, VanEck, as at 24 September 2024. You cannot invest directly in an index. The dividend yield is not an indication of future dividends.
As you would expect, MVS has higher ROE than the Small Ords.
MVS vs S&P/ASX Small Ordinaries Index - Top 10 holdings
Below you can see the top 10 companies. The differences are stark – to see all the holdings in MVS and their weightings click here.
Table 2 & 3: Top 10 Holdings MVS, S&P/ASX Small Ordinaries Index
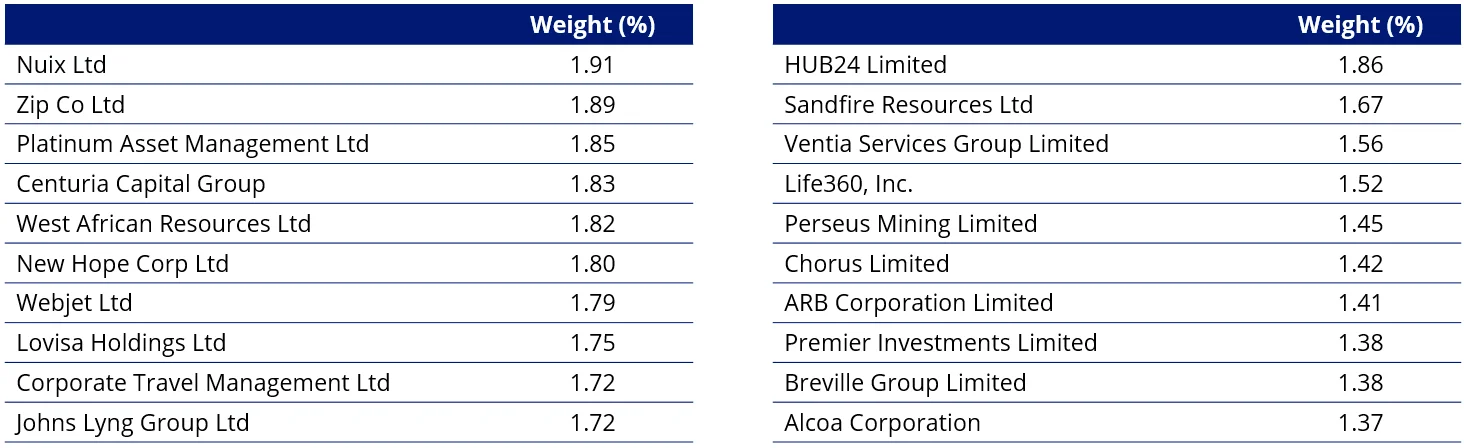
Source: FactSet, VanEck, as at 24 September 2024. FactSet, VanEck, S&P, as at 24 September 2024
MVS vs S&P/ASX Small Ordinaries Index - Sectors
MVS is currently underweight the real estate sector by 11.09%. Conversely, it is overweight industrials (+6.93%), financials (+3.01%) and materials (+2.11%).
Chart 2: MVS and S&P/ASX Small Ordinaries Index sector weightings
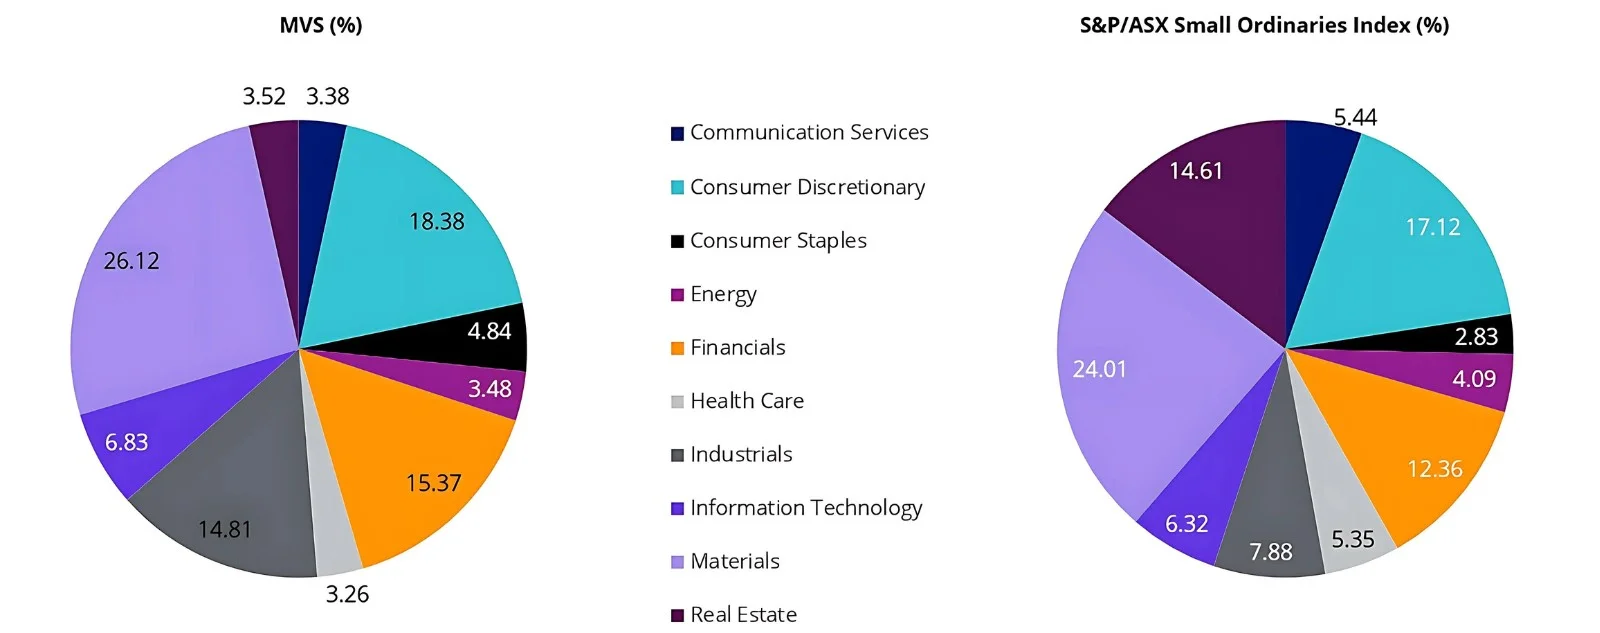
Source: Factset, 24 September 2024
MVS and S&P/ASX Small Ordinaries Index- Style
When looking at portfolios it is important to determine what style, e.g. value or growth and what size bias a portfolio holds, e.g. mega, large, mid or small. Below we can see MVS’s. Importantly MVS skews towards smaller-sized companies and it has a greater core/value bias than the Small Ords.
Chart 3 & 4: MVS holdings-based style map, S&P/ASX Small Ordinaries Index holdings-based style map
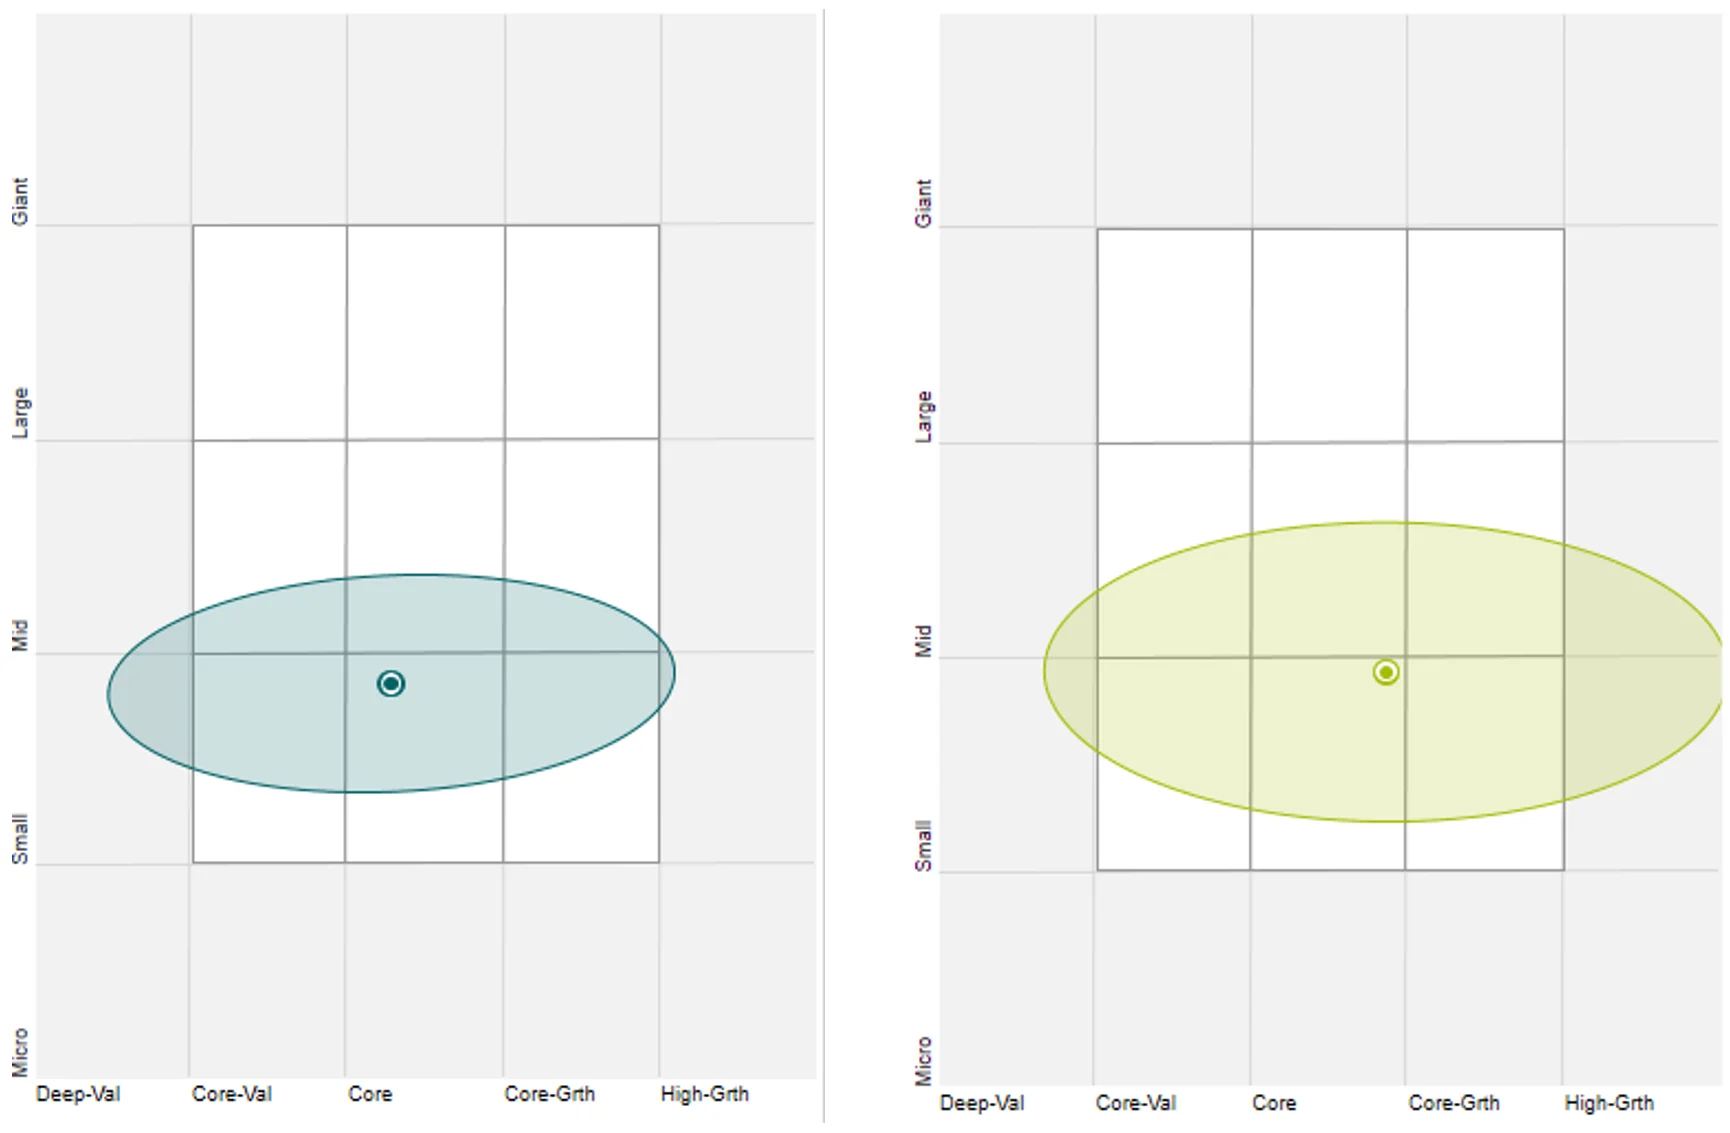
Source: Morningstar Direct, as at 24 September 2024
The benefits of MVS’s approach
The advantage of the MVS approach, in addition to low fees and full transparency, is that because this is a rules-based strategy, no investment manager’s bias can sway the portfolio. The portfolio won’t hold onto a stock for too long because someone is in ‘love’ with it, nor will it trade because of a feeling.
This innovative approach gives investors the best of both active and passive worlds, a portfolio with the potential to outperform like an actively managed fund, but with the benefits of low costs associated with passive management.
While different small company approaches can be considered for portfolio inclusion, you should assess all the risks and consider your investment objectives.
Past performance is no guarantee of future performance. The above is not a recommendation. Please speak to your financial adviser or stock broker.
For further information you can contact us at +61 2 8038 3300.
Key risks
An investment in the ETF carries risks associated with: financial markets generally, individual company management, industry sectors, stock and sector concentration, fund operations and tracking an index. See the PDS for details.
Source
1Banz, R. W. (1981). “The relationship between return and market value of common stocks,” Journal of Financial Economics 9(1), 3–18.


Published: 26 September 2024
Any views expressed are opinions of the author at the time of writing and is not a recommendation to act.
VanEck Investments Limited (ACN 146 596 116 AFSL 416755) (VanEck) is the issuer and responsible entity of all VanEck exchange traded funds (Funds) trading on the ASX. This information is general in nature and not personal advice, it does not take into account any person’s financial objectives, situation or needs. The product disclosure statement (PDS) and the target market determination (TMD) for all Funds are available at vaneck.com.au. You should consider whether or not an investment in any Fund is appropriate for you. Investments in a Fund involve risks associated with financial markets. These risks vary depending on a Fund’s investment objective. Refer to the applicable PDS and TMD for more details on risks. Investment returns and capital are not guaranteed.