The fuss about Australian equities
Australia's market is highly concentrated. Explore why equal weighting could offer better diversification and potential outperformance.
The Australian ETF industry crossed back over the $250 billion mark in April, after regressing in the two months prior due to market declines. This marked the 10th consecutive month of $3 billion-plus flows into Australian-based ETFs. A noticeable trend in April was investors rotating out of US stocks. One of the beneficiaries has been Australian equity ETFs, which experienced inflows of around $1.7 billion in April.
A review of the flows highlights that much of this money has been into ETFs that track the broad Australian benchmark indices of the largest two or three hundred companies. We think such an approach could limit investors’ opportunities while also exposing them to a potential risk.
This is because ETFs that track indices like the S&P/ASX 200 or S&P/ASX 300 are what are called ‘market capitalisation’ indices. A company’s representation in a market capitalisation index is in proportion to its size, the bigger the company, the larger its representation in the index. Most of the indices quoted in the media, such as the S&P 500 and FTSE 100 are market capitalisation indices. These indices were designed to be barometers of the market’s health and were not designed to be the basis of an investment. However, as investing evolved, passive fund managers started to track these indices, giving their investors benchmark-like returns.
Not everyone is happy with benchmark-like returns. Active fund managers try to outperform market capitalisation benchmarks. They think they can outperform these benchmarks because of some of the shortcomings of these benchmarks. This includes:
- Weighting a fund according to market capitalisation can have a negative impact on performance. This is because when the market overvalues a stock, its market capitalisation goes up. A fund tracking a traditional market capitalisation index buys more and more of the overpriced stock and loses money when the market corrects. Conversely, when the market undervalues a stock, the fund sells more and more of the underpriced stock, missing profit when the market corrects.
- An investor seeking to maximise returns wants to allocate more to those companies with the greatest growth potential. By allocating to a market capitalisation index, the assumption investors are making is that those companies with the greatest growth potential are the largest, because they get more of the investment. This issue is more problematic in concentrated markets. The S&P/ASX 200 exposes investors to excessive concentration risk. The top 10 companies represent over 50% of the index. Four of the top six companies are banks. Financials make up over nearly a third of the index. Investors buying a fund that ostensibly contains 200 stocks would likely assume such a broad-based fund to be better diversified.
It has been observed that not all active funds outperform market capitalisation indices. Hence, the popularity of passive funds such as ETFs. Index innovations have given rise to different index methodologies, such as equal weight, that have been created. Funds that track these indices aim to give investors the best of low-cost passive investing combined with the targeted outcomes of active management. The term for indices constructed differently from market capitalisation indices is ‘smart beta’. Large institutional investors have been using them for many years.
The equal-weight Index that MVW tracks is a smart beta index. Equal weighting of Australian equities allocates exposure away from mega-cap stocks. MVW therefore, will have greater exposure to companies outside the top 10, and is more diversified than the market capitalisation index.
Since its launch, MVW has outperformed the S&P/ASX 200.
Let’s walk through the difference between MVW and the S&P/ASX 200, and we will start with performance.
MVW vs S&P/ASX 200 - Performance
Equal weight investing has served Australian investors well. Since its inception on ASX in 2014, MVW has outperformed the S&P/ASX 200 by 1.16% p.a.
Chart 1: Cumulative performance since MVW inception date to 15 May 2025
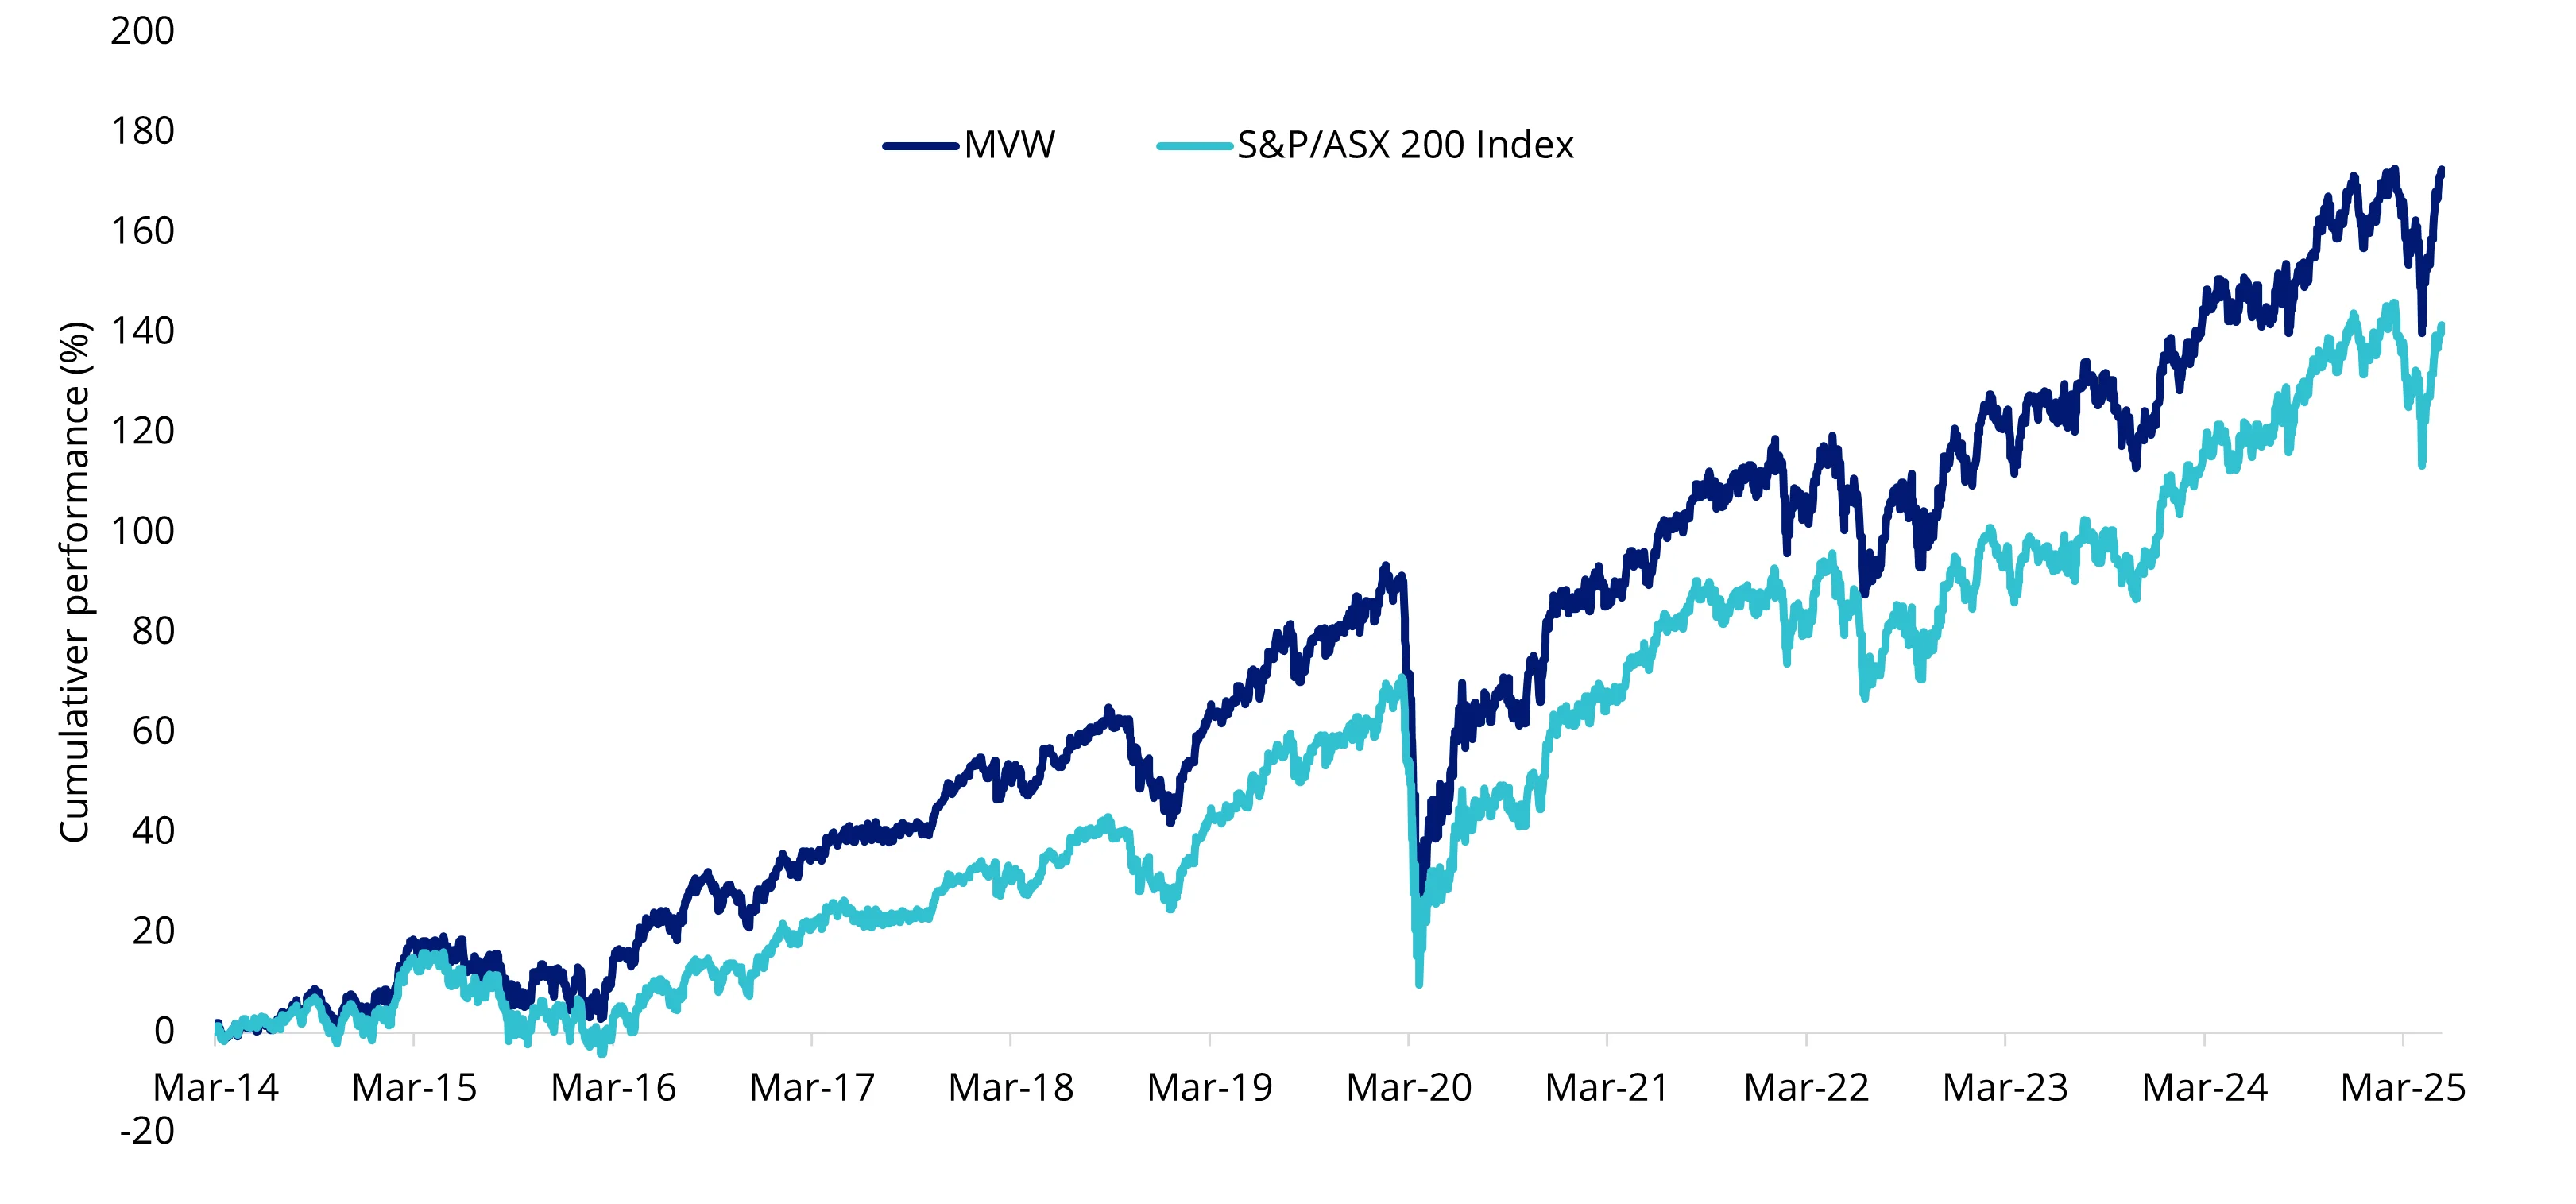
Table 1: Trailing performance to 16 May 2025
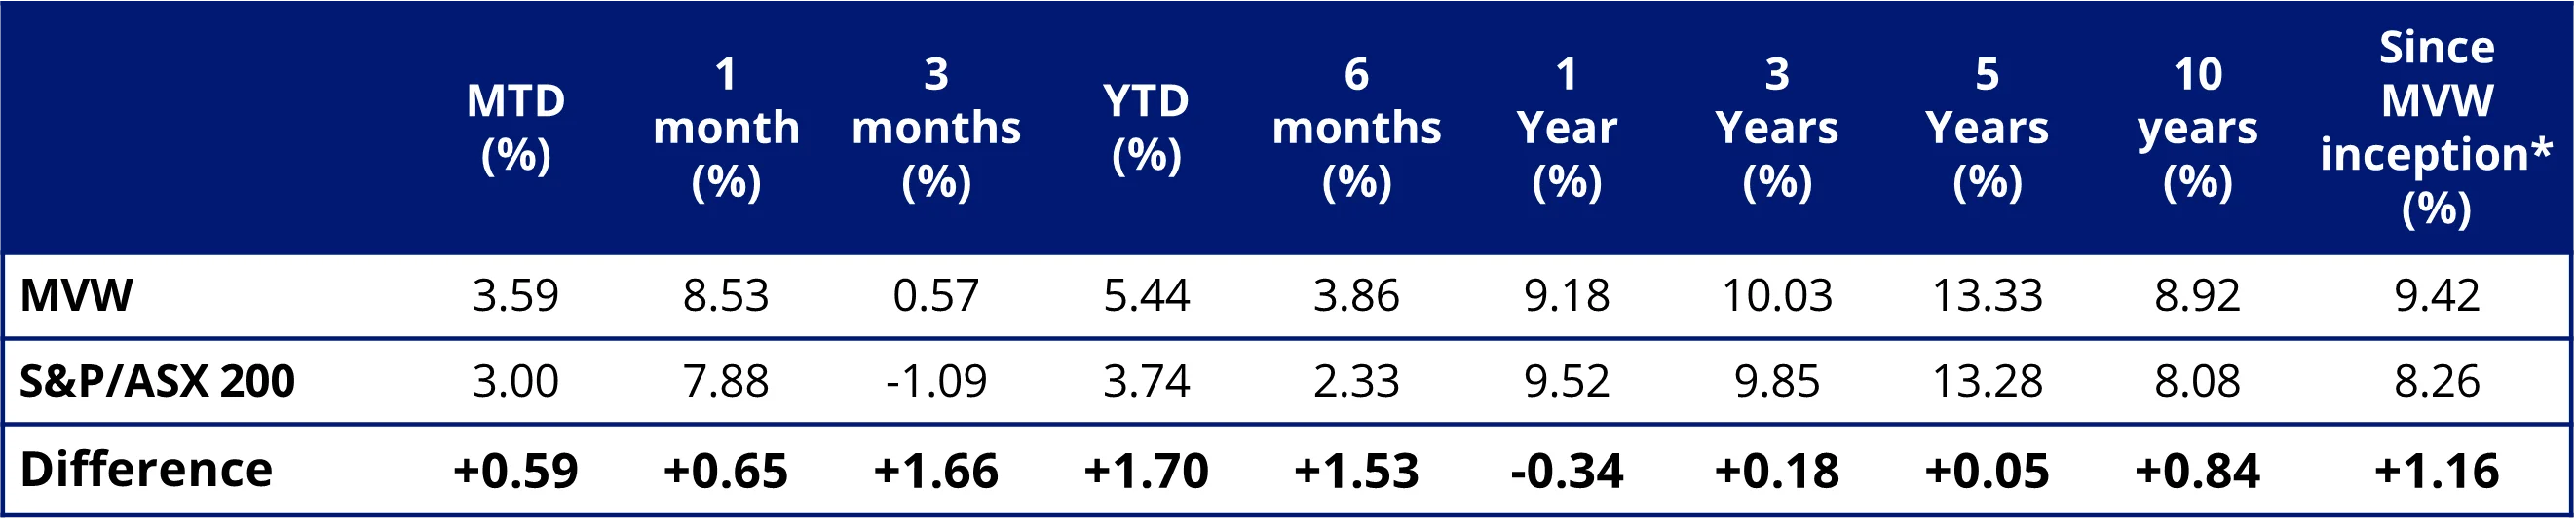
* MVW Inception date is 4 March 2014 a copy of the factsheet is here.
Chart 1 and Table 1 source: Morningstar Direct, VanEck. The chart and table above show past performance of MVW and of the S&P/ASX 200. You cannot invest directly in an index. Results are calculated to the last business day of the month and assume immediate reinvestment of distributions. MVW results are net of management fees and other costs incurred in the fund, but before brokerage fees and bid/ask spreads incurred when investors buy/sell on the ASX. Returns for periods longer than one year are annualised. Past performance is not a reliable indicator of future performance. The S&P/ASX 200 Index is shown for comparison purposes as it is the widely recognised benchmark used to measure the performance of the broad Australian equities market. It includes the 200 largest ASX-listed companies, weighted by market capitalisation. MVW’s index measures the performance of the largest and most liquid ASX-listed companies, weighted equally at rebalance. MVW’s index has fewer companies and different industry allocations than the S&P/ASX 200. Click here for more details.
MVW vs S&P/ASX 200 Index - Top 10 holdings
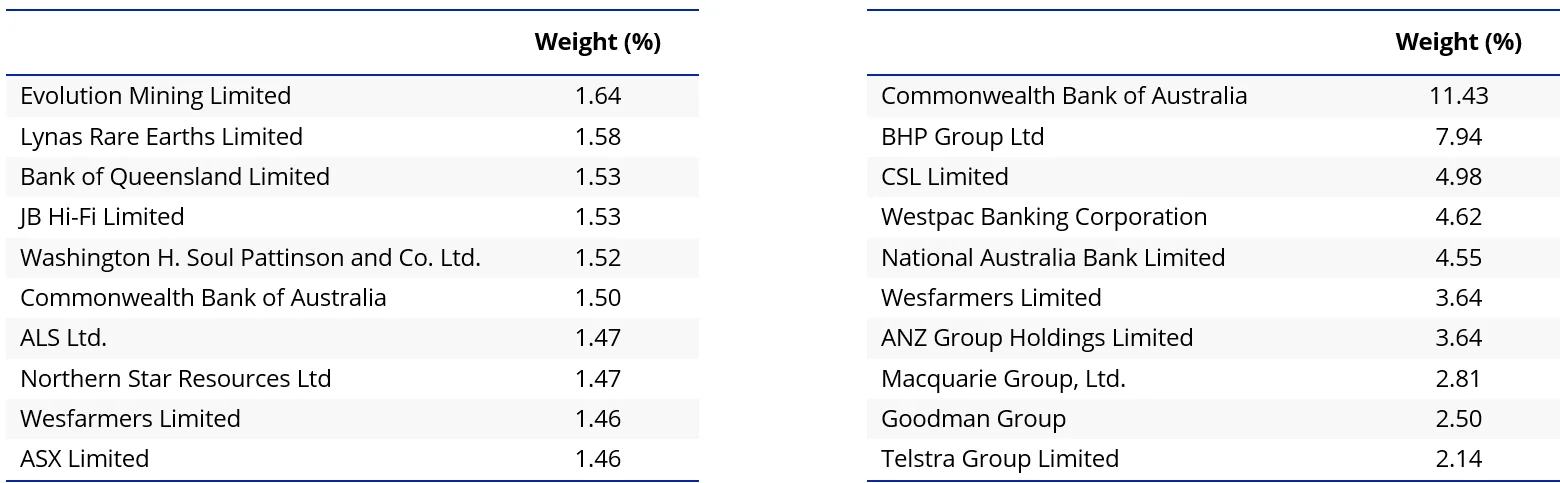
Below you can see the top 10 companies. The differences are stark – to see all the holdings in MVW and their weightings, click here. In the S&P/ASX 200 48.25% of the portfolio is represented by the top 10. In other words, 190 other companies are squeezed into the remaining 51.75% of the portfolio.
Table 2 & 3: Top 10 holdings of MVW and S&P/ASX 200
Source: FactSet, VanEck, S&P, as at 30 April 2025.
The reason MVW’s holdings are not equal above is that it only rebalances back to equal weight each quarter.
MVW vs S&P/ASX 200 Index - Sectors
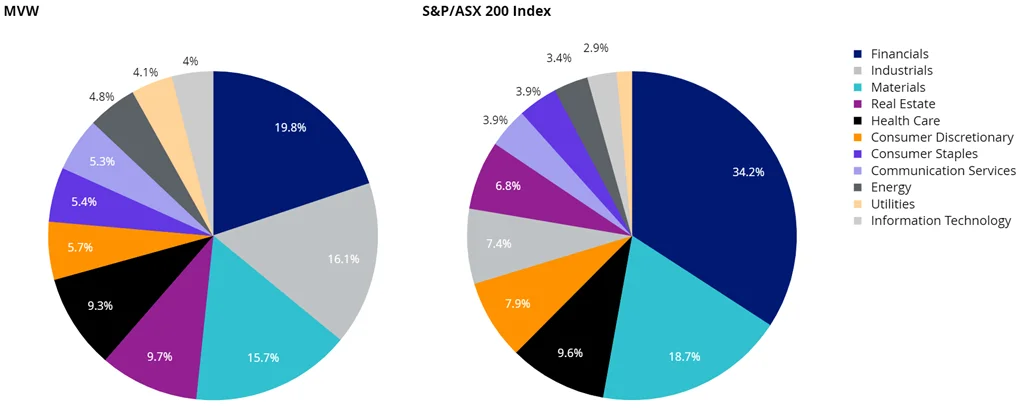
MVW is currently underweight the financials’ sector by 14.4% compared to the S&P/ASX 200 and underweight materials (-3.0%). Conversely, it is overweight industrials by 8.7%, real estate by 2.9% and utilities by 2.6%.
Chart 2: MVW and S&P/ASX 200 sector weightings
Source: FactSet, 30 April 2025.
What this means is that if there is another systemic banking issue, or pressure on commodities, the impact on the S&P/ASX 200 is greater than on MVW.
MVW vs S&P/ASX 200 - Diversification
A way to measure diversification of a portfolio is to calculate its Herfindahl Index. This index is a broadly used technique to quantify concentration. When used inversely, this index measures diversification. As at the last rebalance in March 2025, the Herfindahl Index for the S&P/ASX 200 was 334. The equivalent measure for the index MVW tracks was 135. The S&P/ASX 200 Index is therefore around a two and half times as concentrated as the S&P/ASX 200. In other words, the MVW Index is almost 2 and a half more diversified than the S&P/ASX 200.
MVW vs S&P/ASX 200 Index - Style
When looking at portfolios it is important to determine what style e.g. value or growth and what size bias a portfolio holds e.g. giant, large, mid or small. Below we can see MVW’s. Importantly MVW holds large companies with a similar value-core orientation relative to the S&P/ASX 200, which skews larger (giant) and more toward value. Importantly, MVW’s holdings are still large, liquid companies.
Chart 3 & 4: MVW and S&P/ASX 200 holdings based style map
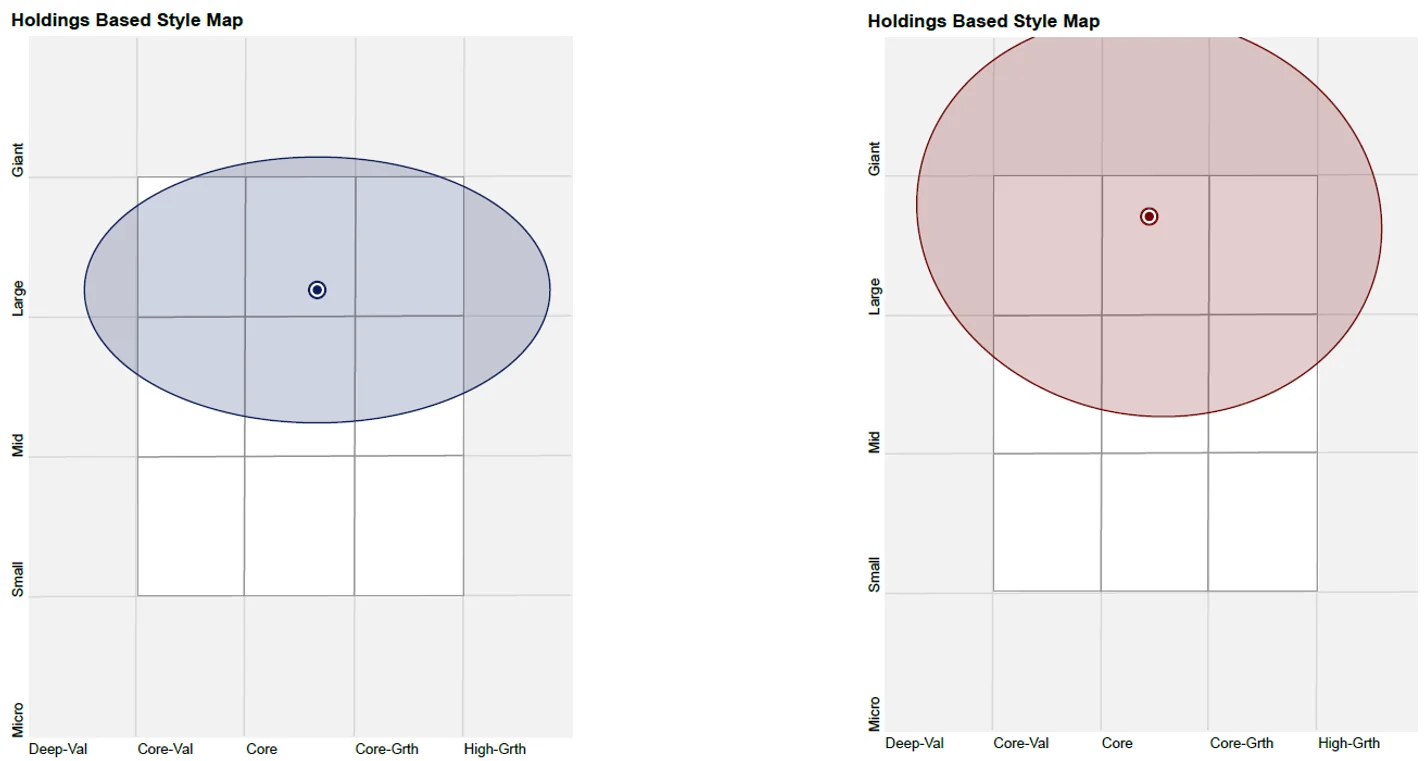
Source: Morningstar Direct, as at 30 April 2025.
While each Australian equity ETF has its merits for portfolio inclusion, you should assess all the risks and consider your investment objectives.
Past performance is no guarantee of future performance. The above is not a recommendation. Please speak to your financial adviser or stockbroker.
For further information you can email us or call on us on +61 2 8038 3300.
Key risks
An investment MVW carries risks associated with: ASX trading time differences, financial markets generally, individual company management, industry sectors, country or sector concentration, political, regulatory and tax risks, fund operations and tracking an index. See the PDS for details.


Published: 16 May 2025
Any views expressed are opinions of the author at the time of writing and is not a recommendation to act.
VanEck Investments Limited (ACN 146 596 116 AFSL 416755) (VanEck) is the issuer and responsible entity of all VanEck exchange traded funds (Funds) trading on the ASX. This information is general in nature and not personal advice, it does not take into account any person’s financial objectives, situation or needs. The product disclosure statement (PDS) and the target market determination (TMD) for all Funds are available at vaneck.com.au. You should consider whether or not an investment in any Fund is appropriate for you. Investments in a Fund involve risks associated with financial markets. These risks vary depending on a Fund’s investment objective. Refer to the applicable PDS and TMD for more details on risks. Investment returns and capital are not guaranteed.
MVIS Australia Equal Weight Index (‘MVIS Index’) is the exclusive property of MV Index Solutions GmbH based in Frankfurt, Germany (‘MVIS’). MVIS is a related entity of VanEck. MVIS makes no representation regarding the advisability of investing in the Fund. MVIS has contracted with Solactive AG to maintain and calculate the MVIS Index. Solactive uses its best efforts to ensure that the MVIS Index is calculated correctly. Irrespective of its obligations towards MVIS, Solactive has no obligation to point out errors in the MVIS Index to third parties.