From solar to success: profits, planet, and possibilities
The AFR recently reported that CBA, Australia’s largest company by market cap, called “abundant, affordable and reliable clean energy” its second biggest priority for national reform1 While somewhat unusual, given it’s a space that CBA doesn’t play in directly (unlike its first biggest priority, “housing”), the bank’s public statement on the matter suggests capital allocators are now moving to pick up the slack in the climate action space. This is a timely move, with Australia bidding to host COP31 in 2026, attracting international scrutiny on our country’s own emission reduction initiatives.
Globally, the race to harness clean energy continues. Notwithstanding recent challenges such as rate hikes and energy policy swings in the last few years, and most recently President Trump’s tariff turbulence in April, the sector’s downtrend may have passed its trough, and we think the investment opportunity could be ripe for the picking.
Chart 1: The global clean energy sector has outperformed the market in 2025
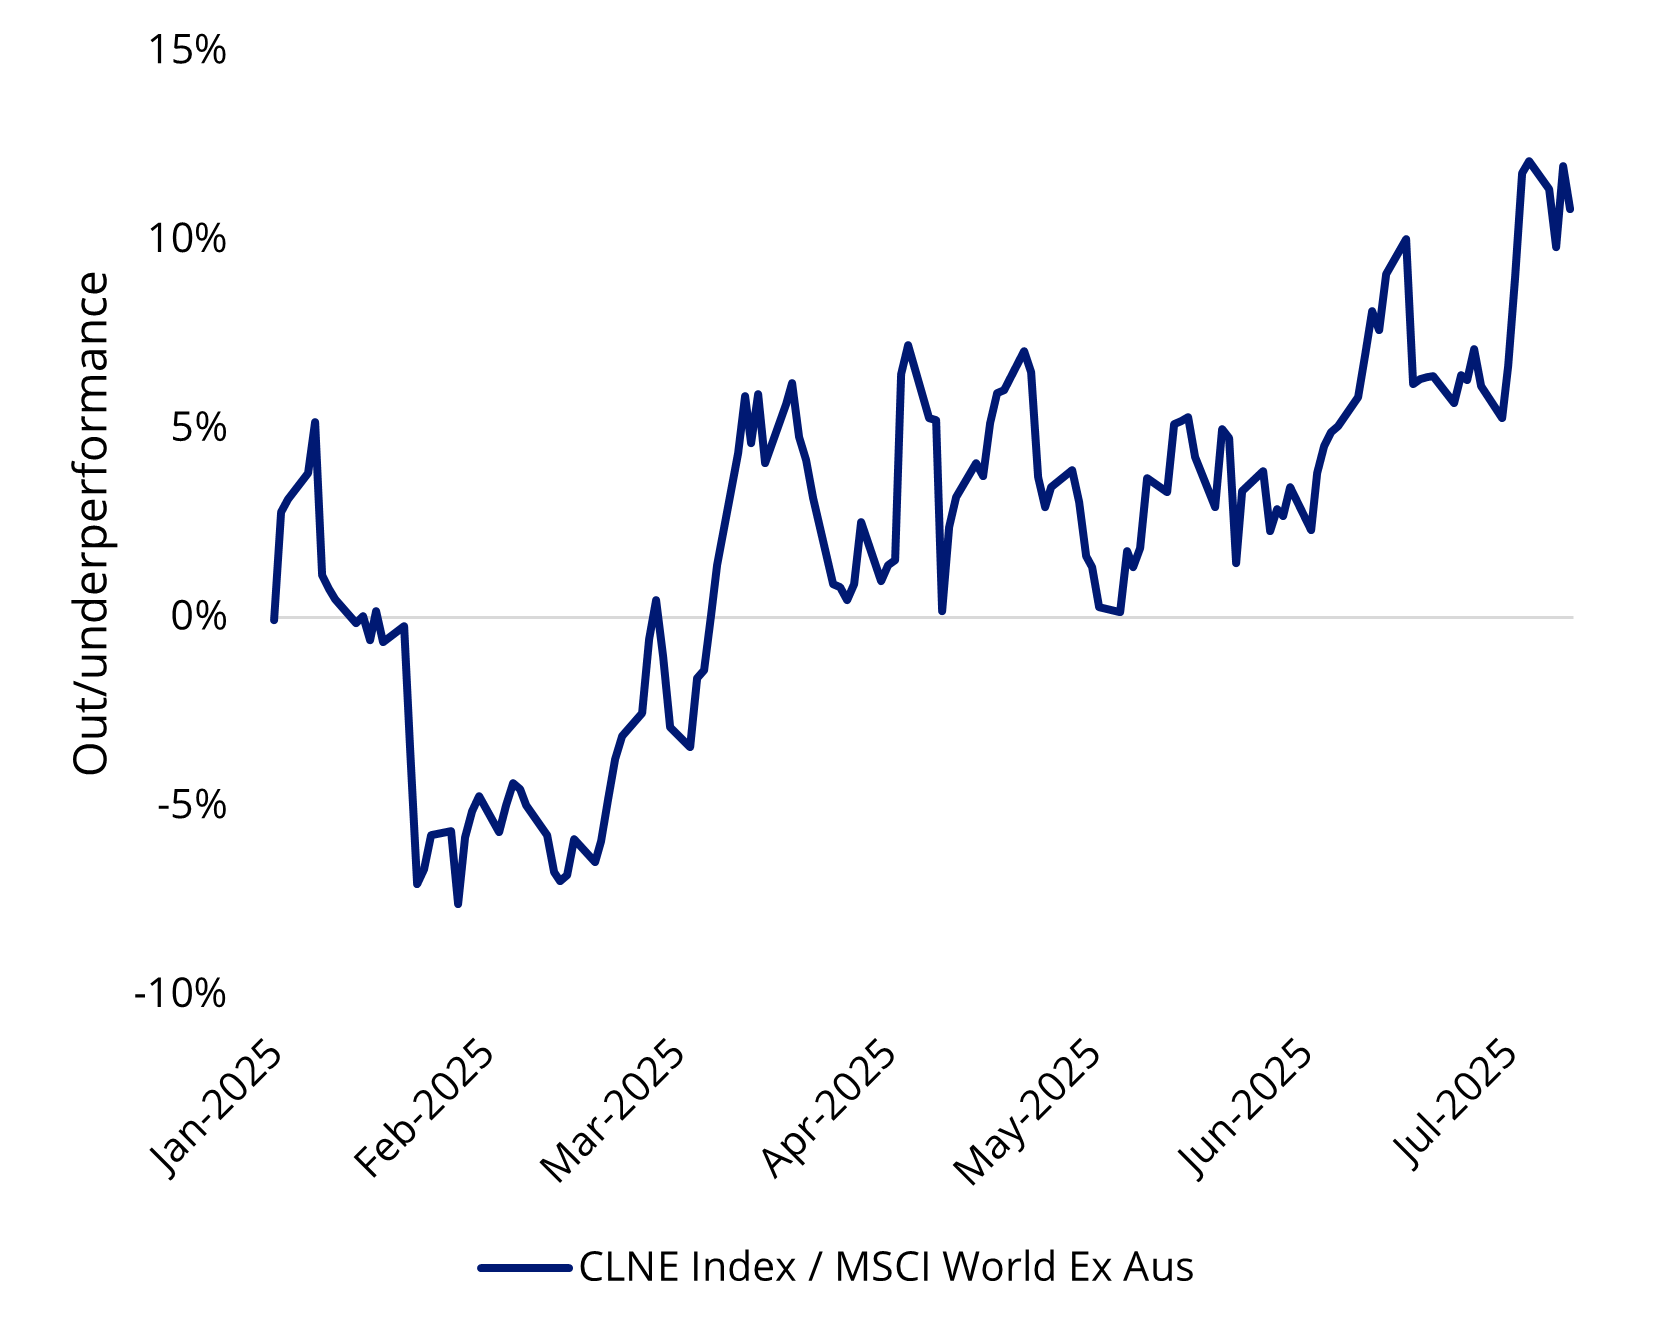
Source: Bloomberg as at 10 July 2025. You cannot invest in an index. Past performance is not indicative of future performance.
While Trump’s “drill, baby, drill” rhetoric reignited oil and gas production as well as investment into the brown sector. However, this could be offset by the ever-increasing demand for clean electricity to feed the vastly expanding data centres across the country. Contrary to popular opinion of the US being anti-clean energy, the country’s investment into renewables was two percentage points higher than that of fossil fuels as at the end of 2024, according to IEA’s World Energy Investment 2025 report.
Chart 2: US investment into clean energy and fossil fuels as a share of global energy investments
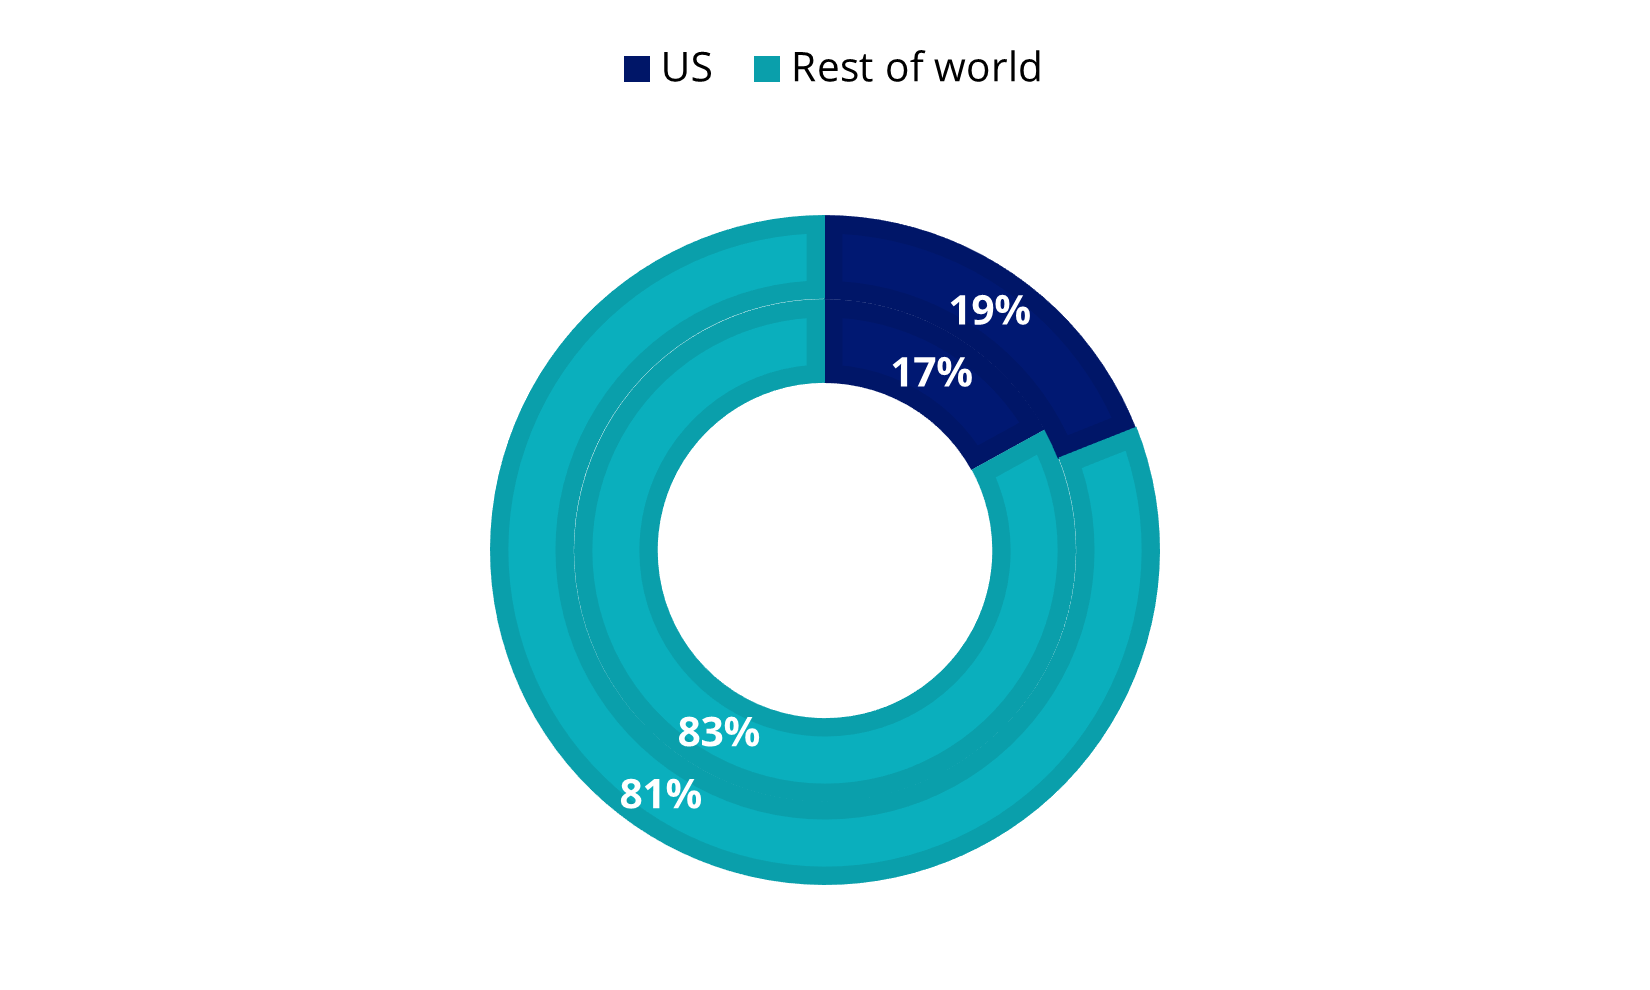
Source: IEA. As at the end of 2024.
The US solar sector has been the biggest beneficiary of this renewables funding , with the largest sum of money going into the sector since 2021. This coincides with its dominance in generating new capacity to the grid. Based on the statistics from SEIA, solar represented over 69% of new capacity in Q1 of 2025, its highest quarter ever. The solar industry’s competitive landscape has seen it expand its share of total US electricity generation from just 0.1% in 2010 to over 7% this year.
While the tax incentives for solar investment could potentially be in the coming years, we think the US’ goal to achieve domestic competitiveness bodes well for the sector over the long term.
Chart 3: Actual energy and industry investment by technology
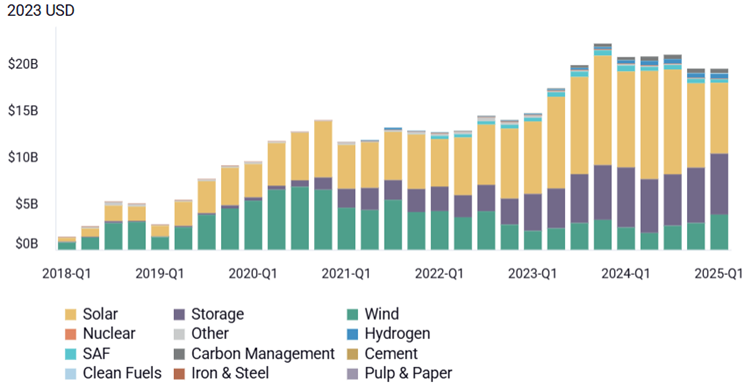
Source: Clean Investment Monitor as at end of March 2025.
Based on Bloomberg estimates, global renewables are attractively ranked in the top 3 sectors in terms of both EPS and revenue growth for the next 12 months.
Chart 4: Global renewables forecast
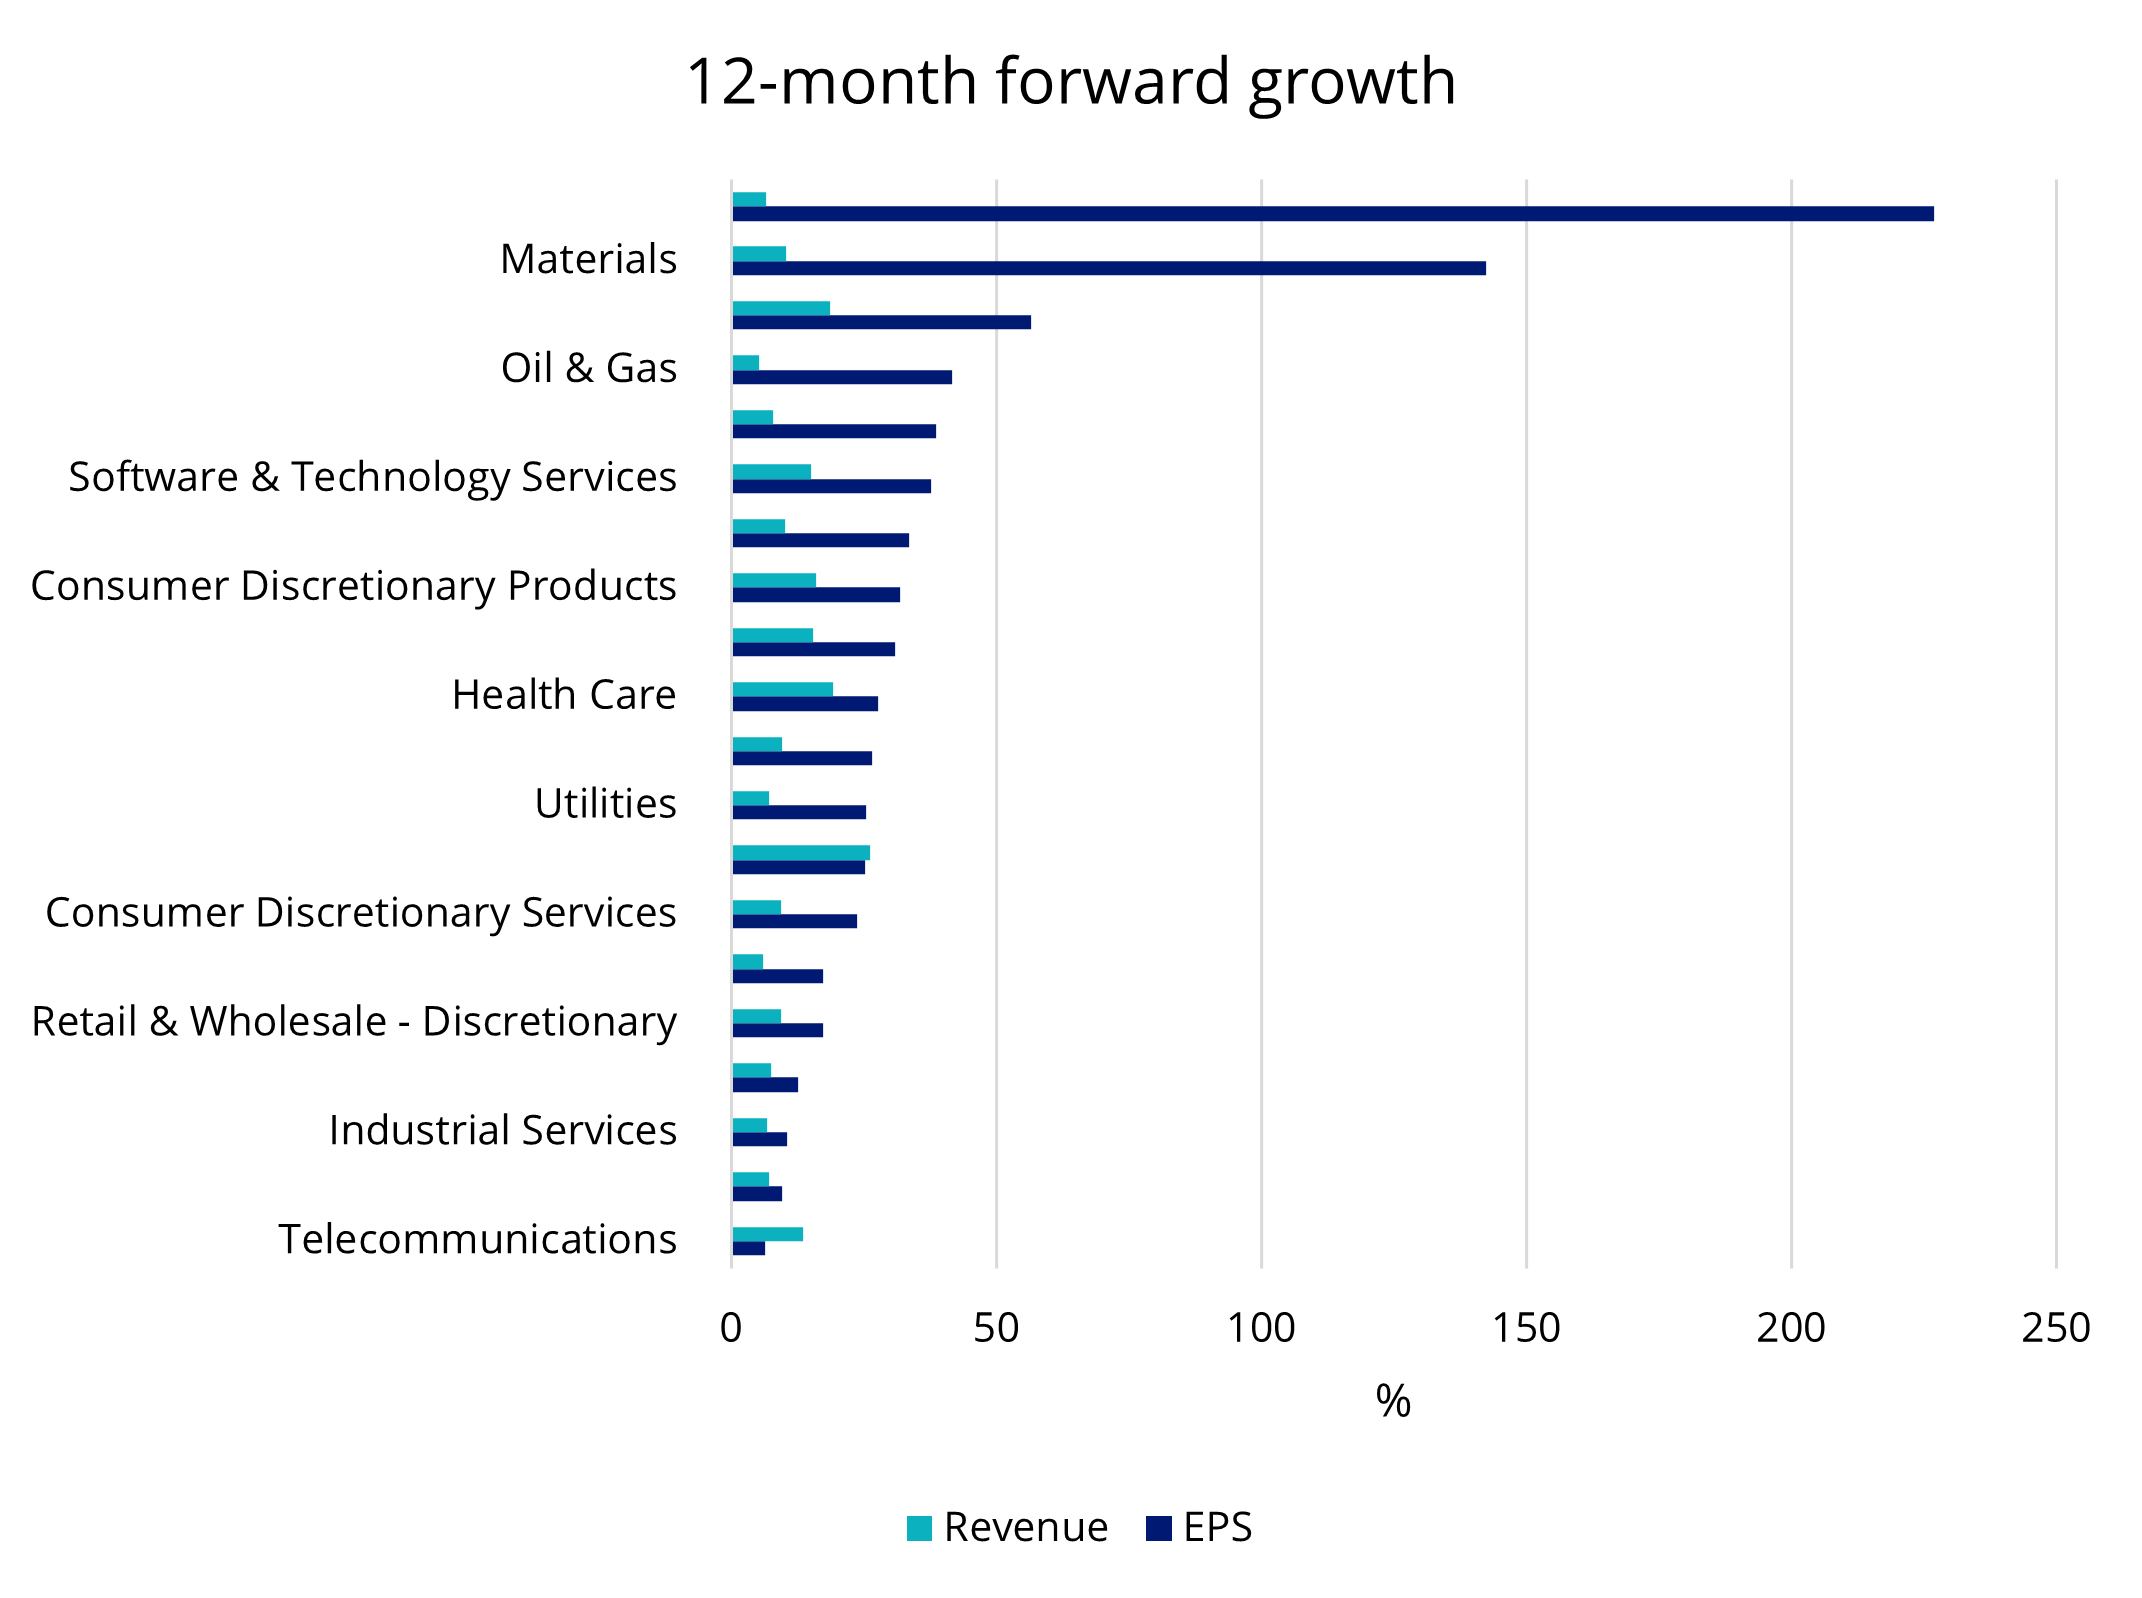
Source: Bloomberg as at 15 July 2025.
Global clean energy stocks, as represented by the S&P Global Clean Energy Select Index (“CLNE index”), have been trading at a discount relative to the broader market, presenting a compelling opportunity for long term investors.
Chart 5: Clean energy on sale
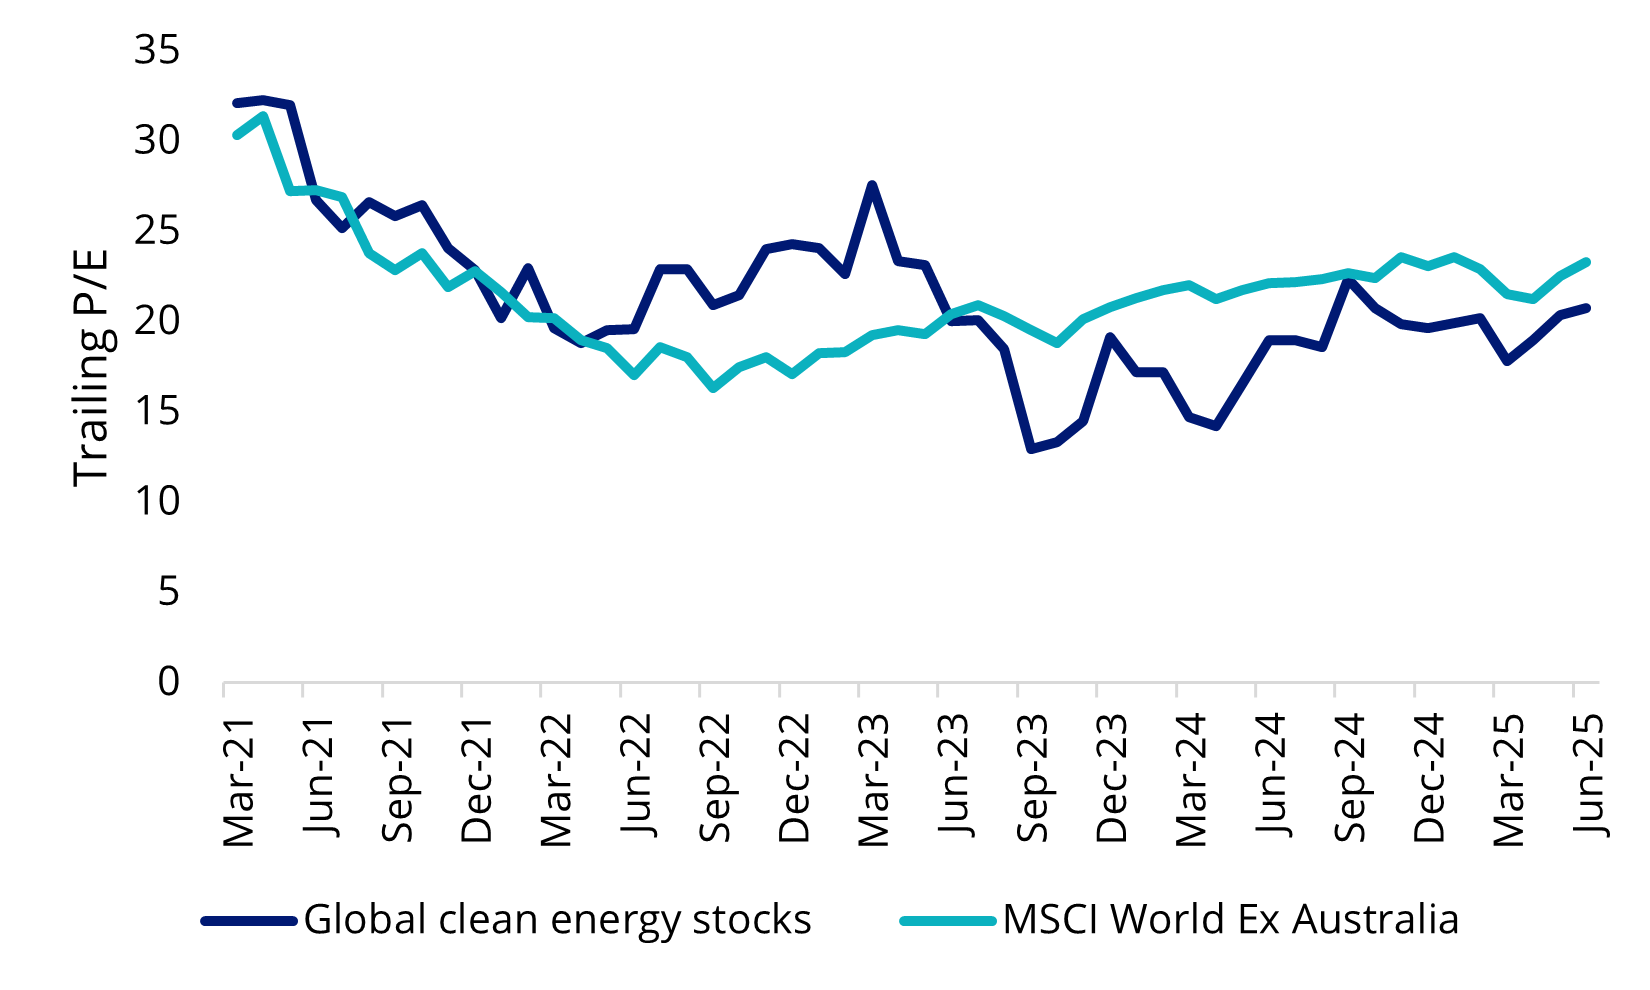
Source: FactSet, MSCI as at 30 June 2025. Global clean energy stocks represented by S&P Global Clean Energy Select Index. You cannot invest in an index. Past performance is not indicative of future performance.
Accessing global clean energy companies
The US policy uncertainty and macroeconomic conditions highlight the importance of geographical and sector diversification.
The VanEck Global Clean Energy ETF (ASX: CLNE) includes global companies at the forefront of renewables technology, allowing investors to participate in this structural, long-term trend in one easy trade.
It has diversified exposure to 30 of the largest and most liquid companies involved in clean energy production across:
- biofuel & biomass energy production, technology & equipment;
- ethanol & fuel alcohol production;
- fuel cells technology & equipment;
- geothermal energy production;
- hydro electricity production, turbines & other equipment;
- solar energy production, photo voltaic cells & equipment; and
- wind energy production, turbines & other equipment.
Further information about CLNE and the screening criteria employed by its index can be found on our website.
Key risks: An investment in our clean energy ETF carries risks associated with: ASX trading time differences, financial markets generally, individual company management, industry sectors, foreign currency, emerging markets, country or sector concentration, political, regulatory and tax risks, fund operations, liquidity and tracking an index. See the VanEck Global Clean Energy ETF PDS and TMD for more details.
Source
1https://www.afr.com/chanticleer/plenty-won-t-like-matt-comyn-s-big-fix-for-australia-that-s-ok-20250714-p5meso
Published: 24 July 2025
Any views expressed are opinions of the author at the time of writing and is not a recommendation to act.
VanEck Investments Limited (ACN 146 596 116 AFSL 416755) (VanEck) is the issuer and responsible entity of all VanEck exchange traded funds (Funds) trading on the ASX. This information is general in nature and not personal advice, it does not take into account any person’s financial objectives, situation or needs. The product disclosure statement (PDS) and the target market determination (TMD) for all Funds are available at vaneck.com.au. You should consider whether or not an investment in any Fund is appropriate for you. Investments in a Fund involve risks associated with financial markets. These risks vary depending on a Fund’s investment objective. Refer to the applicable PDS and TMD for more details on risks. Investment returns and capital are not guaranteed.