The unexpected asset classes set to dominate the next cycle
Emerging market equities and bonds have had a stellar 2025 so far. We think this may continue.
VanEck’s latest portfolio compass dissects our macroeconomic and market views on emerging market equities and bonds, which had outperformed developed markets so far in 2025, primarily due to a weakening US dollar.
Macroeconomic tailwinds:
1. Dollar devaluation cycle bullish for emerging markets assets
The US Dollar has weakened due to US economic policy instability and rising US government debt. A lower US dollar typically boosts emerging markets' exports, which could lead to a rebound in earnings per share (EPS) growth in the coming quarters. Historically, this is typically when emerging markets equities have outperformed developed market equities.
Charts 1 & 2 Global FX Reserves US dollar share % & Emerging Markets relative performance versus US Dollar Index (DXY)
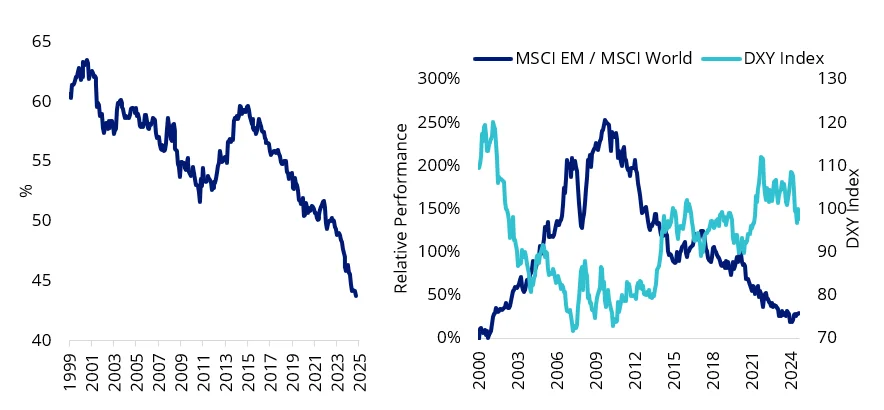
Source: VanEck, Bloomberg. CPB, IBES/DataStream, MSCI, NBER. Data as at 30 September 2025.
Chart 3: Emerging markets exports and EPS forecast
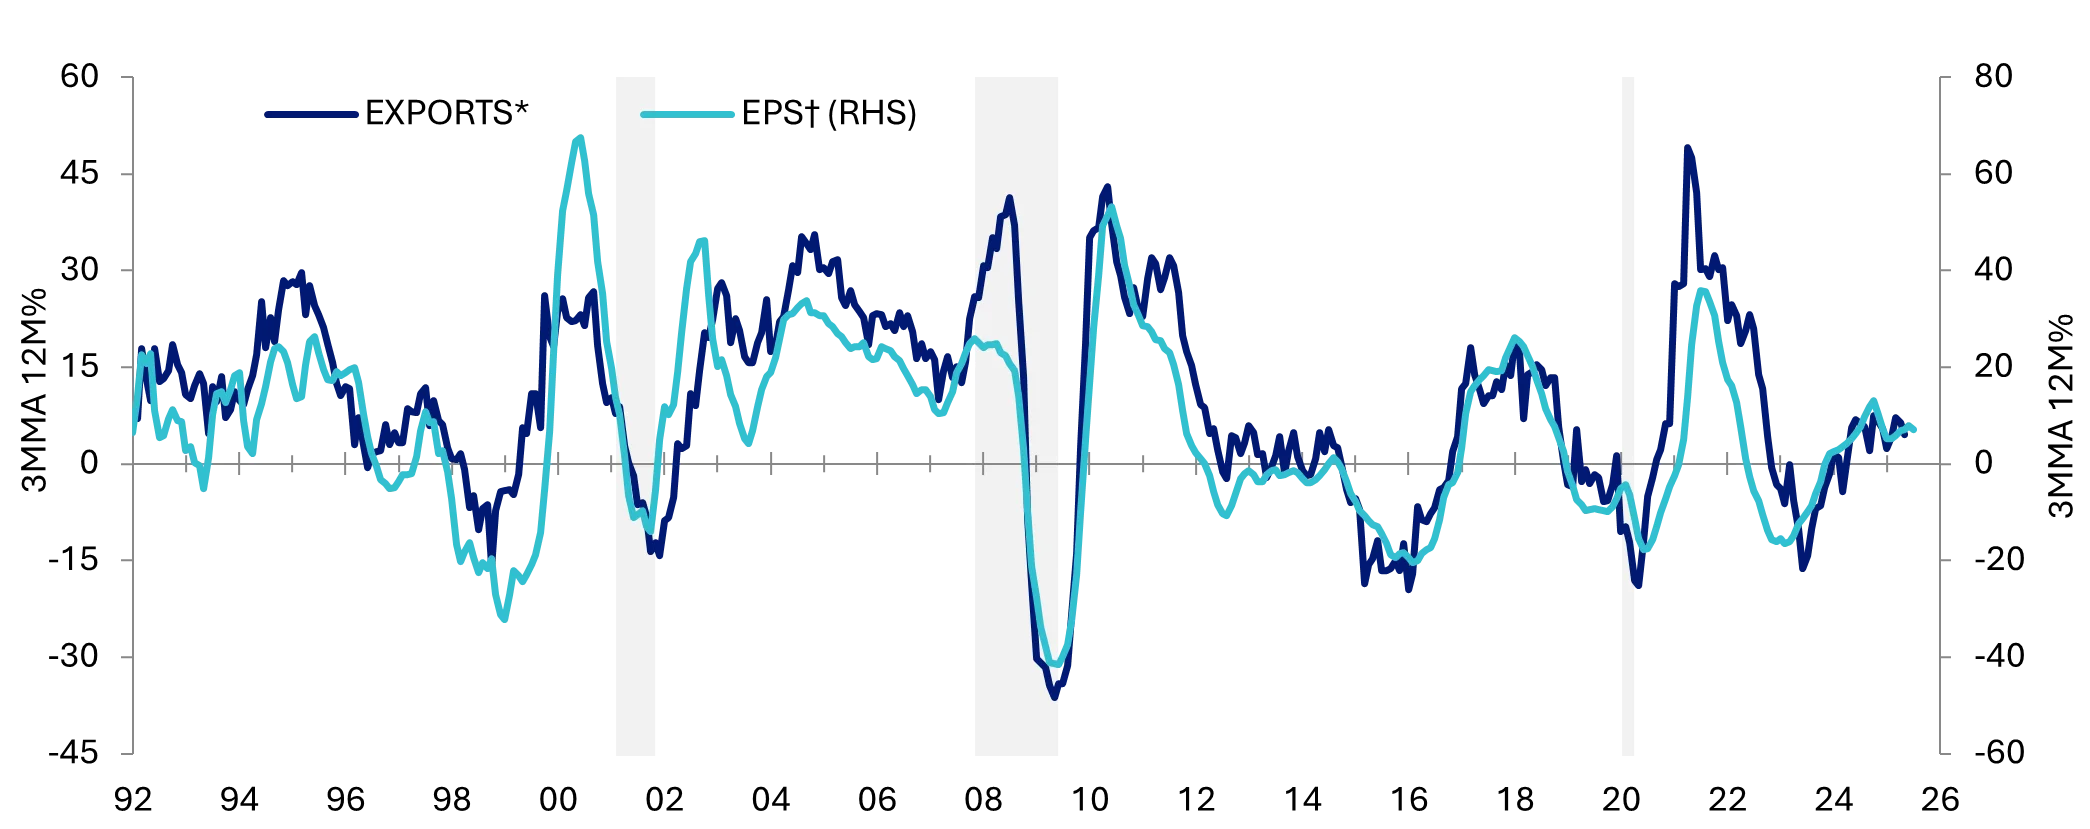
Source: VanEck, Bloomberg. CPB, IBES/DataStream, MSCI, NBER. Date as of 30 September 2025.
2. Deeper emerging markets easing cycle positive for equities and bonds
Chart 4: Global central bank policy rates
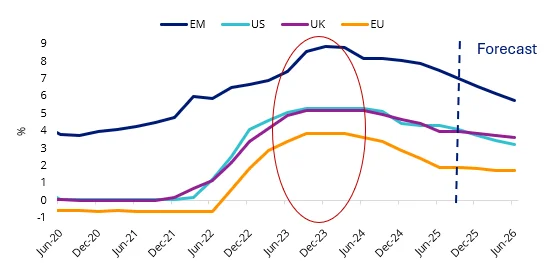
Source: VanEck Australia, Bloomberg. EM refers to Bloomberg Economics’ policy rate estimate for Emerging Markets. US is the Effective Federal Funds Rate. UK is the SONIA Benchmark Interest Rate. EU is the ESTR Volume-Weighted Trimmed Mean Rate. The US forecast is based on futures market pricing, while forecasts for other regions are based on OIS market pricing.
3. Growth premium remains the key edge
Despite global volatility, emerging market economies continue to grow at nearly double the pace of their developed market peers. This reinforces their role as the world’s growth engine for the coming years, especially amid a consensus of a broader slowdown in developed market economies driven by mounting fiscal pressure and the impact of tariffs.
Chart 5: GDP growth YoY% - Developed markets vs Emerging markets
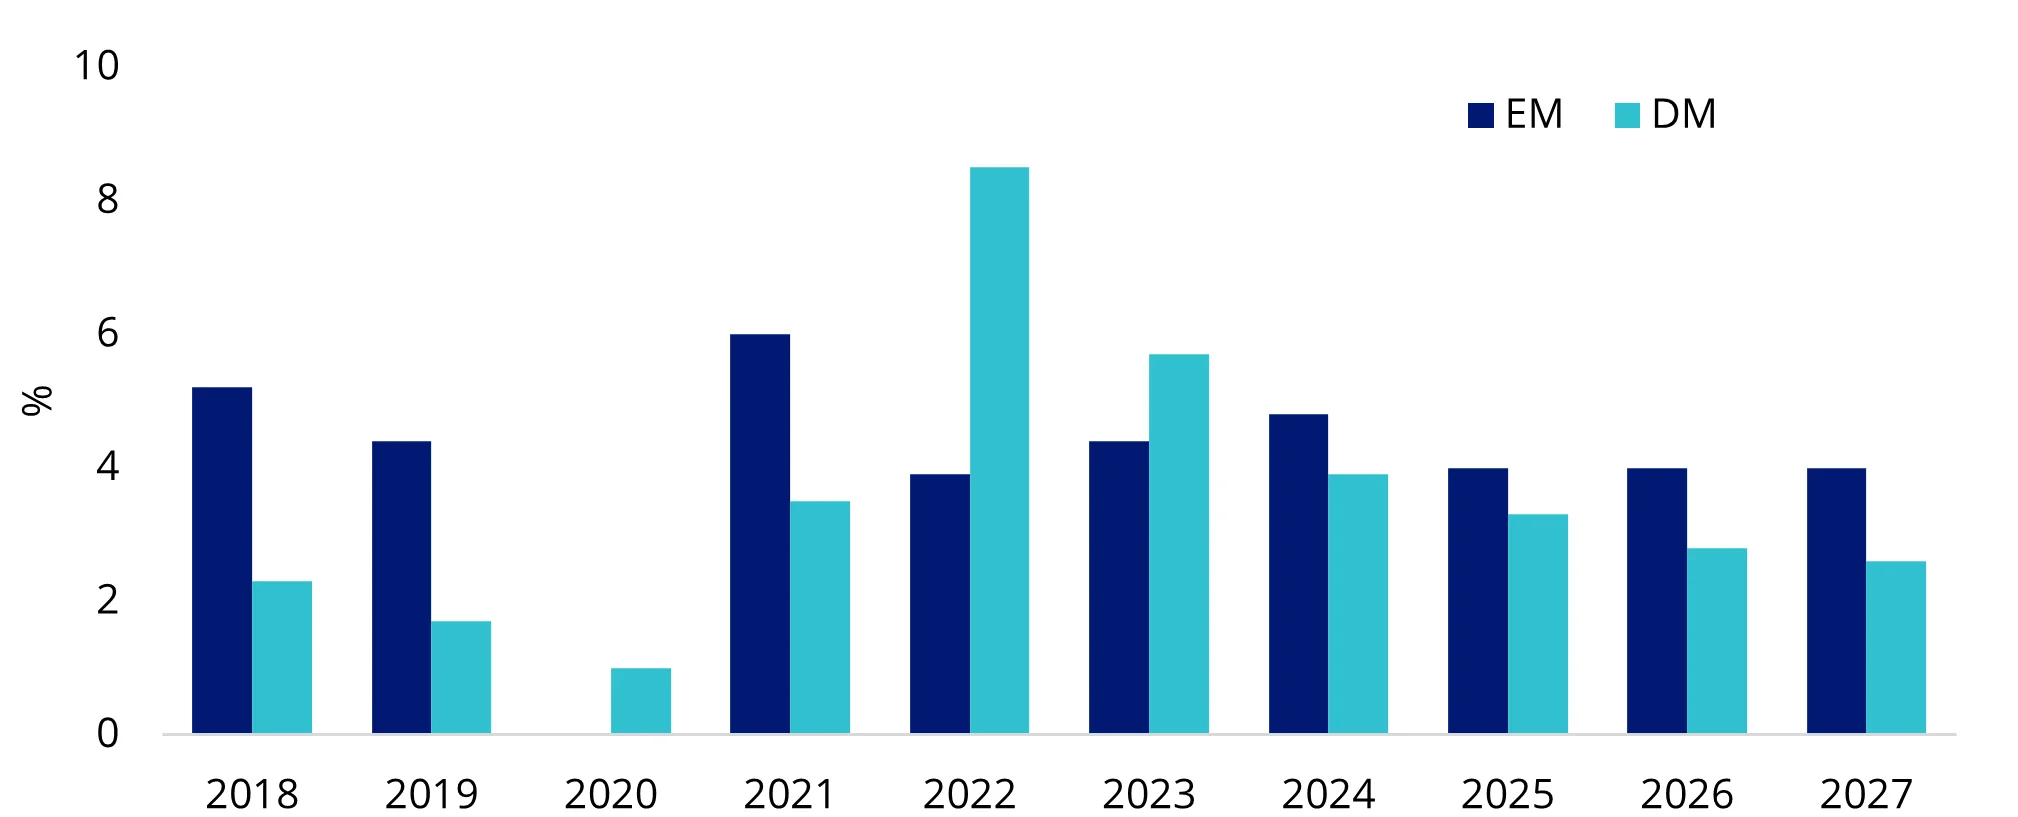
Source: VanEck, Bloomberg. Average sell-side forecasts. Data as at 30 September 2025.
On a corporate level, over the past decade, emerging markets' earnings growth has trailed developed markets, contributing to relative underperformance. However, the forward-looking indicator - 12-month forward earnings forecasts now favour emerging markets, highlighting upside potential for earnings growth. Valuations of emerging market corporates also appear more attractive compared to developed market peers, adding to the appeal of emerging market equities.
Charts 6 & 7: Emerging markets vs developed markets - EPS growth % & Price to 12m forward earnings

Source: VanEck, Bloomberg. Average sell-side forecasts. EM is the MSCI EM Index. DM is the MSCI World Index. Data as at 30 September 2025. This is not a recommendation to act.
Key market views:
The portfolio compass highlights these views on major emerging market economies:
- India’s strong GDP and earnings growth, coupled with easing policy and renewed foreign inflows, reinforce its appeal as a key emerging market outperformer.
- China’s equity market offers attractive valuations and selective sector upside, with sentiment stabilising as growth targets are met and US-China relations improve.
- South Korea, benefiting from optimism in Asia tech and defence, we think could also see further upside.
- Brazil stands out as a deep value play with cyclical upside, offering attractive valuations and potential tailwinds from a weaker US dollar.
The benefit of a multi-factor investment approach in emerging market equities
As we’ve highlighted, there are several structural tailwinds for investing in emerging market equities. The challenge is that at an emerging market country level, economic cycles are fragmented, which makes it difficult to time and implement single-factor investment strategies. In other words, for example, investors typically invest in quality Indian companies for their defensive characteristics, yet because India has been consistently in an expansionary environment, it works against effectively harvesting the quality factor. The charts below show changes in manufacturing activity since 2020 at a country level for emerging markets and developed markets.
However, a multi-factor investment approach which includes companies on the basis of value, momentum, quality and low size factors has historically outperformed the benchmark, MSCI Emerging markets Index over the medium and long term.
Charts 8 & 9: Manufacturing PMI dispersion – EM and DM
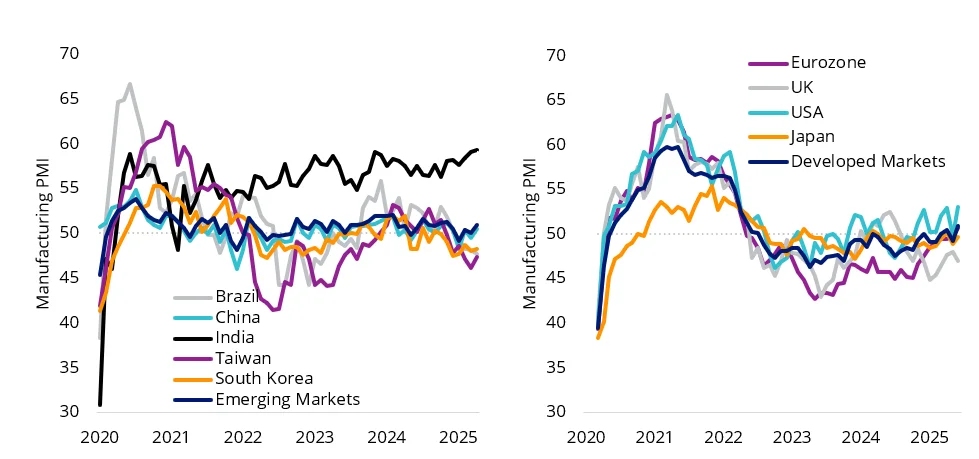
Source: VanEck. Bloomberg. Manufacturing PMI. Due to data availability, data is till 31 August 2025.
Access to emerging markets
The VanEck MSCI Multifactor Emerging Markets Equity ETF (ASX: EMKT) tracks the MSCI Emerging Markets Multi-Factor Select Index (AUD) (EMKT Index), and it includes companies on the basis of four factors: Value, Momentum, Low Size and Quality.
The four factors combined have demonstrated long term outperformance relative to the MSCI Emerging Markets Index. EMKT has outperformed since it launched on ASX in 2018. EMKT’s performance is available here. As always noting, past performance is not indicative of future performance.
For more focused exposure to China and India, we offer below strategies for investors’ consideration.
- China New Economy ETF (CNEW):Invests in 120 fundamentally sound and attractively valued companies with growth prospects in China's New Economy, targeting technology, healthcare, and consumer staples and consumer discretionary sectors.
- FTSE China A50 ETF (CETF):Invests in a diversified portfolio comprising the 50 largest companies in the mainland (A-shares) Chinese market which currently includes the likes of EV car manufacturer BYD.
- VanEck India Growth Leaders ETF (GRIN): offers exposure to the top 50 most fundamentally sound Indian companies exhibiting attractive growth at a reasonable price (GARP) characteristics.
Key risks:
An investment in EMKT, CNEW, CETF and GRIN carries risks associated with: ASX trading time differences, emerging markets, China (CETF and CNEW), India (GRIN), financial markets generally, individual company management, industry sectors, foreign currency, sector concentration, political, regulatory and tax risks, fund operations, liquidity and tracking an index. See the relevant PDS and TMD for more details.


Published: 02 October 2025
Any views expressed are opinions of the author at the time of writing and is not a recommendation to act.
VanEck Investments Limited (ACN 146 596 116 AFSL 416755) (VanEck) is the issuer and responsible entity of all VanEck exchange traded funds (Funds) trading on the ASX. This information is general in nature and not personal advice, it does not take into account any person’s financial objectives, situation or needs. The product disclosure statement (PDS) and the target market determination (TMD) for all Funds are available at vaneck.com.au. You should consider whether or not an investment in any Fund is appropriate for you. Investments in a Fund involve risks associated with financial markets. These risks vary depending on a Fund’s investment objective. Refer to the applicable PDS and TMD for more details on risks. Investment returns and capital are not guaranteed.