A closer look at active share
We recently wrote that despite the fees they charge Australian investors, some active Australian fund managers aren’t very active at all in terms of managing their portfolios, rather they are hugging their benchmarks. Some managers and researchers argue there is no correlation between high active share and high outperformance. In this Vector Insights, we test that argument.
As we wrote in a recent Vector Insights, Time to come clean, active share is a measure of the amount by which a fund manager's portfolio differs from the benchmark index.
For a quick refresh: active share is calculated by taking the sum of the absolute differences between the weight of each holding in the manager's portfolio, and the weight of that holding in the benchmark index, and dividing by two.
![]()
A fund with no holdings in common with the benchmark would have 100% active share, while a portfolio that is identical to the benchmark would have 0% active share.
The history of active share
Active share was first identified by Martijn Cremers and Antti Petajisto of the Yale School of Management in their 2009 paper, How Active Is Your Fund Manager? A New Measure That Predicts Performance1. They suggested that funds with an active share below 60% should be avoided because they are "closet indexers" that charge high fees for providing index-like returns. They concluded this because their research identified a link between higher active share and outperformance.
Active share and outperformance
According to Cremers and Patajisto, based on their research of US mutual funds' performance from 1980 to 2003, "the funds with the highest Active Share significantly outperformed their benchmark indexes".2
This study was important because, up until then, the degree of a portfolio's active management was only measured by tracking error, or the standard deviation of a portfolio's excess returns relative to a benchmark.
In 2010, Petajisto published a follow-up paper, which found that the most active stock pickers outperformed their benchmark indices after costs over the 2008 to 2009 financial crisis. Moreover, he found that closet indexing increases in volatile and bear markets and has become more popular after 2007.3
Following both research pieces, active share has been recognised by some in the investment industry as a possible indicator of an actively managed fund's potential for future outperformance.
"The concept of active share is intuitive and practical, which may help explain its wide acceptance," writes an active fund manager, Lazard Asset Management.4
"Simple, intuitive, and persistent over time, active share introduces another dimension in the evaluation of active management previously not captured by the traditional, historical returns-based measure—tracking error," writes Lazard in their paper, Taking a Closer Look at Active Share.
However, some fund managers and researchers dispute the efficacy of the active share measure. "'Active share' is a measure of a portfolio's differentiation from a benchmark index; it does not serve as a proxy for excess return or manager skill," writes Fidelity in a research paper, Active Share: A Misunderstood Measure in Manager Selection.5
"Active share may vary structurally according to market-cap mandate and benchmark, making comparisons across categories tricky. Investors who focus solely on the potential for excess return implied by active share may neglect considerations of the risks involved, including additional exposure to volatility and tail risk, particularly when higher active share is achieved by a manager with less skill," says Fidelity.
Researcher Morningstar too conducted analysis and didn't find a high correlation between high active share and outperformance saying "A high active share doesn't necessarily lead to outperformance, nor does a modest active share preclude it."
Active share does help identify long-term outperformers
We decided to put the data to the test. We examined the active share and the returns of 25 of the largest Australian broad-based equity funds in the Morningstar universe and our own broad based Australian Equity ETF, VanEck Vectors Australian Equal Weight ETF (MVW).
VanEck's own analysis of the Morningstar data did not find a correlation between active share measures and performance over a three-year period to 31 January 2019. More than half underperformed. That is, 14 fell short of the benchmark return. Of those, 10 had an active share over 50. So, some of the most active fund managers underperformed - and by the greatest amounts.
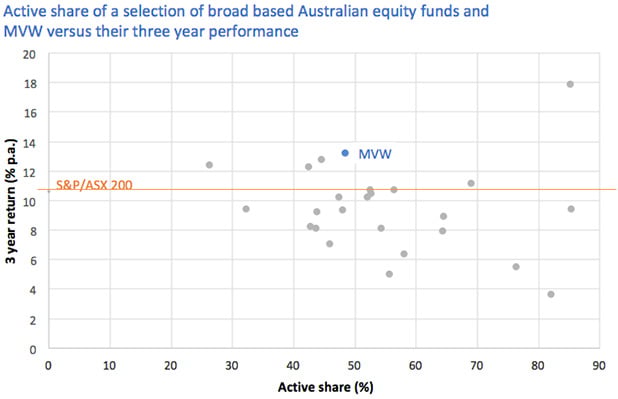
Source: Morningstar. Active share is averaged over the three years to 31 January 2019 based on quarter end holdings compared to the S&P/ASX 200. Returns are calculated daily and assume immediate reinvestments of dividends. Returns are net of management fees and other costs incurred in the funds but do not include brokerage costs or buy/sell spreads incurred when investing. Past performance is not a reliable indicator of future performance.
However, over 10 years, VanEck's analysis found a correlation between higher active share measures and outperformance, as indicated by the graph below. Over 10 years we use the performance of MVW's Index, the MVIS Australia Equal Weight Index instead of MVW as MVW does not have 10 years of performance. Additionally two of the funds in the 3 year comparison also did not have 10 years of performance history so only 23 are included in the 10 year comparison.
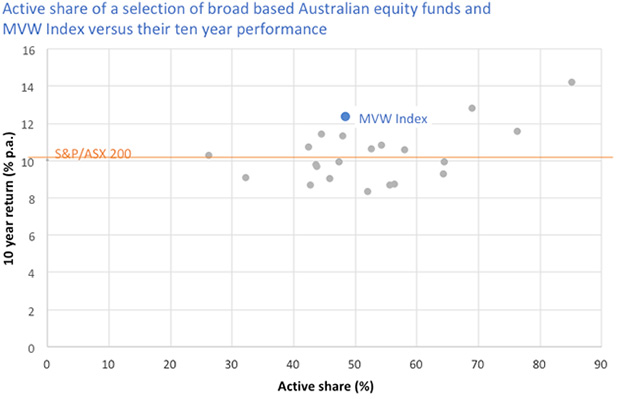
Source: Morningstar. Active share is averaged over the ten years to 31 January 2019 based on quarter end holdings compared to the S&P/ASX 200. Returns are calculated daily and assume immediate reinvestments of dividends.MVW Index performance prior to its launch on 29 November 2013 is simulated based on the current index methodology. You cannot invest in an index. Performance is calculated daily and assumes immediate reinvestment of all dividends. MVW Index returns do not include fees and costs of investing. Fund returns are net of management fees and other costs incurred in the fund but do not include brokerage costs or buy/sell spreads incurred when investing. Past performance is not a reliable indicator of future performance.
The funds with the highest active share measures also delivered the best returns. Of the actively managed funds that underperformed, eight had active shares of less than 50. In contrast, of the 12 managers that outperformed, seven had active shares of more than 50, 10 above 45.
Ask whether the fee your active manager charges is justified
The active share measure can help investors distinguish between managers who are truly active, and therefore may have a better chance of outperforming over the long run, and those who simply hold portfolios very similar to the benchmarks they seek to outperform.
If your manager is simply hugging the benchmark and is charging fees higher than index funds, you could be paying for a service that you aren't receiving.
Our analysis suggests that over the long term, active managers in Australia with higher active share measures than 45 have historically outperformed over the long run. The VanEck Vectors Australian Equal Weight ETF (MVW) with almost five years since its inception, meets this criterion. A copy of the factsheet is available here. This smart beta ETF has had an average active share of 48.40 over this period, but unlike most active funds with a similar active share, it only charges management costs of 0.35% p.a. Furthermore, the index MVW tracks demonstrates a long term history of outperformance, as the chart above displays.
IMPORTANT NOTICE:
For use by financial services professionals only. This information is issued by VanEck Investments Limited ABN 22 146 596 116 AFSL 416755 ('VanEck') as responsible entity of the VanEck Vectors Australian Equal Weight ETF (MVW) ('Fund'). This is general advice only about financial products and not personal advice. It does not take into account any person's individual objectives, financial situation nor needs. Before making an investment decision in relation to the Fund, you should read the PDS and with the assistance of a financial adviser, consider if it is appropriate for your circumstances. The PDS is available at www.vaneck.com.au or by calling 1300 68 3837. The Fund is subject to investment risk, including possible loss of capital invested. Past performance is not a reliable indicator of future performance. No member of the VanEck group of companies gives any guarantee or assurance as to the repayment of capital, the payment of income, the performance or any particular rate of return from the Fund.
MVIS Australia Equal Weight Index ('MVIS Index') is the exclusive property of MV Index Solutions GmbH based in Frankfurt, Germany ('MVIS'). MVIS is a related entity of VanEck. MVIS makes no representation regarding the advisability of investing in the Fund. MVIS has contracted with Solactive AG to maintain and calculate the MVIS Index. Solactive uses its best efforts to ensure that the MVIS Index is calculated correctly. Irrespective of its obligations towards MVIS, Solactive has no obligation to point out errors in the MVIS Index to third parties.
© 2019 VanEck Australia Pty Ltd
1Cremers, K. J. Martijn and Petajisto, Antti, How Active is Your Fund Manager? A New Measure That Predicts Performance (March 31, 2009). AFA 2007 Chicago Meetings Paper; EFA 2007 Ljubljana Meetings Paper; Yale ICF Working Paper No. 06-14. Available at SSRN: https://ssrn.com/abstract=891719 or http://dx.doi.org/10.2139/ssrn.891719
2Page 1
3Petajisto, Antti, Active Share and Mutual Fund Performance (January 15, 2013). Available at SSRN: https://ssrn.com/abstract=1685942 or http://dx.doi.org/10.2139/ssrn.1685942
4http://www.lazardnet.com/docs/sp0/3045/TakingACloserLookAtActiveShare_LazardResearch.pdf?pagename=Investment+Research
5Active Share: A Misunderstood Measure in Manager Selection, Tim Cohen, Brian Leite, CFA, Darby Nielson, CFA, and Andy Browder. https://www.fidelity.com/bin-public/060_www_fidelity_com/documents/leadership-series_active-share.pdf


Published: 15 February 2019