Fractal geometry and finance: Why risk is still being measured wrong
In 2019, we wrote a Vector Insights: Fractal geometry and finance: You're doing risk wrong. In that piece, we argued that the assumptions behind risk models such as the capital asset pricing model (CAPM) and modern portfolio theory (MPT), which underpin most standard market capitalisation-based portfolios, are wrong. They still could be.
The 2019 Vector Insights introduced the work of mathematician Benoit Mandelbrot and his work in the field of fractal geometry.
Mandelbrot crossed disciplines and wrote a finance book in 2004 that, at the time, was largely ignored: The Misbehavior of Markets: A Fractal View of Financial Turbulence. In it, he considered the patterns of nature and the patterns of share markets.
Mandelbrot’s book was revisited after the GFC, when seemingly one- in-200-million-year events were happening every few months.
Seven worst days (in 30 years) and the probability of loss (Gaussian Bell Curve)
|
Return |
Date |
Description |
Probability (Years) |
|
-22.61% |
10/19/1987 |
'87–88 Bear Market, Black Monday |
377,928,949,357,521 + 25 more zeros |
|
-8.04% |
10/26/1987 |
'87–88 Bear Market, Program Trading |
22,546,897,547 |
|
-7.87% |
10/15/2008 |
Financial Crisis Bear Market |
7,348,618,460 |
|
-7.70% |
12/1/2008 |
Financial Crisis Bear Market |
2,449,539,487 |
|
-7.33% |
10/9/2008 |
Financial Crisis Bear Market |
241,966,705 |
|
-7.18% |
10/27/1997 |
Asian Currency Crash |
97,981,579 |
|
-7.13% |
9/17/2001 |
9/11/2001 Attack |
72,811,999 |
Source: Revisiting Modern Portfolio Theory, Investments & Wealth Monitor, 2017
Markets were not behaving like neat bell curves. Extreme events were happening more than expected. Volatility was clustering.
Chart 1: CBOE Volatility Index (“VIX”)
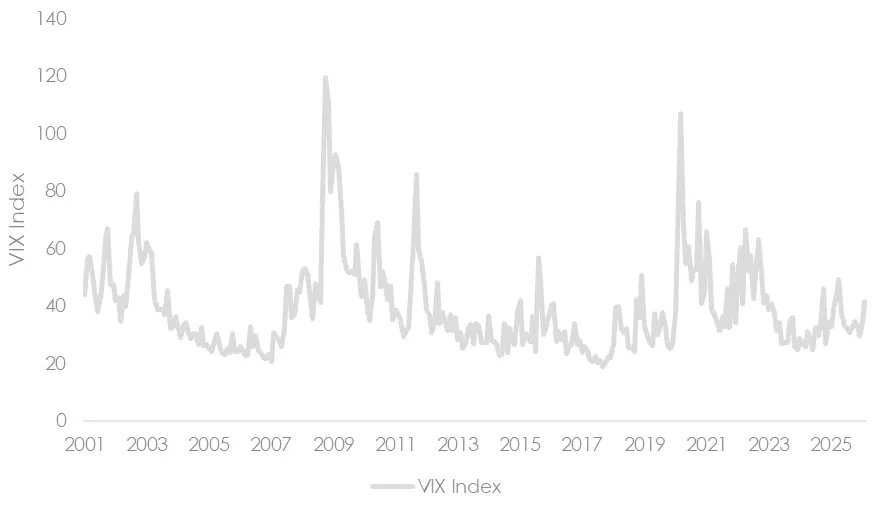
Source: Bloomberg, data to February 2026.
VIX is a real-time volatility index; it is also known as the ‘fear index’. It is calculated so that investors, financial media, researchers and economists can assess investor sentiment and expected levels of market volatility. You can see that when volatility occurs, it rarely dissipates immediately. It seems to tend to cluster.
Since our 2019 piece, markets have only hit the volatility extremes of the GFC during the COVID-19 crisis, as measured by VIX. Volatility during that period remained high, and, for the most part, markets weathered that storm. Could risk management have changed?
A recent paper by JP Bouchard, “Mandelbrot, Financial Markets and the Origins of “Econophysics” reflects on the legacy of Mandelbrot and his view that extreme market moves are not rare mistakes at the edge of the system. They are part of its structure.
An appreciation of Mandelbrot and fractal mathematics can help investors understand periods of extreme risk and better consider how their portfolios are positioned.
Let’s revisit risk. Modern financial theory often treats crises as:
- Rare exogenous shocks,
- Policy mistakes, or
- Information surprises.
But Bouchard cites evidence that tells a different story. “A large fraction of big price moves cannot be traced to identifiable public news. This is not a claim that news is irrelevant, but that the mapping between news and prices is weak, nonlinear, and mediated by market microstructure and crowd dynamics.”
Further, Bouchard states that volatility clusters, as can be observed in Chart 1 above. Bouchard uses a Mandelbrot quote: “Large changes tend to be followed by large changes, of either sign, and small changes tend to be followed by small changes.” Returns from one day to the next may not be correlated, but volatility is. Risk is persistent.
Fluctuations + interactions ⇒ emergence and endogenous dynamics
Under this heading, Bouchard argues why market crises feel sudden in markets, but often, like in nature, they have been building for years. Earthquakes and avalanches, for example, could have been the result of years of build-up, with nothing dramatic happening, until it does.
Financial markets can behave in a similar way. When leverage builds, when positions become crowded, and when liquidity providers follow similar risk models, the system may appear stable. Yet beneath the surface, it may be sensitive.
In such an environment, it doesn’t take a huge external shock to cause a large move. A relatively small trigger can cascade. And volatility begets more volatility.
Diversification has limits
For many investors, diversification reduces risk, and in many situations, it does. But Bouchard highlights, diversification assumes that risks are independent and reasonably well behaved. When distributions are “fat-tailed”, meaning extreme outcomes carry more weight, the mathematics changes.
Research into company sizes and the distribution of wealth shows that economic systems often follow power laws, where a small number of participants account for a large share of activity. We have seen this in Australian equities and more recently in international markets with the rise of the ‘Magnificent 7’.
This concentration matters.
If the largest firms dominate share market returns, their individual shocks don’t “average out.” They magnify.
Similarly, in financial markets, if liquidity is concentrated or portfolios become crowded in the same trades, diversification may not work as expected during periods of market stress.
When volatility is low, correlations are manageable. In periods of heightened stress, everything can be correlated.
Diversifiers should be cognisant of concentration, overcrowding and liquidity.
Mandelbrot’s legacy has extended beyond fractal geometry into finance. Markets are fractal. Traditional models, while useful theoretical tools, often do not reflect reality. Markets will not behave smoothly around an equilibrium.
In Fractal geometry and finance: You're doing risk wrong, we argued that Mandelbrot’s findings support the use of different investment approaches beyond market capitalisation, including smart beta and active tactical asset allocation. More pointedly, Bouchard has highlighted the risks of overcrowding and concentration.
Periods of low volatility do not necessarily mean risk has disappeared. In some cases, risks may be building beneath the surface as leverage rises or positioning becomes crowded.
Likewise, extreme events are not always “black swans” in the sense of being unimaginable. They may be the natural outcome of concentration risks that have been slowly building, and they amplify when the market reacts.
Understanding this helps shift how investors approach risks: “What shock will cause the next crisis?” is the wrong question. Rather, it may be more useful to consider, “Where is the build-up that is sensitive right now?”
Related Insights


Published: 26 February 2026
Any views expressed are opinions of the author at the time of writing and is not a recommendation to act.
VanEck Investments Limited (ACN 146 596 116 AFSL 416755) (VanEck) is the issuer and responsible entity of all VanEck exchange traded funds (Funds) trading on the ASX. This information is general in nature and not personal advice, it does not take into account any person’s financial objectives, situation or needs. You should consider whether or not an investment in any Fund is appropriate for you. Investments in a Fund involve risks associated with financial markets. These risks vary depending on a Fund’s investment objective. Refer to the applicable product disclosure statement (PDS) and target market determination (TMD) available at vaneck.com.au for more details. Investment returns and capital are not guaranteed.