The CBA - Concentration Breakthrough Approach
Earlier this month, CBA updated the market with its Q1 2026 Trading Update, reporting a marginal rise in first-quarter profit. However, its share price lost ground throughout that trading day and has subsequently fallen further as the market considers its lofty valuations.
CBA is the most expensive bank in the world, as it has been for some time, and still represents almost 10% of the S&P/ASX 200. A review of financial press following the release of its results highlights the reasons for CBA's recent price falls:
- Its price to earnings (P/E) is too high;
- Earnings per share growth is anaemic;
- It is only yielding around 2%; and
- Its margins are under pressure.
We have been highlighting the price of CBA and Australia’s banks and the concentration risk they may have become for many Australian equity portfolios for some time. Such sector bias makes sense if you are bullish on the sector, but given the well-noted pressures on banks remain, with margins under pressure, an economic outlook not conducive to growth and defaults potentially rising given that rates are now not expected to fall again until well into 2026 (if again at all), an approach to Australian equities with less concentration approach to Australian equities may be prudent.
Australian banks, on a global basis, are the most expensive in the developed world on a 12-month forward price-to-earnings and price-to-book basis. Should valuations move to be in line with global valuations, it could disproportionately impact many Australian portfolios, especially those that track or are benchmarked to the S&P/ASX 200, as banks make up over 20% of the Australian benchmark index.
| Chart 1: Global bank valuations | Chart 2: Average Big 4, 12-month forward price to earnings |
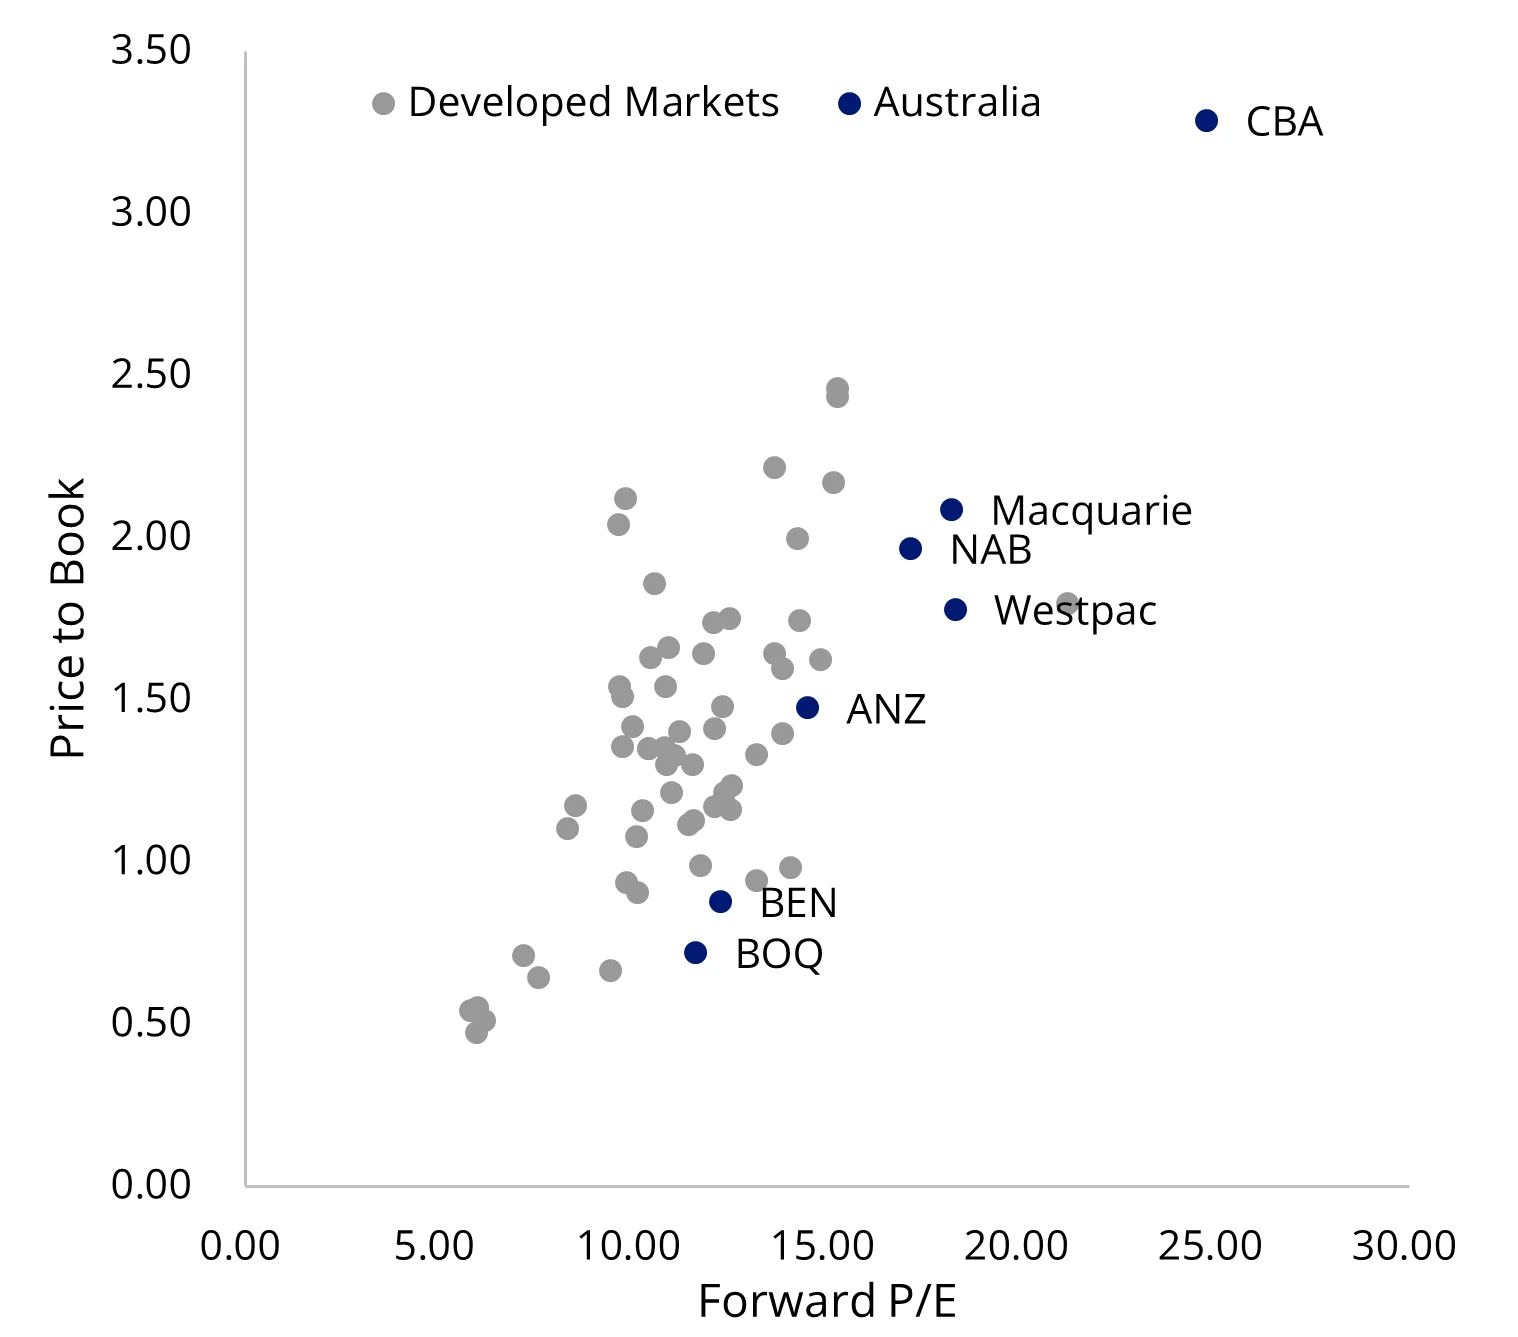 |
 |
Charts 1 and 2 source: Bloomberg, VanEck, 26 November 2025.
But it’s not just the sky-high valuations that are causing alarm for analysts. Another headwind that Australia’s banks must navigate is the economic outlook. Slowing credit growth, sluggish productivity and the potential that the next rate move will be higher, could increase the potential for arrears, also putting pressure on lenders.
A solution for managing mega-cap exposure with alternative weighting
VanEck’s Australian Equal Weight ETF (MVW) equally weights the largest and most liquid stocks on the ASX at each rebalance. As a result, at the last rebalance, no company was more than 1.39% away from its target. MVW has less exposure to the mega-caps that dominate the S&P/ASX 200 Index compared to many Australian equity portfolios. MVW is underweight mega-cap companies and overweight those large companies outside the mega-caps.
Chart 3: Market Cap Weight Differential: MVW vs S&P/ASX 200

Source: VanEck, FactSet; as at 31 October 2025.
Calculated by subtracting S&P/ASX 200 market cap bin weights from respective MVW market cap bin weights; positive differentials indicate greater MVW weight in the bin
Many advisers and their investors are already using MVW as their core Australian equity allocation.
Let’s walk through the difference between MVW and the S&P/ASX 200, and we will start with performance, noting that this is not indicative of future performance.
MVW vs S&P/ASX 200 - Performance
Equal weight investing has served Australian investors well. Since its inception on ASX in 2014, MVW has outperformed the S&P/ASX 200 by nearly 1% p.a. What this also means is that over that time, MVW has outperformed ETFs tracking that index.
Chart 4: Cumulative performance since MVW inception date to 26 November 2025
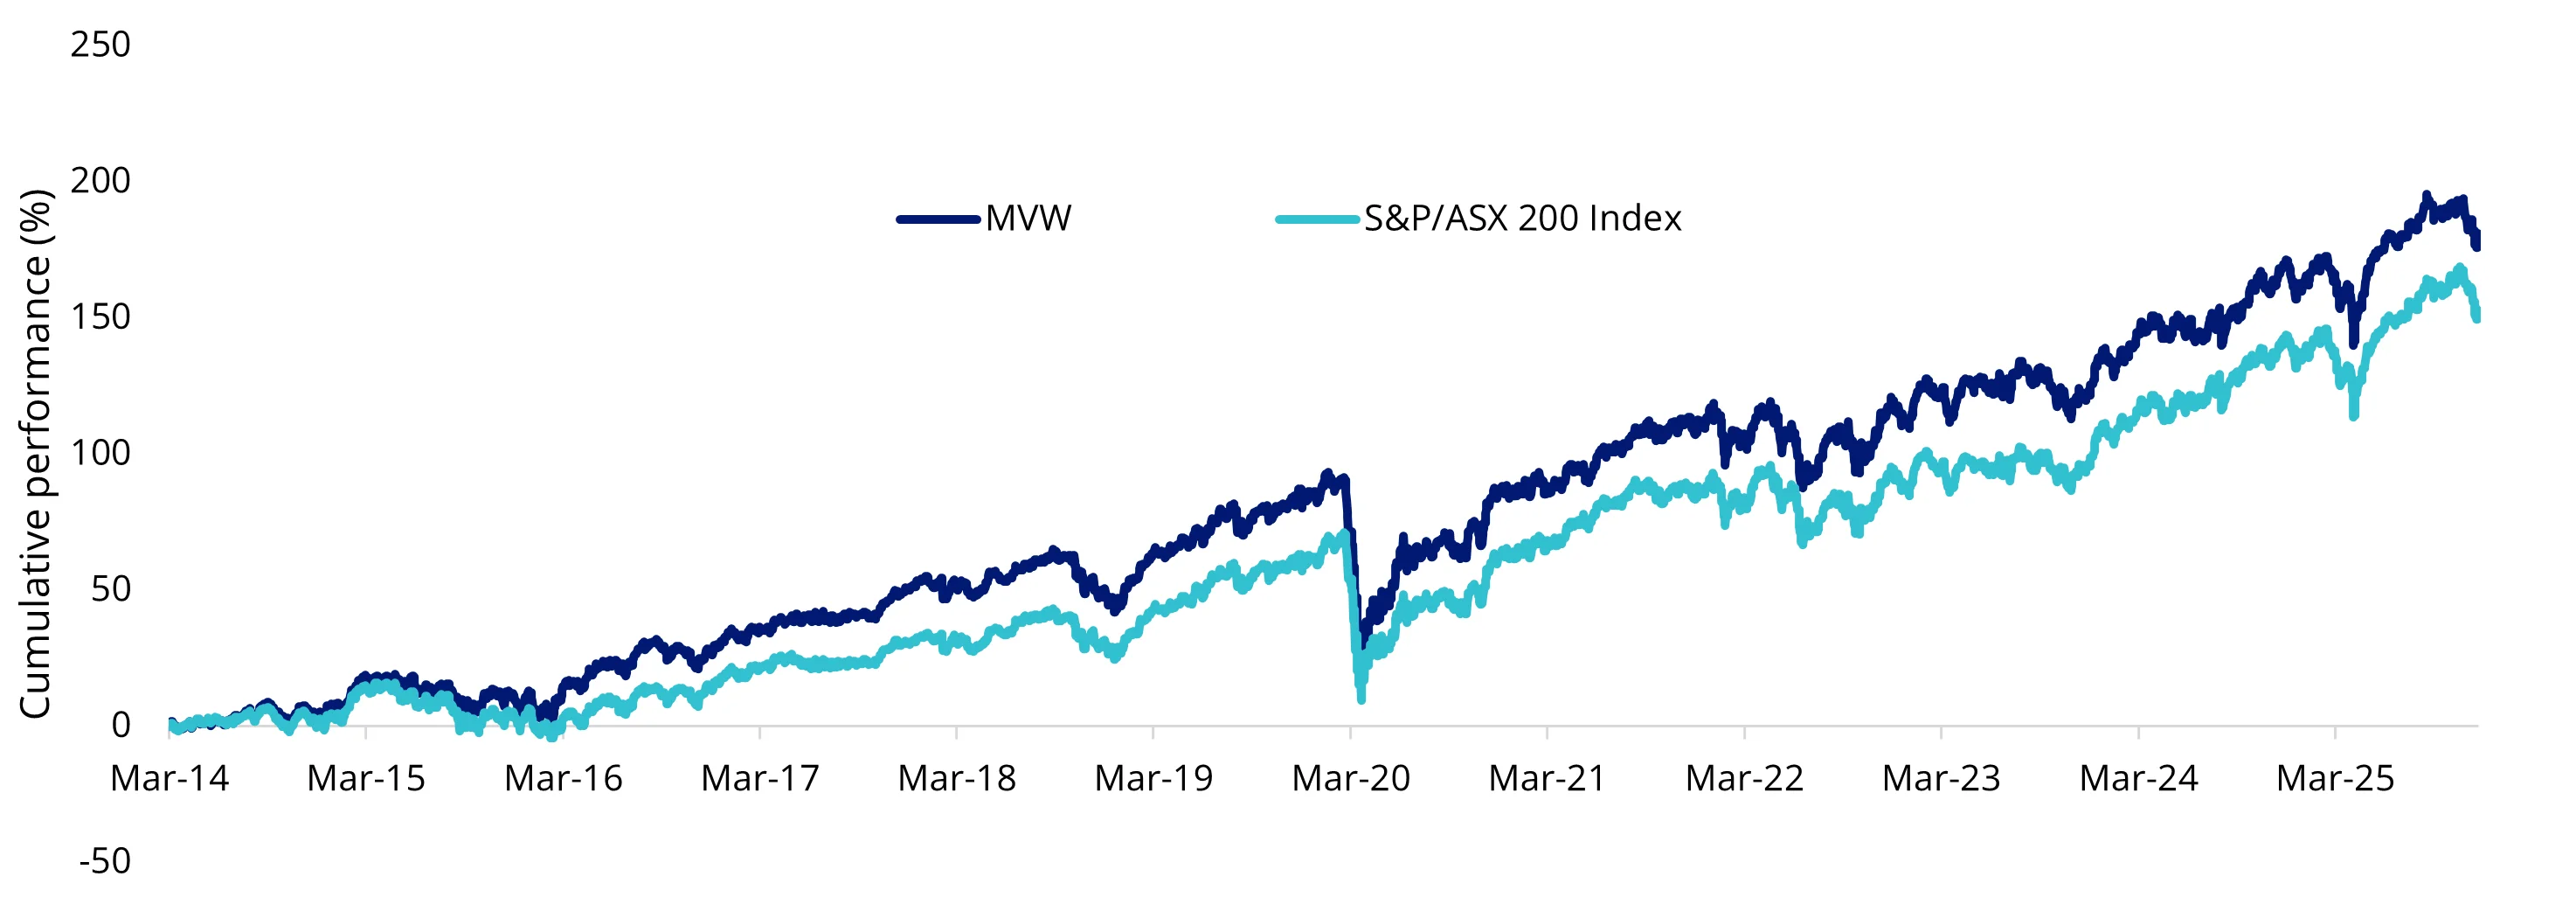
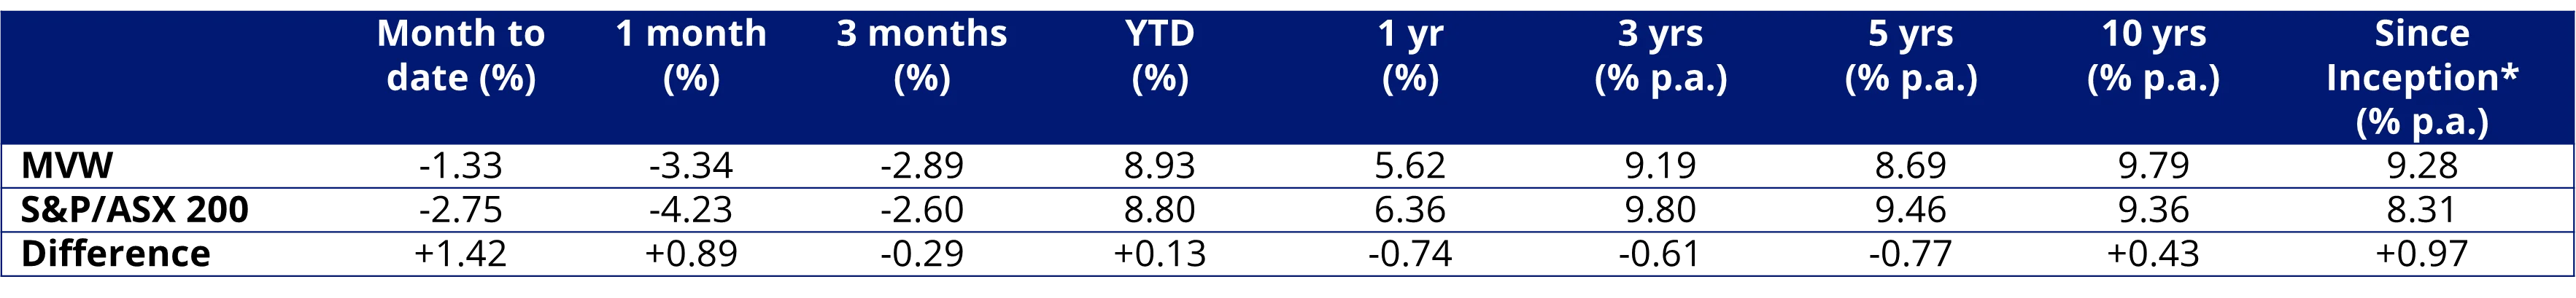
Table 1: Trailing performance to 26 November 2025
* MVW Inception date is 4 March 2014 a copy of the factsheet is here.
Chart 4 and Table 1 source: Morningstar Direct, VanEck. The chart and table above show past performance of MVW and of the S&P/ASX 200. You cannot invest directly in an index. Results are calculated to the last business day of the month and assume immediate reinvestment of distributions. MVW results are net of management fees and other costs incurred in the fund, but before brokerage fees and bid/ask spreads incurred when investors buy/sell on the ASX. Returns for periods longer than one year are annualised. Past performance is not a reliable indicator of future performance. The S&P/ASX 200 Index is shown for comparison purposes as it is the widely recognised benchmark used to measure the performance of the broad Australian equities market. It includes the 200 largest ASX-listed companies, weighted by market capitalisation. MVW’s index measures the performance of the largest and most liquid ASX-listed companies, weighted equally at rebalance. MVW’s index has fewer companies and different industry allocations than the S&P/ASX 200. Click here for more details.
MVW vs S&P/ASX 200 Index - Top 10 holdings
Below you can see the top 10 companies. The differences are stark – to see all the holdings in MVW and their weightings, click here. In the S&P/ASX 200, 47.07% of the portfolio is represented by the top 10. In other words, 190 other companies are squeezed into the remaining 52.93% of the portfolio.
Table 2: Top 10 holdings MVW & Table 3: Top 10 S&P/ASX 200

Source: FactSet, VanEck, MarketVector, as at 31 October 2025 & FactSet, VanEck, S&P, as at 31 October 2025
The reason MVW’s holdings are not equal above is that it only rebalances back to equal weight each quarter. The next rebalance is in December.
MVW vs S&P/ASX 200 Index - Sectors
MVW is currently underweight the financials sector by 15.5% compared to the S&P/ASX 200 and underweight materials (-5.1%) and consumer discretionary (-2.4%). Conversely, it is overweight all the other sectors, with the largest overweight exposures being industrials (+9.5%) and real estate by (+2.9%).
Chart 5: MVW and S&P/ASX 200 sector weightings
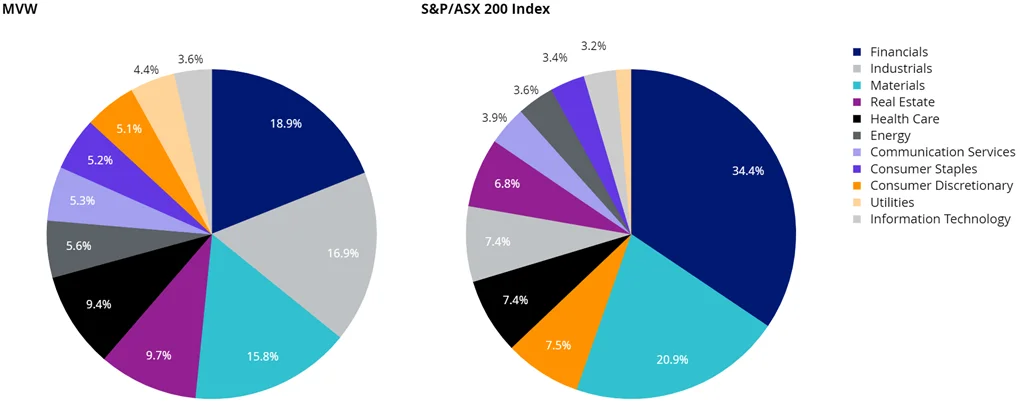
Source: FactSet, 31 October 2025
What this means is that if there is another systemic banking issue or pressure on commodities, the impact on the S&P/ASX 200 is greater than on MVW.
MVW vs S&P/ASX 200 - Diversification
A way to measure diversification of a portfolio is to calculate its Herfindahl Index. This index is a broadly used technique to quantify concentration. When used inversely, this index measures diversification. As at the last rebalance in September 2025, the Herfindahl Index for the S&P/ASX 200 was 320. The equivalent measure for the index MVW tracks was 138. The S&P/ASX 200 Index is therefore around two and a half times as concentrated as the S&P/ASX 200. In other words, the MVW Index is almost 2 and a half times more diversified than the S&P/ASX 200.
MVW vs S&P/ASX 200 Index - Style
When considering portfolios, it is important to determine what style e.g. value or growth and what size bias a portfolio holds e.g. giant, large, mid or small. Below we can see MVW’s. Importantly, MVW holds large companies with a similar value-core orientation relative to the S&P/ASX 200, which skews larger (giant). Importantly, MVW’s holdings are still large, liquid companies.
Chart 6: MVW holdings based style map & Chart 7: S&P/ASX 200 holdings based style map
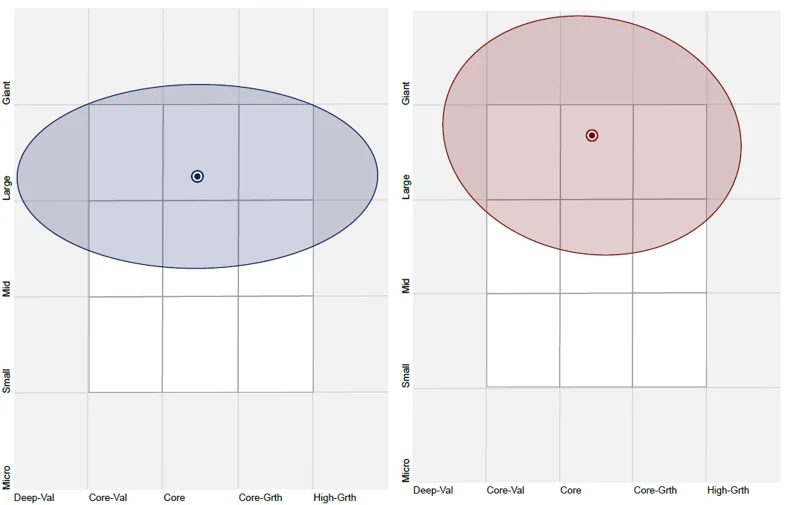
Source: Morningstar Direct, as at 31 October 2025 and Morningstar Direct, as at 31 October 2025
While each Australian equity ETF has its merits for portfolio inclusion, you should assess all the risks and consider your investment objectives.
Past performance is no guarantee of future performance. The above is not a recommendation. Please speak to your financial adviser or stockbroker.
For further information you can email us or call on us on +61 2 8038 3300.
Key risks: An investment in our Australian equal weight ETF carries risks associated with: financial markets generally, individual company management, industry sectors, fund operations and tracking an index. See the VanEck Australian Equal Weight ETF PDS and TMD for more details.
MVW is likely to be appropriate for a consumer who is seeking capital growth and a regular income distribution, is intending to use the product as a core, minor or satellite allocation within a portfolio, has an investment timeframe of at least 5 years, and has a high risk/return profile.


Published: 27 November 2025
Any views expressed are opinions of the author at the time of writing and is not a recommendation to act.
VanEck Investments Limited (ACN 146 596 116 AFSL 416755) (VanEck) is the issuer and responsible entity of all VanEck exchange traded funds (Funds) trading on the ASX. This information is general in nature and not personal advice, it does not take into account any person’s financial objectives, situation or needs. The product disclosure statement (PDS) and the target market determination (TMD) for all Funds are available at vaneck.com.au. You should consider whether or not an investment in any Fund is appropriate for you. Investments in a Fund involve risks associated with financial markets. These risks vary depending on a Fund’s investment objective. Refer to the applicable PDS and TMD for more details on risks. Investment returns and capital are not guaranteed.
MVIS Australia Equal Weight Index (‘MVIS Index’) is the exclusive property of MarketVector Indexes GmbH ('MarketVector')based in Frankfurt, Germany (‘MVIS’). MVIS is a related entity of VanEck. MVIS makes no representation regarding the advisability of investing in the Fund. MVIS has contracted with Solactive AG to maintain and calculate the MVIS Index. Solactive uses its best efforts to ensure that the MVIS Index is calculated correctly. Irrespective of its obligations towards MVIS, Solactive has no obligation to point out errors in the MVIS Index to third parties.