Satoshi-era whales still bullish on bitcoin
Key takeaways
- Long-term whales are still holding, with 5+ year coins continuing to grow.
- Selling is concentrated in mid-cycle holders, not the oldest wallets.
- Futures markets look washed out, with funding and open interest at oversold levels.
The last 30 days of price action have been particularly unkind to bitcoin holders, with BTC down over 20% on motivated selling. Since 11 October to the middle of November 2025, balances across global bitcoin ETPs are down 49.3K BTC, around -2% of total AUM, as the investors who bought near the price peak sold off amid rate cut uncertainty and wobbles in the AI narrative.
Many are pointing the finger at early bitcoin whales (investors who hold more than 1,000 bitcoins) for the recent price weakness, including a “Satoshi Era” Whale (circa Jan 2009 to Dec 2010), who reportedly sold US$1.5 billion worth of bitcoin in the week ending the 16th November 2025. However, we think this is a misconception, based on a closer look at the key data points.
Tenured whales are often considered as telegraphing long-term moves in BTC by buying or selling at pivotal junctures. As a result, some of the noise regarding whale sell-offs has resulted in the crypto community becoming bearish, as indicated by the fear/greed index hitting its lowest level since March 2025 at the beginning of the tariff tantrum.
Chart 1: Fear spikes among bitcoin investors

Source: Glassnode as of 14 November 2025. BTC price in USD. Past performance is no guarantee of future results. Not intended as a recommendation to buy or sell any securities named herein.
Smaller whales accumulate as largest whales distribute
Rather than assuming the recent weakness stems from large holder selling, it helps to examine the full distribution of flows across cohorts. The onchain picture shows a more nuanced rotation than simple “whale dumping.” If we look at holdings of whales with more than 1,000 BTC, we can see that they have been reducing their BTC exposure since November 2023.
Chart 2: Whales positions lower long-term, higher short term

Table 1: Whale positions lower long-term, higher short term

Source: Glassnode as of 14 November 2025. Past performance is no guarantee of future results. Not intended as a recommendation to buy or sell any securities named herein.
In fact, whales with 10K-100K BTC have reduced their supply by -6% and -11% over the last 6 months and 12 months, respectively. This supply has been absorbed by “minnows” holding between 100 and 1,000 BTC. This smaller class of investors has increased holdings +9% and +23% over the past 6 months and 12 months, respectively. For context, at the time of writing, BTC is up ~170% in US dollar terms over the last two years.
Short-term whales flip to net buyers
Short-term data tells a different story of some whale cohorts that have been accumulating bitcoin. The 10K–100K BTC group has increased holdings by about +3%, +2.5%, and +84 basis points over the last 30, 60, and 90 days. This likely reflects the tariff-driven selloff in early October and subsequent liquidations, which cut BTC futures open interest by about 19% in 12 hours and pushed the price lower by more than 20% in US dollar terms.
Chart 3: Oldest BTC whales are holding while mid-cycle traders sell
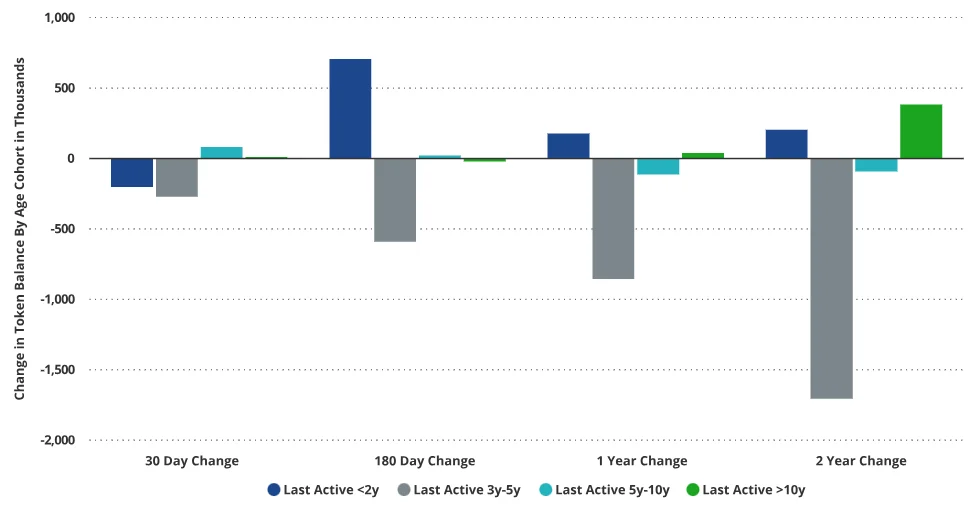
Table 2: Oldest BTC whales are holding while mid-cycle traders sell (change in token balance)

Source: Glassnode as of 14 November 2025. Past performance is no guarantee of future results. Not intended as a recommendation to buy or sell any securities named herein.
Mid-cycle holders are the real sellers
However, analysing “whale data” by holder size provides an incomplete picture. This view overlooks the rotation of aged, experienced whales transferring their coins to newer, greenhorn holders.
To deepen our understanding, we examine bitcoin balances by “last actively moved,” which indicates the time elapsed since the token was last transferred. The implication of a transfer is that the tokens were likely sold to different holders.
Over the past 30 days, selling pressure has been concentrated in the <5-year age bands, while older tokens have largely retained or increased their holdings. Interestingly, over the last six months, ownership has shifted from the 3–5 yr group to the 6m–2 yr cluster, signaling a move from mid-term holders toward newer participants.
Among the older cohort, those whose coins last moved >5 years ago, token turnover remains low relative to other groups. In contrast, the largest churn has occurred among tokens last moved 3–5 yrs ago, a band that has consistently declined across each study period. Over the past two years, supply in this tranche has dropped by 32% as coins were sent to new addresses. Given that many of these tokens were likely accumulated during the doldrums of the previous bitcoin cycle, their holders appear to be opportunistic cycle traders rather than long-term investors.
Meanwhile, tokens last moved >5 yrs ago have seen a net increase of +278K BTC compared to two years ago. This gain reflects younger coins aging into the 5+ yr category rather than renewed accumulation, yet it still indicates continued conviction among long-term whales. While further granularity could yield additional insights, the overarching trend remains encouraging: the longest-term holders continue to accumulate and hold.
Futures markets show a speculation reset
One of the best measures of speculation is the annualised basis costs paid by traders willing to be long bitcoin perpetual futures (perpetuals). Because these traders never settle, the perpetuals prices are brought in line with spot prices by means of an interest rate charged to one counterparty of the trade. If the perpetual’s price is above the spot price, the long side of the trade must pay the short side an interest rate relative to the magnitude of the spot/perpetual price difference. Because crypto has asymmetric upside, perpetuals basis is almost always positive.
During periods of lower demand for long crypto like bitcoin, the basis collapses. Recently, we saw a dramatic collapse in open interest for bitcoin perpetuals, down20% in BTC terms since 9 October 2025, and -32% in US dollar terms (to mid-November 2025). This partly explains the substantial collapse in funding rates. Of course, if people were bullish about BTC, this rate would quickly climb.
Chart 3: BTC futures basis at lowest levels since late September

Source: Glassnode as of 14 November 2025. Note: dates shown in US format mm/dd/yy Past performance is no guarantee of future results. Not intended as a recommendation to buy or sell any securities named herein.
In the past, long-term downturns in BTC price were often preceded by blow-off tops of speculation where perpetuals funding averaged 40% on some days. We have not seen that sort of acceleration of funding since March 2024. Funding rate collapses of the magnitude we have just witnessed are typically associated with oversold conditions. This is particularly true when we see a concurrent collapse in perpetuals open interest of the ferocity that recently transpired.
Additionally, the Net Unrealised Profit/Loss ratio has hit tactically oversold levels that match those seen during the Tariff Tantrum in earlier in the year and the Yen implosion in August 2024. Armed with this data, investors can proceed more tactically bullish after a month of very dramatic selling, in our opinion.


Published: 21 November 2025
Any views expressed are opinions of the author at the time of writing and is not a recommendation to act.
VanEck Investments Limited (ACN 146 596 116 AFSL 416755) (VanEck) is the issuer and responsible entity of all VanEck exchange traded funds (Funds) trading on the ASX. This information is general in nature and not personal advice, it does not take into account any person’s financial objectives, situation or needs. The product disclosure statement (PDS) and the target market determination (TMD) for all Funds are available at vaneck.com.au. You should consider whether or not an investment in any Fund is appropriate for you. Investments in a Fund involve risks associated with financial markets. These risks vary depending on a Fund’s investment objective. Refer to the applicable PDS and TMD for more details on risks. Investment returns and capital are not guaranteed.