Emerging markets outperformed developed markets in 2025
‘Value’ in global equities may involve searching in the far corners of the earth. Sometimes that is where untapped opportunities lie.
Emerging markets have become known for being at the forefront of innovation. Think Samsung and LG, both Korean. Taiwan Semiconductor Manufacturing Company. Among leading automobile firms, BYD, Kia, Hyundai, Tata, all out of emerging markets. These are companies that are competing with developed market companies too, but these firms are listed on emerging market exchanges. Like investing in developed markets, it is prudent to take the right approach.
Australian investors have been investing offshore for some time, and the rise of ETFs has increased the opportunity set and further expanded the investment landscape. That investment landscape is changing.
One of the investment themes of the past 12 to 18 months has been the end of US exceptionalism. What this narrative suggests is that there will be a decline in the US’s economic influence. The shift could lead to the loss of global dominance and a decrease in US economic competitiveness. One of the symptoms of the decline in US exceptionalism is the decline in the value of the US dollar.
Usually, when the US dollar falls, emerging market equities are a beneficiary. This is why emerging markets are currently piquing investors’ interest. You need look no further than 2025 performance.
As we highlighted in our recent Vector Insights, in 2025, emerging Market equities outperformed the broad developed markets by 11.48% and the US and our own bourse.
Table 1: 2025 calendar year equity market returns
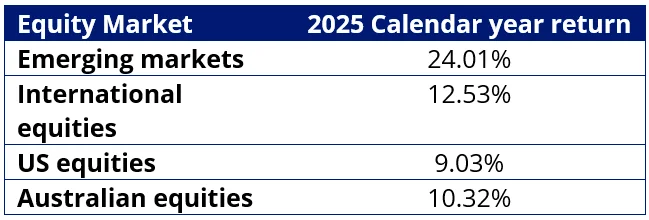
Source: Bloomberg, Emerging markets is the MSCI Emerging Markets Index, International equities is MSCI World ex Australia Index, US equities is S&P 500 Index, Australian equites is S&P/ASX 200 Index. All returns in Australian dollars. Past performance is not indicative of future performance. You cannot invest in an index.
On paper, what should have been a tough year for emerging markets appears to have been more difficult for developed market bond and equity markets.
In 2025, emerging markets were faced with the challenges of the Trump administration’s tariff policy, which was predicted to negatively affect emerging market economies, as well as consumer and corporate weakness in China, which was predicted to have a contagion to other parts of Asia. The performance says otherwise.
The problem for many investors is that they are missing out. Investing in emerging markets is expensive and difficult; there are also other potential risks to consider, such as currency, geopolitical, economic, market and sector risks.
Some of those investors who do have an exposure to emerging markets pay higher fees for a professional active manager to select the best emerging market opportunities.
Active managers aim to outperform the benchmark index. When it comes to emerging market equity investing, the widely used benchmark is the MSCI Emerging Markets Index (MSCI EM Index). Active emerging market managers are trying to outperform this index. If the MSCI EM Index rises 10%, investors would expect their active manager to return higher than 10%. Likewise, when the MSCI EM Index falls 10%, investors expect their fund manager not to fall by more than 10%.
As many investors are aware, the returns in active funds can be good, but often they are not. Another alternative is lower-cost passive funds that track the MSCI EM Index, but because of the index rules, many emerging market companies that are undesirable from an investment standpoint can be included in the index.
Innovations in index design for passive funds have delivered above-market benchmark returns over the long term while retaining low costs. It is known as smart beta, and this is the approach VanEck offers in emerging market equities.
VanEck MSCI Multifactor Emerging Markets Equity ETF (ASX: EMKT) tracks the MSCI Emerging Markets Multi-Factor Select Index (AUD) (EMKT Index), and it provides investors with diversified access to companies that demonstrate four factors: Value, Momentum, Low Size and Quality. Factors are identifiable, persistent drivers of risk and return.
We have written a white paper that supports this approach. Historically, taking a diversified approach across factors has been proven to produce outperformance over the long term compared to a benchmark market capitalisation approach in emerging markets.
So, let’s walk through the difference between EMKT and the MSCI EM Index, starting with performance (and maybe have a look at some active manager performance too).
EMKT vs MSCI EM Index - Performance
EMKT launched on ASX in April 2018 and has demonstrated strong outperformance since its inception, as highlighted by the table below. As always, it is important to note that past performance is not indicative of future performance.
Table 2: Trailing performance as at 31 January 2026
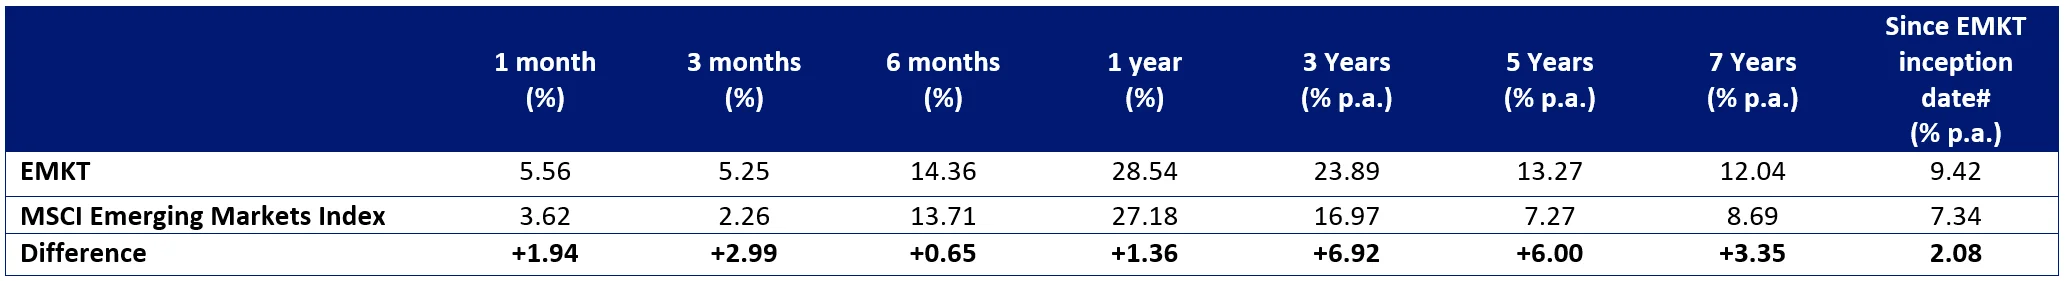
Source: VanEck, Morningstar Direct
#EMKT inception date is 10 April 2018 and a copy of the factsheet is here.
Results are calculated to the last business day of the month and assume immediate reinvestment of distribution. Performance is calculated net of management fees, calculated daily but do not include brokerage costs or buy/sell spreads of investing in EMKT. Past performance is not a reliable indicator of future performance.
The MSCI Emerging Markets Index (“MSCI EMI”) is shown for comparison purposes as it is the widely recognised benchmark used to measure the performance of emerging markets large- and mid-cap companies, weighted by market capitalisation. EMKT’s index measures the performance of emerging markets companies selected on the basis of their exposure to value, momentum, low size and quality factors, while maintaining a total risk profile similar to that of the MSCI EMI, at rebalance. EMKT’s index has fewer companies and different country and industry allocations than MSCI EMI. Click here for more details
EMKT’s performance is impressive, relative to the MSCI EM Index. It is also worth considering its performance relative to its active peers. EMKT’s performance puts it in the top quartile (the top box) of active peers for all the trailing periods noted in the table above. It is worth noting in Chart 1 below that the MSCI Emerging Markets index has beaten more than 50% of active emerging market managers in all those trailing periods. In other words, over 50% of active managers are not achieving their objective noted above. Another notable aspect is the disparity of returns between fund managers. Over three years, the top performing fund managers returned close to 25% per annum, over the same period, the worst performing had a negative return.
Chart 1: Performance relative to active manager peer group
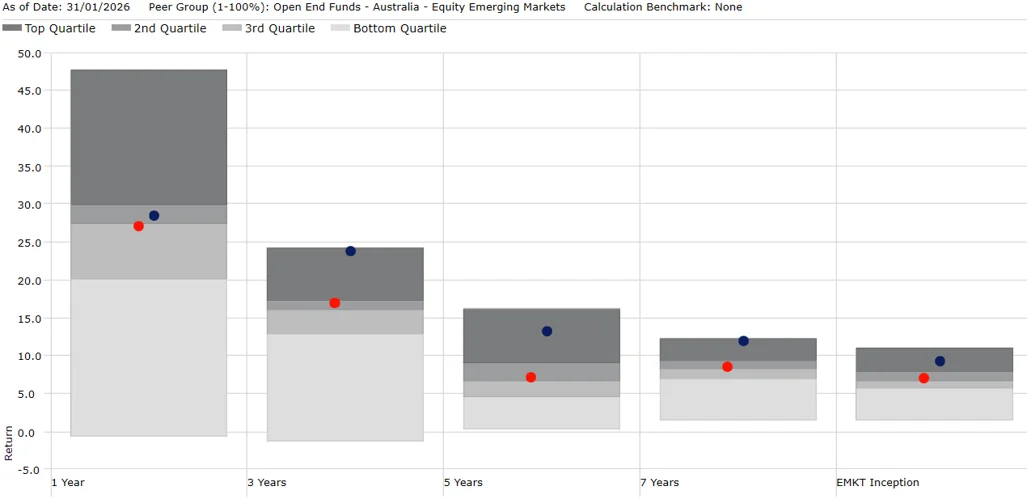
Source: Morningstar. Past performance is not indicative of future performance. Results are calculated to the last business day of the month and assume immediate reinvestment of distributions. Results are net of management fees and other costs incurred in the fund, but before brokerage fees and bid/ask spreads. Returns for periods longer than one year are annualised. Peer group Equity Region Emerging Markets funds invest in companies listed in emerging markets from around the globe. Emerging market securities typically account for at least 75% of the portfolio.
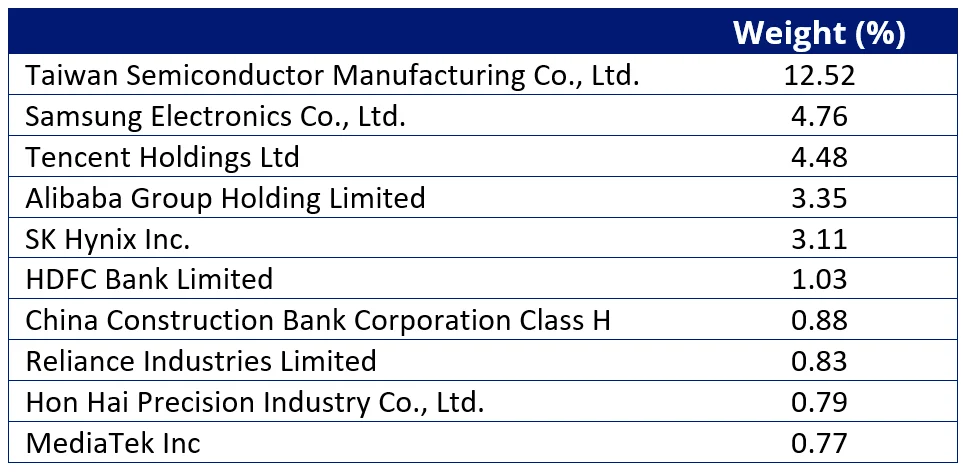
EMKT vs MSCI EM Index - Top 10 holdings
Below you can see the top 10 companies. The top 10 holdings are companies that investors can relate to in their day-to-day lives, such as Taiwan Semiconductor Manufacturing and Kia. Notable differences to the MSCI EM Index top 10 include South African gold miner Gold Fields Limited, the UAE’s property developer EMAAR and Korean behemoth Hana Financial Group – to see all the holdings in EMKT and their weightings, click here.
Table 3: Top 10 holdings EMKT
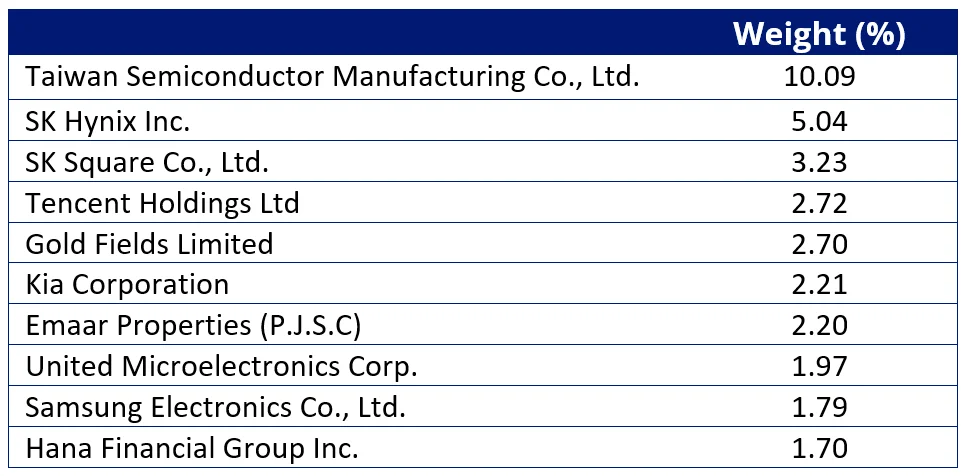
Source: FactSet, VanEck, MSCI, as at 31 January 2026. Current weightings may differ.
Table 4: Top 10 MSCI EM Index
Source: FactSet, VanEck, MSCI, as at 31 January 2026. Current weightings may differ.
EMKT vs MSCI EM Index – Fundamentals
Table 5: Statistics and fundamentals
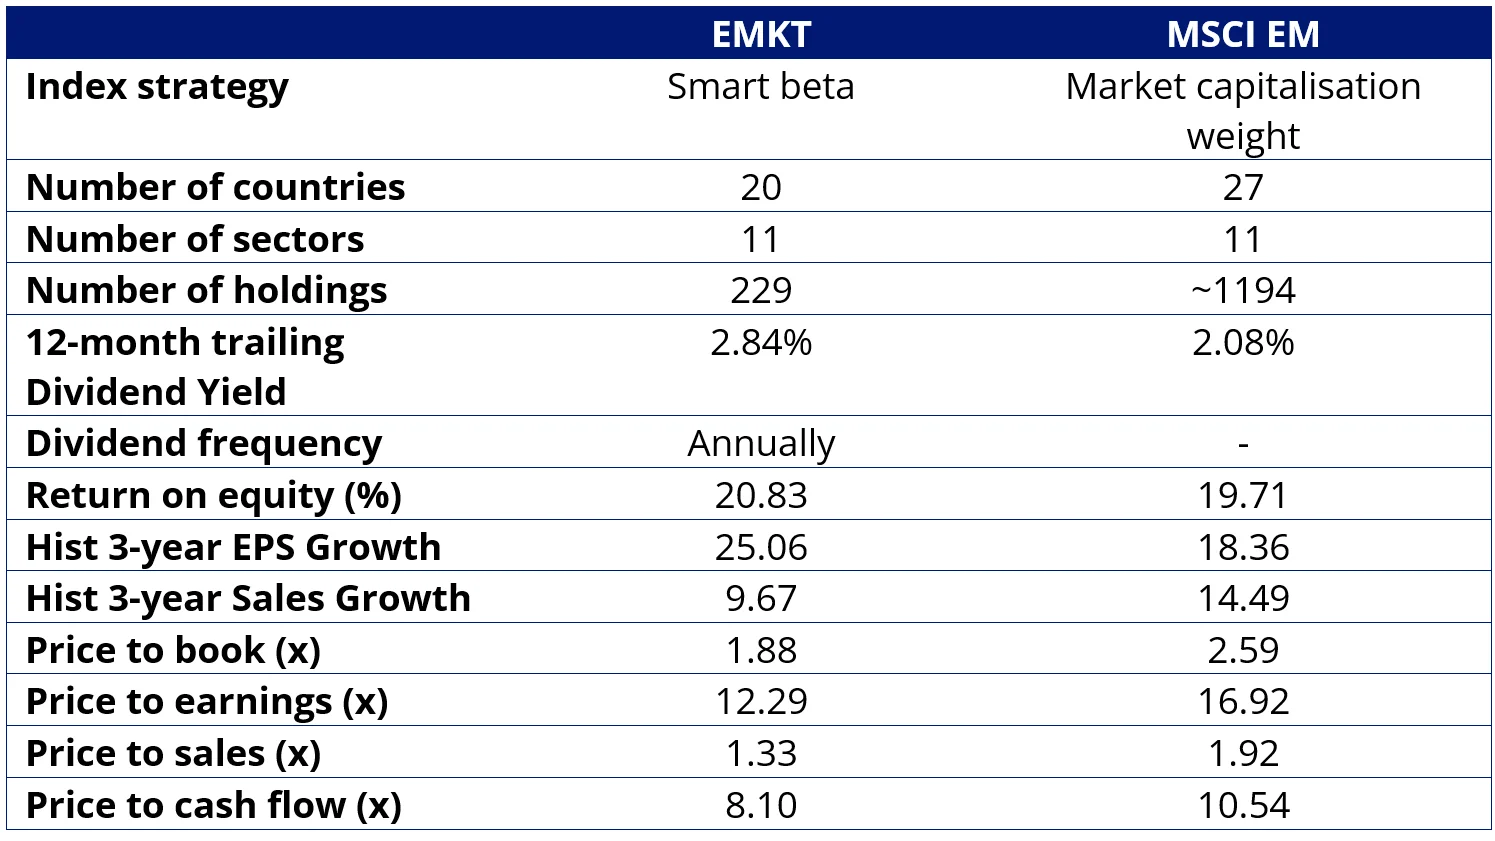
Source: FactSet as at 31 January 2026. Past performance is not indicative of future performance. You cannot invest directly in an index.
As you would expect, EMKT has a lower price to book, price to earnings, price to sales and price to cash flow. It also has a higher return on equity. While emerging markets are not typically associated with income, EMKT’s current trailing dividend yield is higher than the market index.
When you consider these valuations in the context of global equities, emerging markets look compelling. On both a price to book and a price to equities measures emerging market companies are far lower than developed markets, with a multi-factor strategy showing an edge.
Charts 2 and 3: Relative to developed markets, emerging markets look compelling
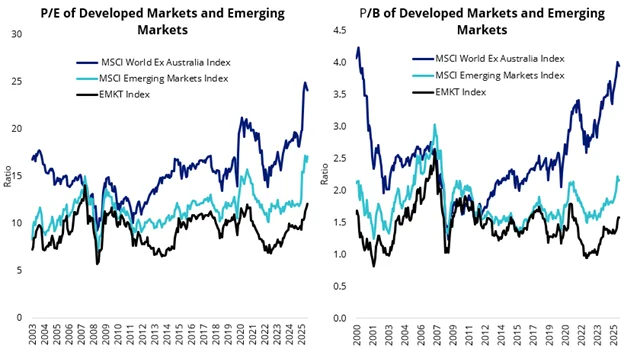
Source: MSCI, FactSet, Chart 2: End of 2003 to December 2025, Chart 3: End of 2000 to December 2025. You cannot invest in an index. EMKT index is MSCI Emerging Markets Multi-Factor Select Index (AUD)
There are potential pockets of ‘value’ in global markets; you have to know where to look.
Past performance is not indicative of future performance. The above is not a recommendation.
Please speak to your financial adviser or stockbroker.
For further information, you can email us at [email protected] or call us on +61 2 8038 3300.
Key risks
An investment in EMKT carries risks associated with: ASX trading time differences, emerging markets, financial markets generally, individual company management, industry sectors, foreign currency, country or sector concentration, political, regulatory and tax risks, fund operations, liquidity and tracking an index. See the PDS and TMD for details.
EMKT is likely to be appropriate for a consumer who is seeking capital growth, is intending to use the product as a core, minor or satellite allocation within a portfolio, has an investment timeframe of at least 5 years, and has a high risk/return profile.


Published: 20 February 2026
Any views expressed are opinions of the author at the time of writing and is not a recommendation to act.
VanEck Investments Limited (ACN 146 596 116 AFSL 416755) (VanEck) is the issuer and responsible entity of all VanEck exchange traded funds (Funds) trading on the ASX. This information is general in nature and not personal advice, it does not take into account any person’s financial objectives, situation or needs. The product disclosure statement (PDS) and the target market determination (TMD) for all Funds are available at vaneck.com.au. You should consider whether or not an investment in any Fund is appropriate for you. Investments in a Fund involve risks associated with financial markets. These risks vary depending on a Fund’s investment objective. Refer to the applicable PDS and TMD for more details on risks. Investment returns and capital are not guaranteed.
EMKT is indexed to a MSCI index. EMKT is not sponsored, endorsed or promoted by MSCI, and MSCI bears no liability with respect to EMKT or the MSCI Index. The PDS contains a more detailed description of the limited relationship MSCI has with VanEck and EMKT.