Why you shouldn’t avoid emerging markets in 2026.
In 2025 many investors missed the emerging markets opportunity. However, we don’t think it’s too late.
In our recent Vector Insights, we highlighted that despite what should have been a difficult year for emerging markets, was anything but.
In 2025, emerging markets were faced with the challenges of the Trump administration’s tariff policy, which was predicted to negatively affect emerging market economies, as well as consumer and corporate weakness in China, which was predicted to have a contagion to other parts of Asia.
Instead, emerging markets thrived, challenging outdated perceptions of political and economic instability.
As shown in the table below, emerging market bonds outperformed global developed market bonds by 5.19% in 2025 and Australian bonds by 6.44%.
Table 1: 2025 calendar year bond market returns

Source: Bloomberg, Emerging markets is the 50% J.P. Morgan Emerging Market Bond Index Global Diversified Hedged AUD and 50% J.P. Morgan Government Bond-Emerging Market Index Global Diversified, Global Bonds is the Bloomberg Global Aggregate Bond Index hedged into AUD, Australian Bonds is the Bloomberg AusBond Composite 0+ Yr Index. All returns in Australian dollars. Past performance is not indicative of future performance. You cannot invest in an index.
Many investors missed this opportunity, but we don’t think it’s too late.
Why emerging markets bonds were avoided, and why that’s changing in 2026
The fundamental case for investing in emerging markets bonds has been building for some time, but investors have shown little interest in the asset class over the past several years. Many investors view emerging market bonds as risky. However, we believe that is changing. emerging markets bonds are now entering a favourable phase. Despite heightened geopolitical noise and renewed trade tensions, emerging market bonds rallied in 2025.
Chart 1: Emerging markets bonds rallied in 2025
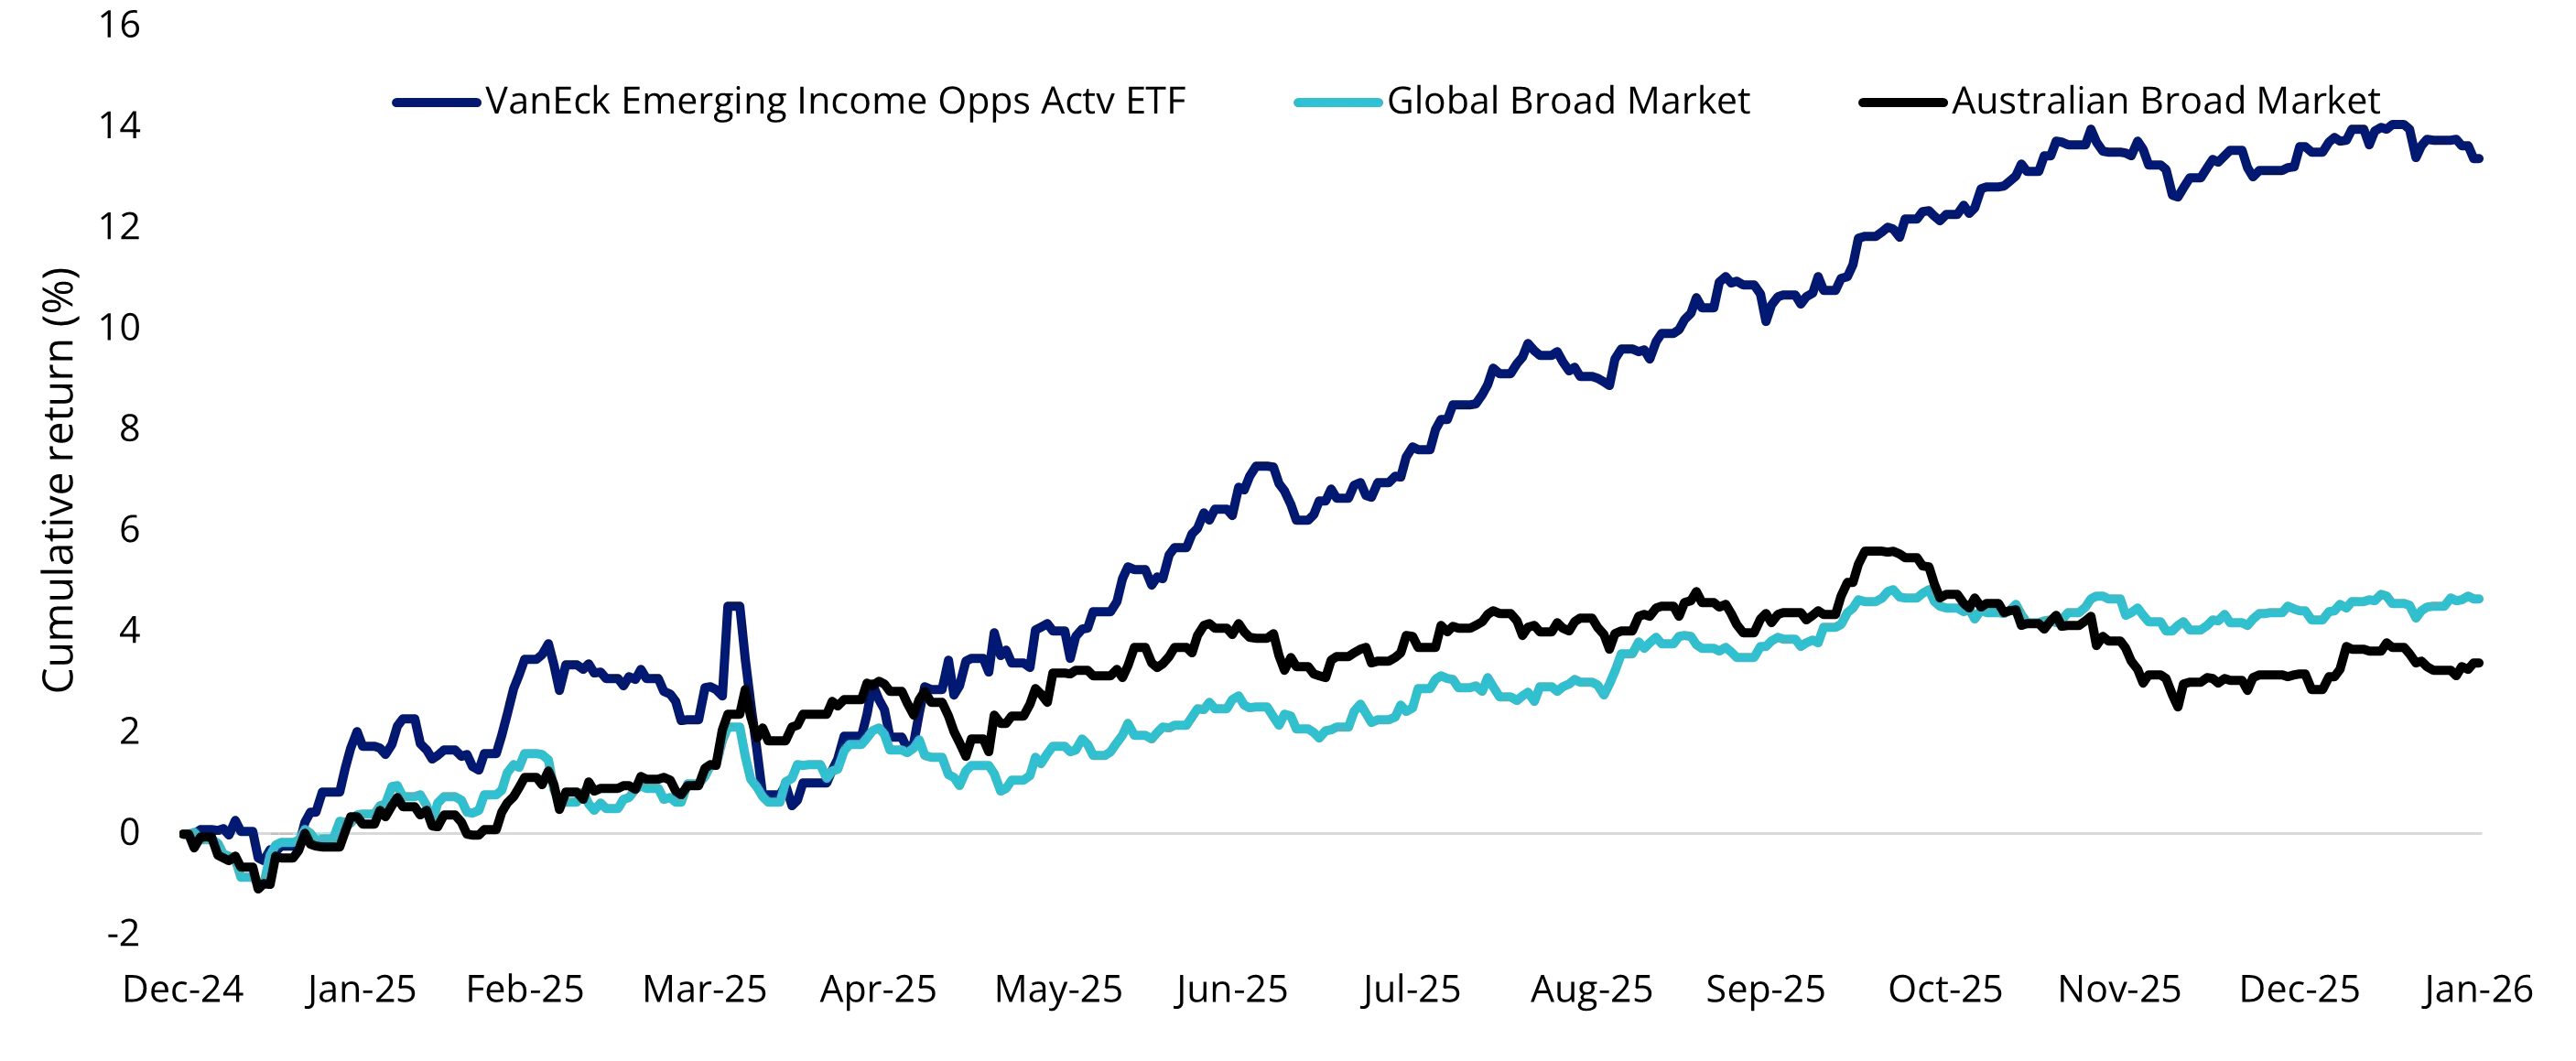
Source: Morningstar as of 31/12/2024 to 31/1/2026. All returns in Australian dollars, for illustrative purposes only. Global Broad Market is represented by the Bloomberg Global Aggregate Bond Index AUD Hedged, Australian Broad Market is represented by the Bloomberg AusBond Composite 0+ YR Index. VanEck Emerging Income Opportunities Active ETF (EBND's) results assume immediate reinvestment of all dividends and include management fees but exclude brokerage costs and taxes. Past performance is not indicative of future performance. It is not possible to invest directly in an index.
This mirrors the early stages of the 2018 trade war, but with a key difference: the US dollar is weakening, and markets are increasingly positioning for this shift. Actual performance, rather than headlines, is driving investor outcomes.
Charts 2 and 3: EM bonds under Trump’s tariffs in 2018 and 2025
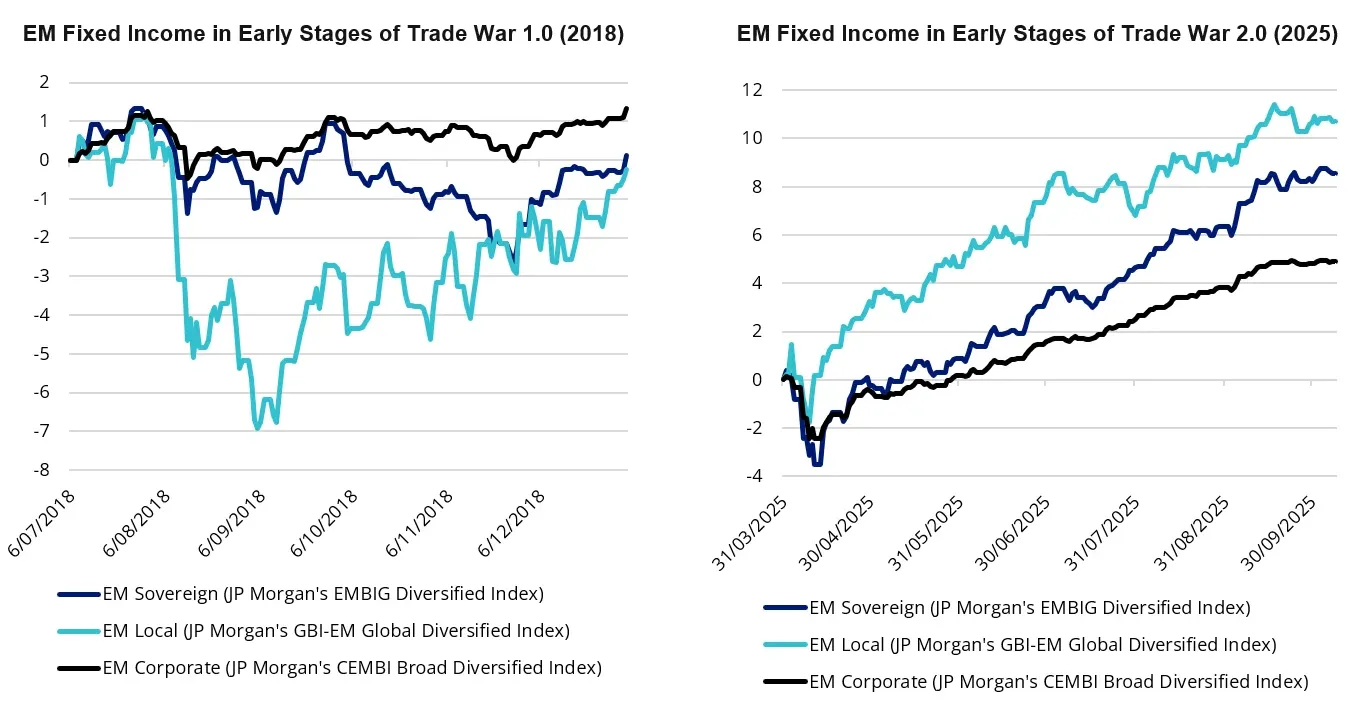
Source: VanEck Research; Bloomberg LP. LHS July 2018 to January 2019. RHS March 2025 to October 2025. Not intended as a prediction of future results. For illustrative purposes only. Past performance is not indicative of future performance.
US stagflation risk is a structural tailwind
One of the reasons the US dollar is depreciating is that the US currently faces rising stagflation risk. Inflation is remaining elevated relative to growth. In contrast, inflation across many emerging markets, particularly China, has been structurally lower. Historically, such inflation differentials point to currency weakness in higher-inflation economies, reinforcing the case for US dollar depreciation. Valuation measures support this view, with the US dollar appearing overvalued and the Chinese yuan undervalued on a real effective basis.
Chart 4: CNY and USD – real effective exchange rates
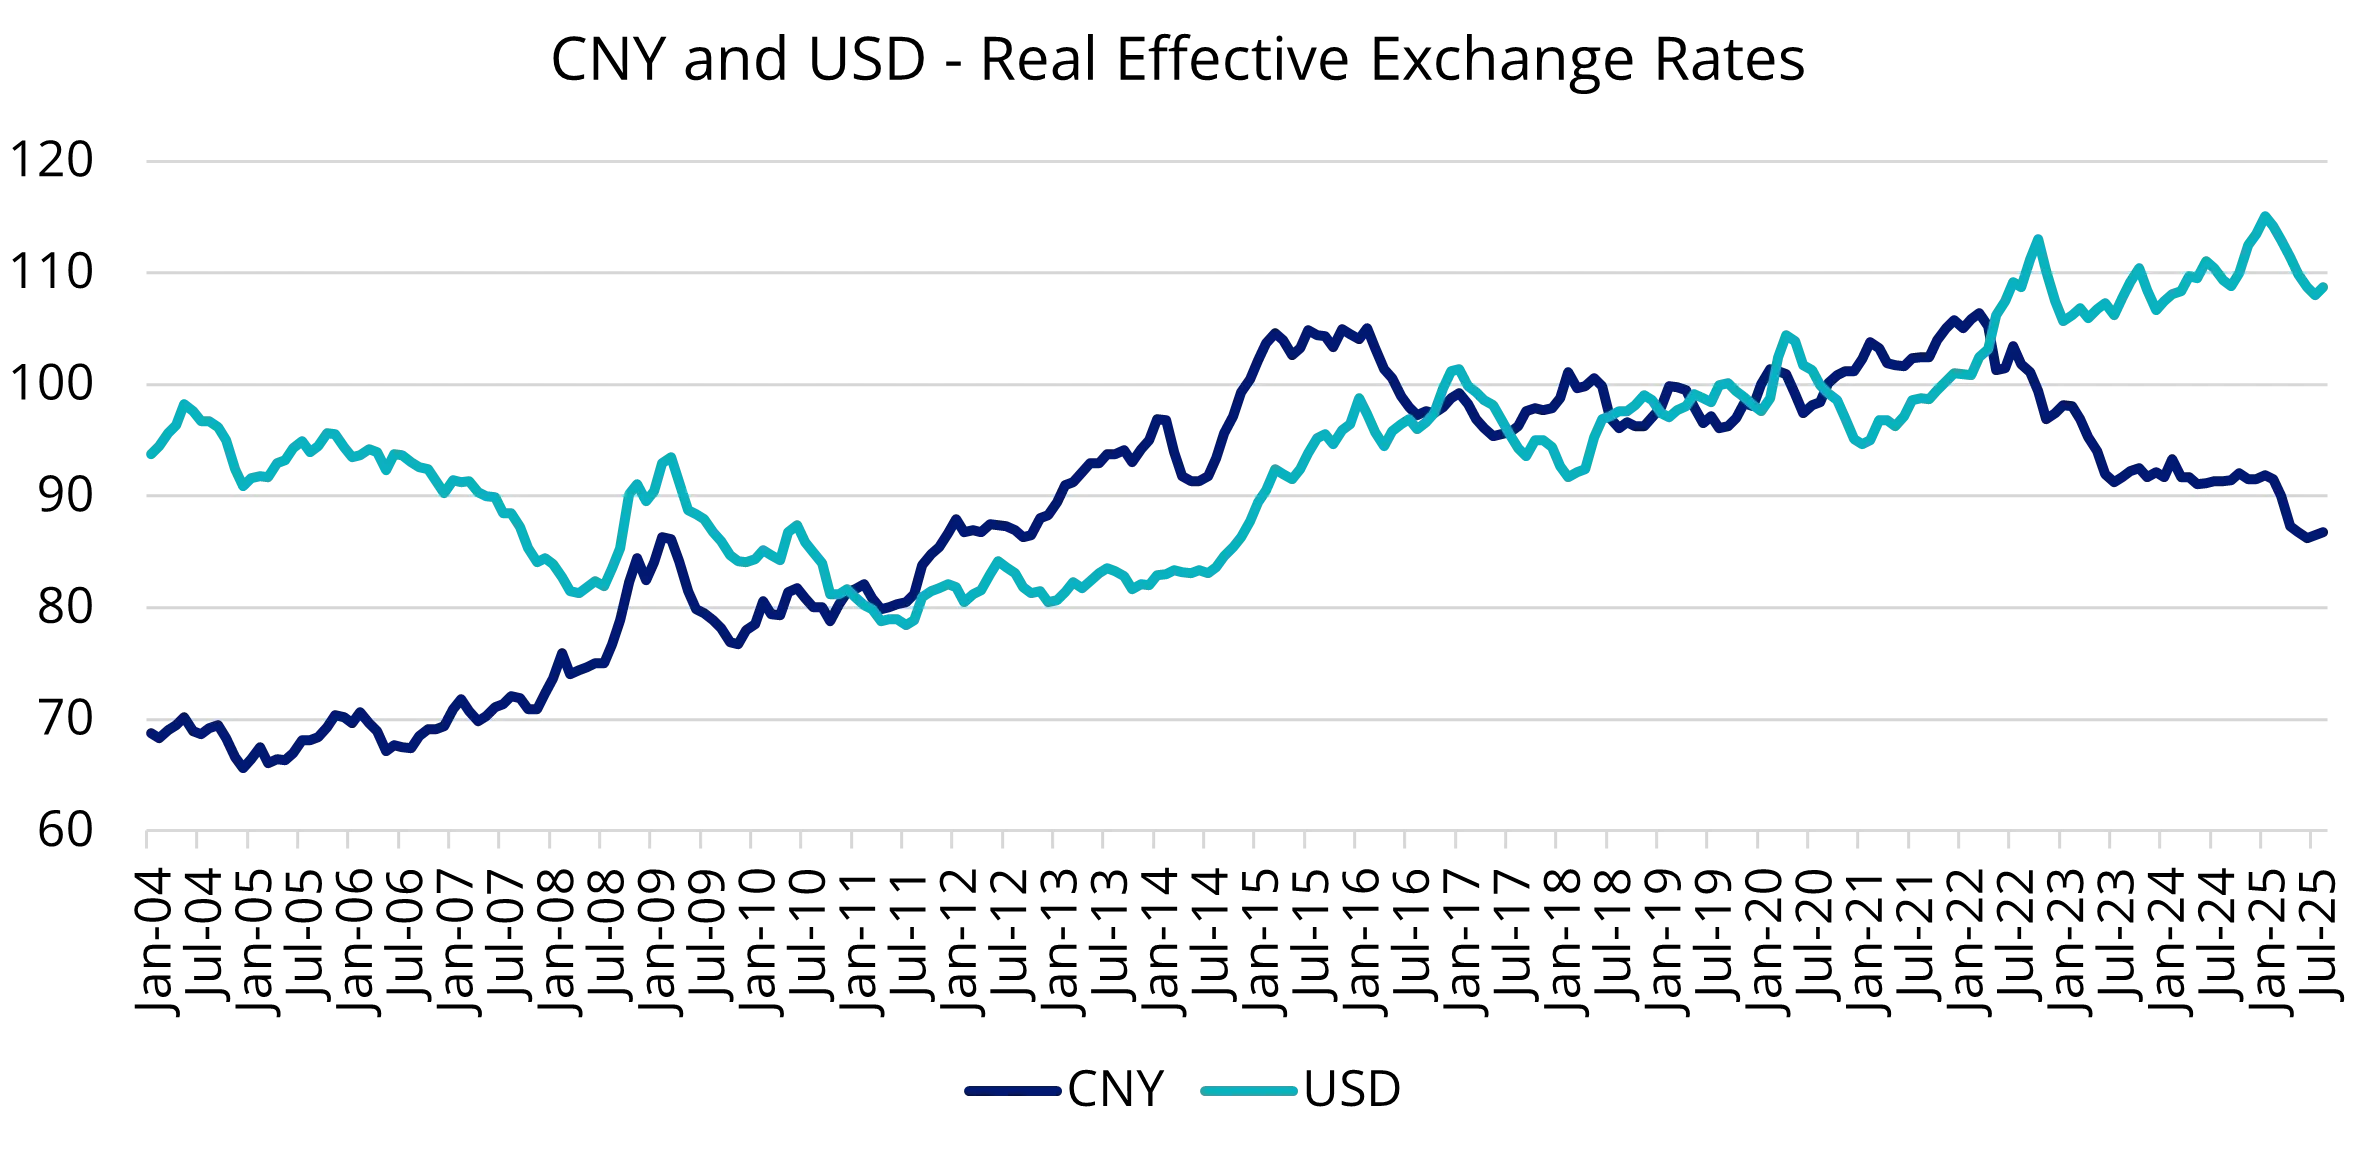
Source: VanEck Research; Bloomberg LP. Data as of August 2025. Not intended as a prediction of future results. For illustrative purposes only. Past performance is not indicative of future performance.
External balance sheets favour; Compelling yields
Net international investment position (NIIP) data show that many emerging market countries, particularly in Asia, are net external creditors, while the US remains a large net debtor. These accumulated surpluses of emerging markets are significant and enhance fundamental quality. In addition, many accumulated surpluses may be re-shored to home or other non-US shores. This dynamic implies either a weaker US dollar or structurally higher US rates; both outcomes are supportive for emerging market bonds.
Chart 5: NIIP projects weaker USD
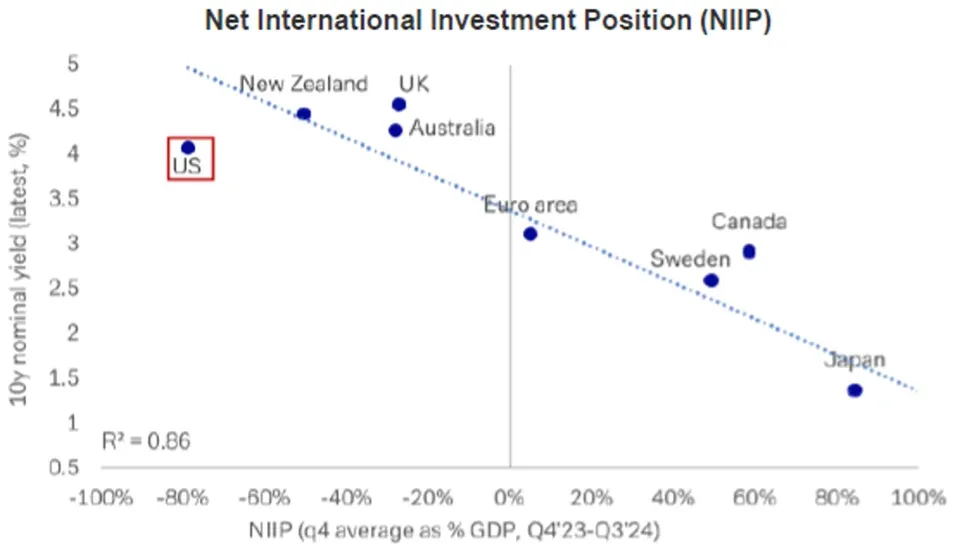
Source: Deutsche Bank. Data as of June 2025. Not intended as a prediction of future results. For illustrative purposes only. Past performance is not indicative of future performance.
In addition, when hedged into Asian currencies, US Treasuries now offer low or unattractive yields, while onshore Asian and emerging markets bonds remain compelling on a relative basis. The chart below shows 30-year government bond yields hedged back into Japanese yen. When Japanese (or other Asian) investors hedge US Treasuries or European government bonds back into their home currency, the hedging cost wipes out most of the yield. As a result, hedged US Treasuries deliver low returns compared with domestic bonds such as Japanese government bonds (JGBs). This highlights a structural shift: for global investors who manage currency risk, holding US Treasuries is no longer compelling, while local Asian bonds look relatively more attractive. The chart also points out that as this reality sinks in, hedging behaviour is evolving, reinforcing capital flows away from USD assets and supporting non-USD bond markets, including emerging market local-currency bonds.
Chart 6: 30-year government bonds hedged back into JPY
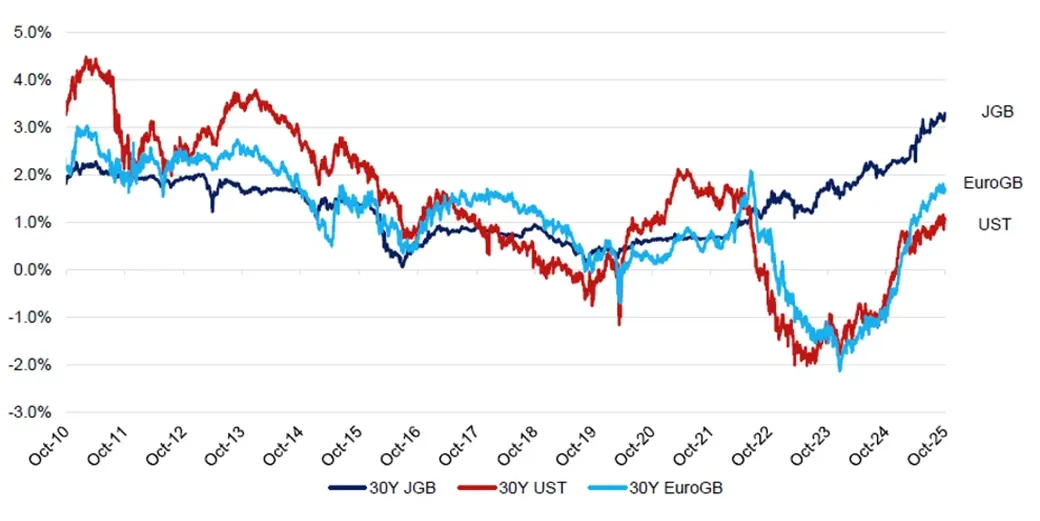
Source: VanEck Research; Bloomberg LP. Data as of October 2025. Past performance is not indicative of future performance.
An allocation to emerging market bonds is supported by the above. It is important to take the right approach.
Why active, blended?
In the past 20 years, local currency was the best performing category within emerging markets bonds for 7 years, while the US dollar (emerging markets sovereign) took the spot for 9 years. A blended approach allows for less extreme results while capturing potential outperformance.
The chart below plots the 12-month rolling return difference between emerging markets US dollar sovereign bonds (EMBIG) and emerging markets local currency bonds (GBI-EM). When the line is above zero, US dollar emerging markets bonds outperformed. When it’s below zero, local currency emerging market bonds outperformed. Over the past 20 years, leadership has rotated frequently and sharply between the two.
This variability means that allocating to only one segment requires strong and often uncertain macro calls. A blended emerging markets bond approach helps smooth outcomes across market cycles, reduces reliance on forecasting currency or rate moves, and allows investors to capture diversified sources of return from both credit and local market dynamics.
Chart 7: EMBIG-GBI EM Total Return differential, (12m rolling, bps)
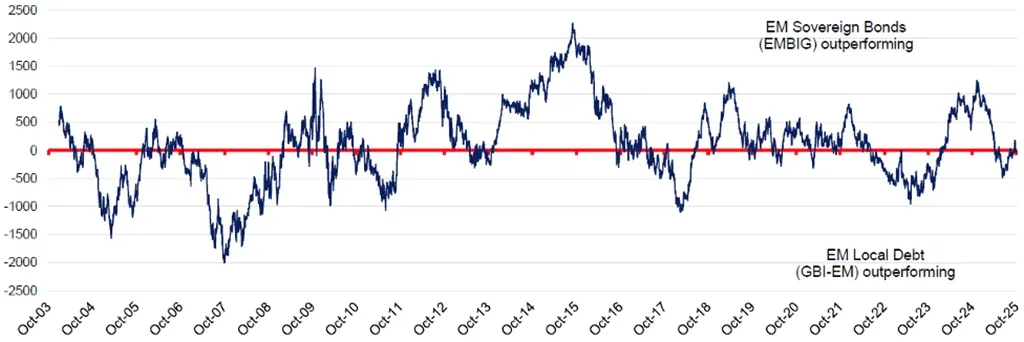
Source: VanEck Research, Bloomberg LP. Data as of October 2025. Past performance is not indicative of future results. EMBIG is J.P. Morgan Emerging Market Bond Index Global Diversified Hedged AUD, GBI-EM is JPMorgan Government Bond Index-Emerging Markets Global Diversified Index. You cannot invest in an Index.
In addition, due to the idiosyncrasies between the nations included in the emerging markets bond universe and the nuances between the different types of bonds available, we think an active, unconstrained, blended approach, like the one employed by the VanEck Emerging Opportunities Active ETF, is an ideal way for investors to access this important asset class.
VanEck’s unconstrained approach offers several benefits, including greater diversification versus approaches limited to only hard or local currency. We believe an optimal portfolio of EM bonds is unconstrained by indices and invests in bonds that offer the best value relative to their fundamentals while actively managing risk.
Key risks
An investment in the Fund carries risks associated with: ASX trading time differences, emerging markets bonds and currencies, bond markets generally, interest rate movements, issuer default, currency hedging, credit ratings, country and issuer concentration, liquidity, fund manager and fund operations. See the PDS and TMD for details.
EBND is likely to be appropriate for a consumer who is seeking capital growth and a regular income distribution, is intending to use the product as a minor or satellite allocation within a portfolio, has an investment timeframe of at least 5 years, and has a very high risk/return profile.


Published: 19 February 2026
Any views expressed are opinions of the author at the time of writing and is not a recommendation to act.
VanEck Investments Limited (ACN 146 596 116 AFSL 416755) (VanEck) is the issuer and responsible entity of all VanEck exchange traded funds (Funds) trading on the ASX. This information is general in nature and not personal advice, it does not take into account any person’s financial objectives, situation or needs. The product disclosure statement (PDS) and the target market determination (TMD) for all Funds are available at vaneck.com.au. You should consider whether or not an investment in any Fund is appropriate for you. Investments in a Fund involve risks associated with financial markets. These risks vary depending on a Fund’s investment objective. Refer to the applicable PDS and TMD for more details on risks. Investment returns and capital are not guaranteed.