Stagflation signs suggest imminent infrastructure rally
Global equity markets have been on a tear since US Liberation Day in early April. Growth-oriented US equities have led the charge, with the S&P 500 up more than 30 per cent. Key drivers for the rally include a raft of US trade deals announced with its key partners – serving to improve policy clarity and confidence - and a strong Q2 US earnings season update led by mega tech.
Meanwhile, investors have seemingly shrugged off the impact of rising geopolitical tensions and US government debt, among other headwinds threatening the US economy. The biggest potential threat is the risk of stagflation (higher inflation and low economic growth). This is an important consideration for investors considering how to best position their portfolios for resilience in the near- to medium-term.
Signs of potential stagflation
There are several economic indicators that suggest a stagflation environment could materialise as a result of Trump’s steep tariffs. Firstly, US ISM services PMI data shows that US services sectors activity in recent months has slowed and is nearing contractionary territory, while prices paid have surged. Last time this happened was in 2021, when inflation spiked and global central banks responded by hiking interest rates.
Chart 1: ISM services activity versus prices paid
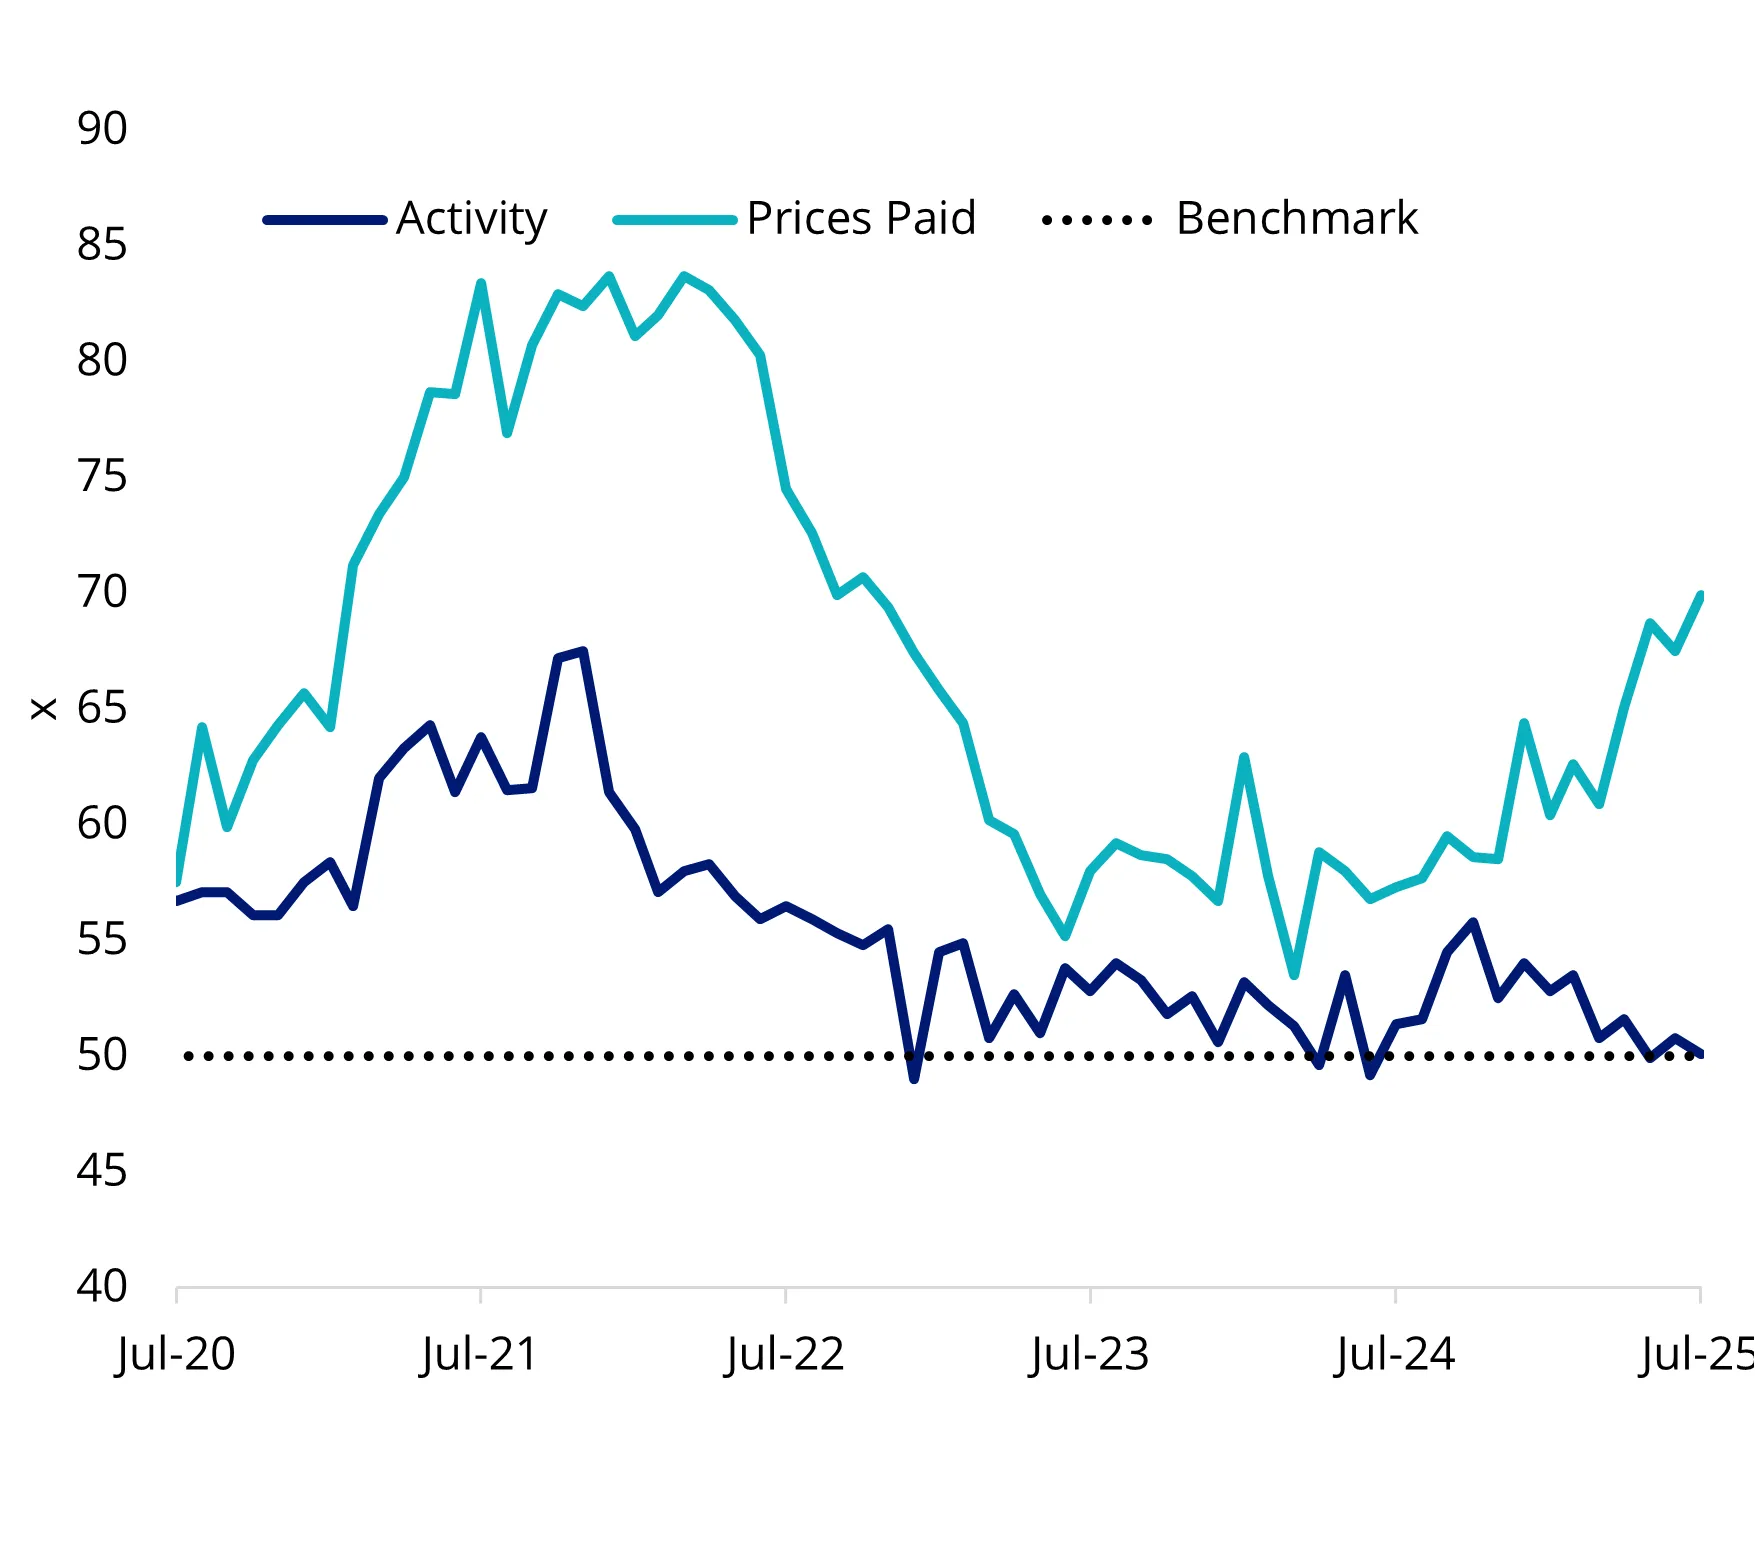
Source: Bloomberg. Above 50 is expanding and below is contracting.
Second, while the US unemployment rate is at 4.2% (based on Bureau of Labor Statistics released in July), low by historical standards, the labour market, and therefore the economic environment, may not be a strong as it seems. The last three months of US employment growth figures were revised down, the weakest since December 2020. The S&P 500 dropped 1.6% following the release of this data, highlighting the vulnerability of the market to downside surprises.
Chart 2: US monthly employment growth
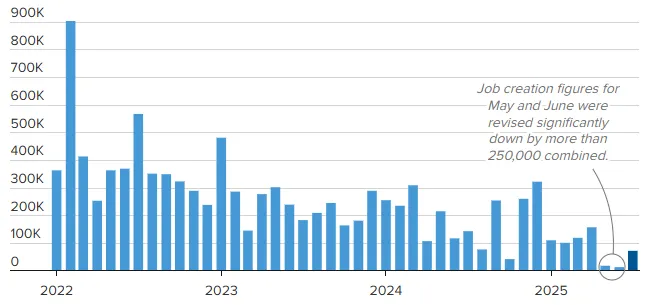
Source: Bloomberg.
Third, the June US CPI print showed an increase in the price of goods, specifically in import dependent/ tariff impacted areas such as household furnishings, supplies and apparel. Given it has only been a few months since the onset of higher tariff rates, there is a real possibility that this trend could exacerbate in the coming months. The US Federal Open Market Committee (FOMC) appeared to agree, albeit not unanimously.
Chart 3: US goods inflation month on month breakdown
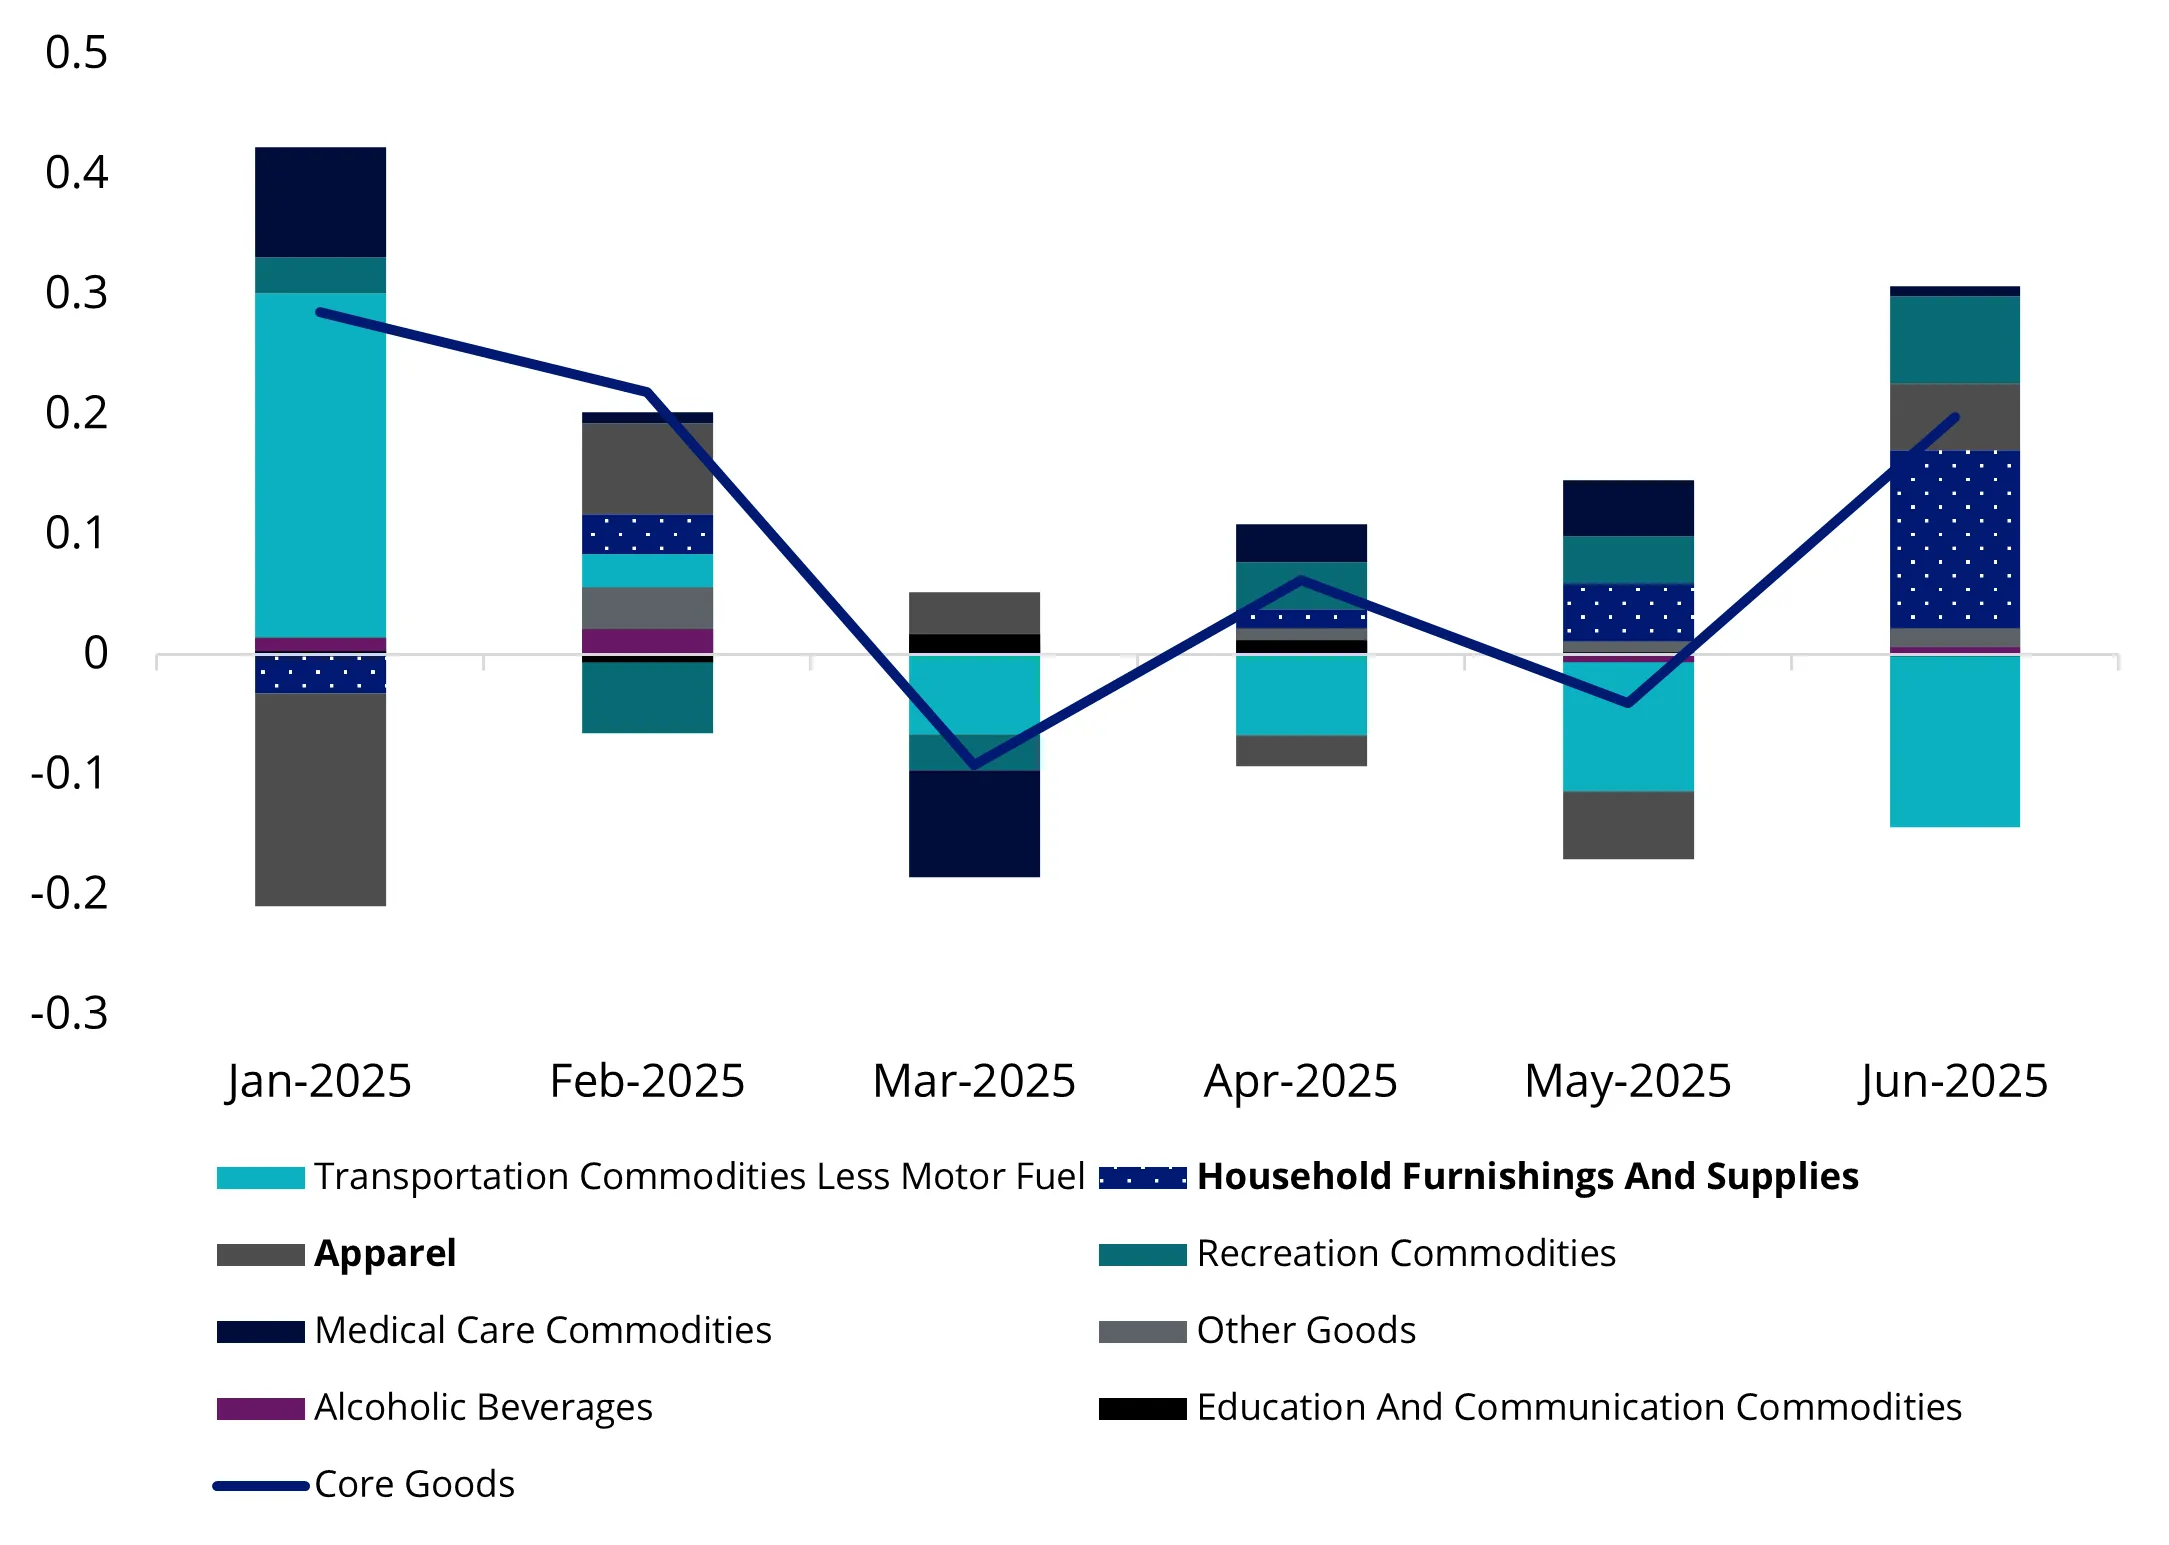
Source: Bloomberg.
FOMC messaging
The FOMC held rates steady for a fifth consecutive meeting in July. yet two members dissented, Michelle Bowman and Christopher Waller, for the first time since the early 1990s.
High inflation and low economic growth environment
Should markets start pricing in a stagflation environment, what can investors consider when positioning their portfolio? Historically, listed infrastructure assets have tended to perform well during stagflationary periods. This dynamic is highlighted in the chart below, which shows that listed infrastructure outperformed broader global equities in two out of the last three higher inflation (US CPI growth year-on-year above 2.5%) and lower growth (US Real GDP growth below 2.0% yearon-year) environments.
Chart 4: Calendar year performance in a low growth/high inflation environment
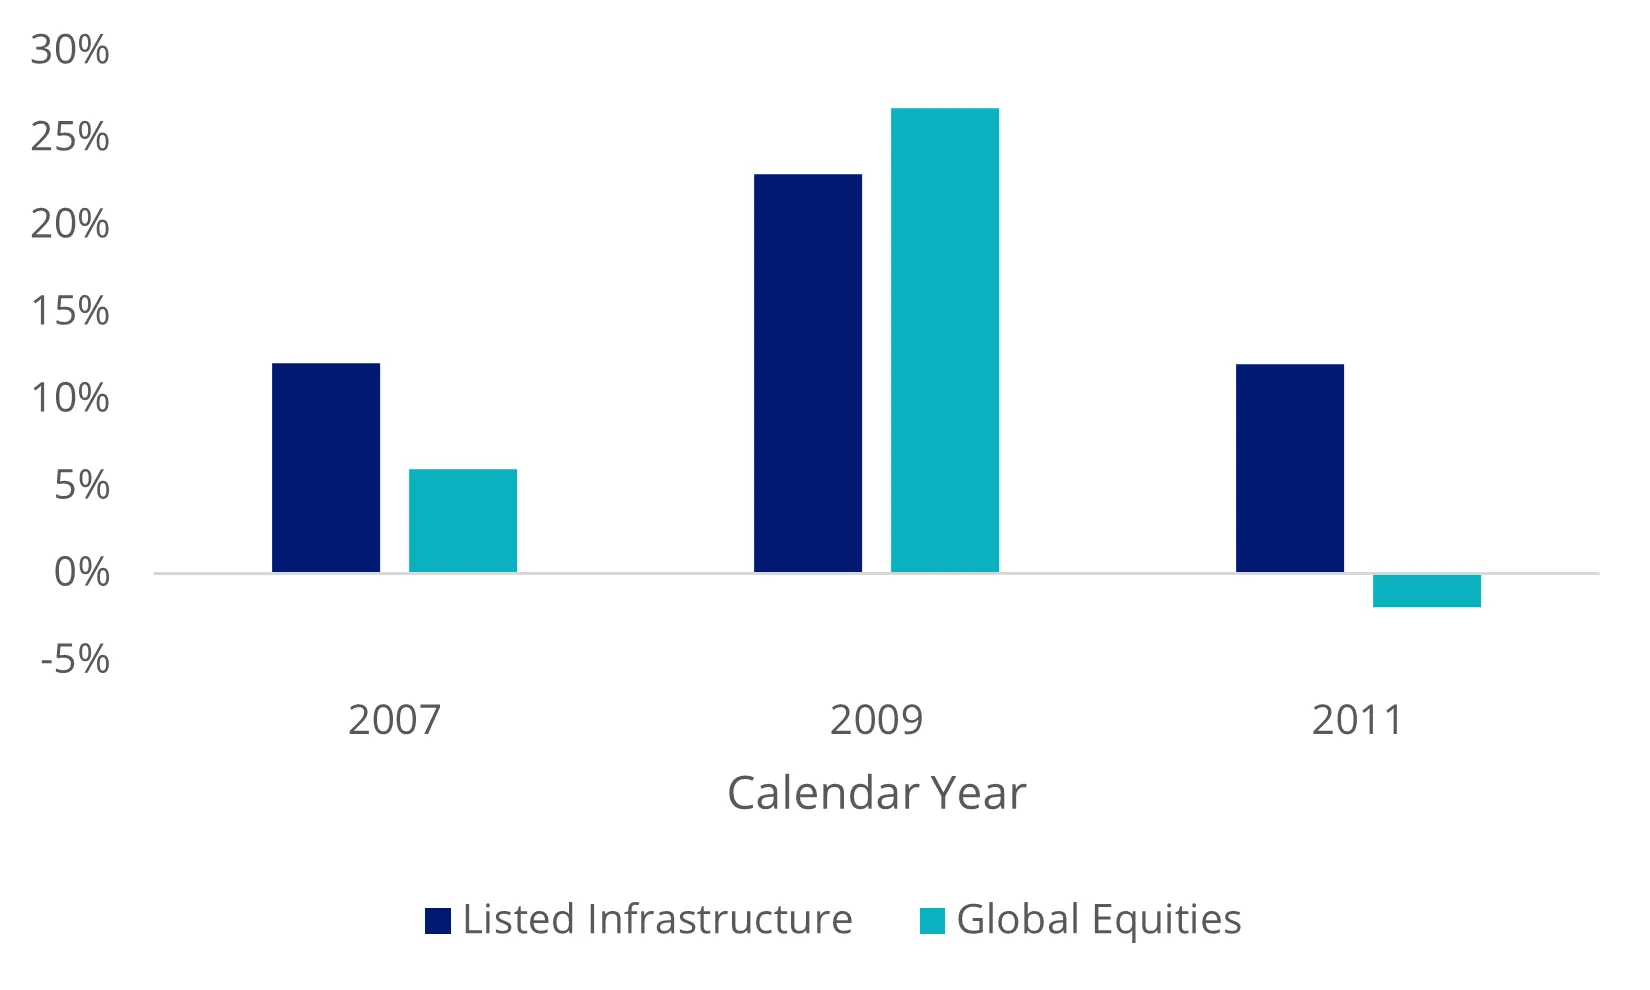
Source: Listed Infrastructure as FTSE Developed Core Infrastructure 50/50 Hedged into Australian Dollars Index, Global Equities as MSCI World AUD Hedged Index.
Listed infrastructure consists of publicly traded companies that own or operate essential assets like toll roads, airports, utilities and telecommunication infrastructure.
An elevated inflation environment tends to benefit some infrastructure companies where contracts are inflation-linked. For example, toll road agreements often allow revenue increases to be passed through at the greater of CPI or a fixed minimum (e.g., CPI or 4%). Additionally, demand for infrastructure is inelastic given it consists of critical services supplied to the population. This means that earnings growth tends to be stable regardless of the economic cycle. Naturally, attracting investor demand they are sought after in economic slowdowns.
Valuations compelling
Listed infrastructure is trading based on enterprise value (EV) relative to earnings before interest, taxes, depreciation, and amortisation (EBITDA) ratio.
Chart 5: Ten years of listed global infrastructure EV/EBITDA
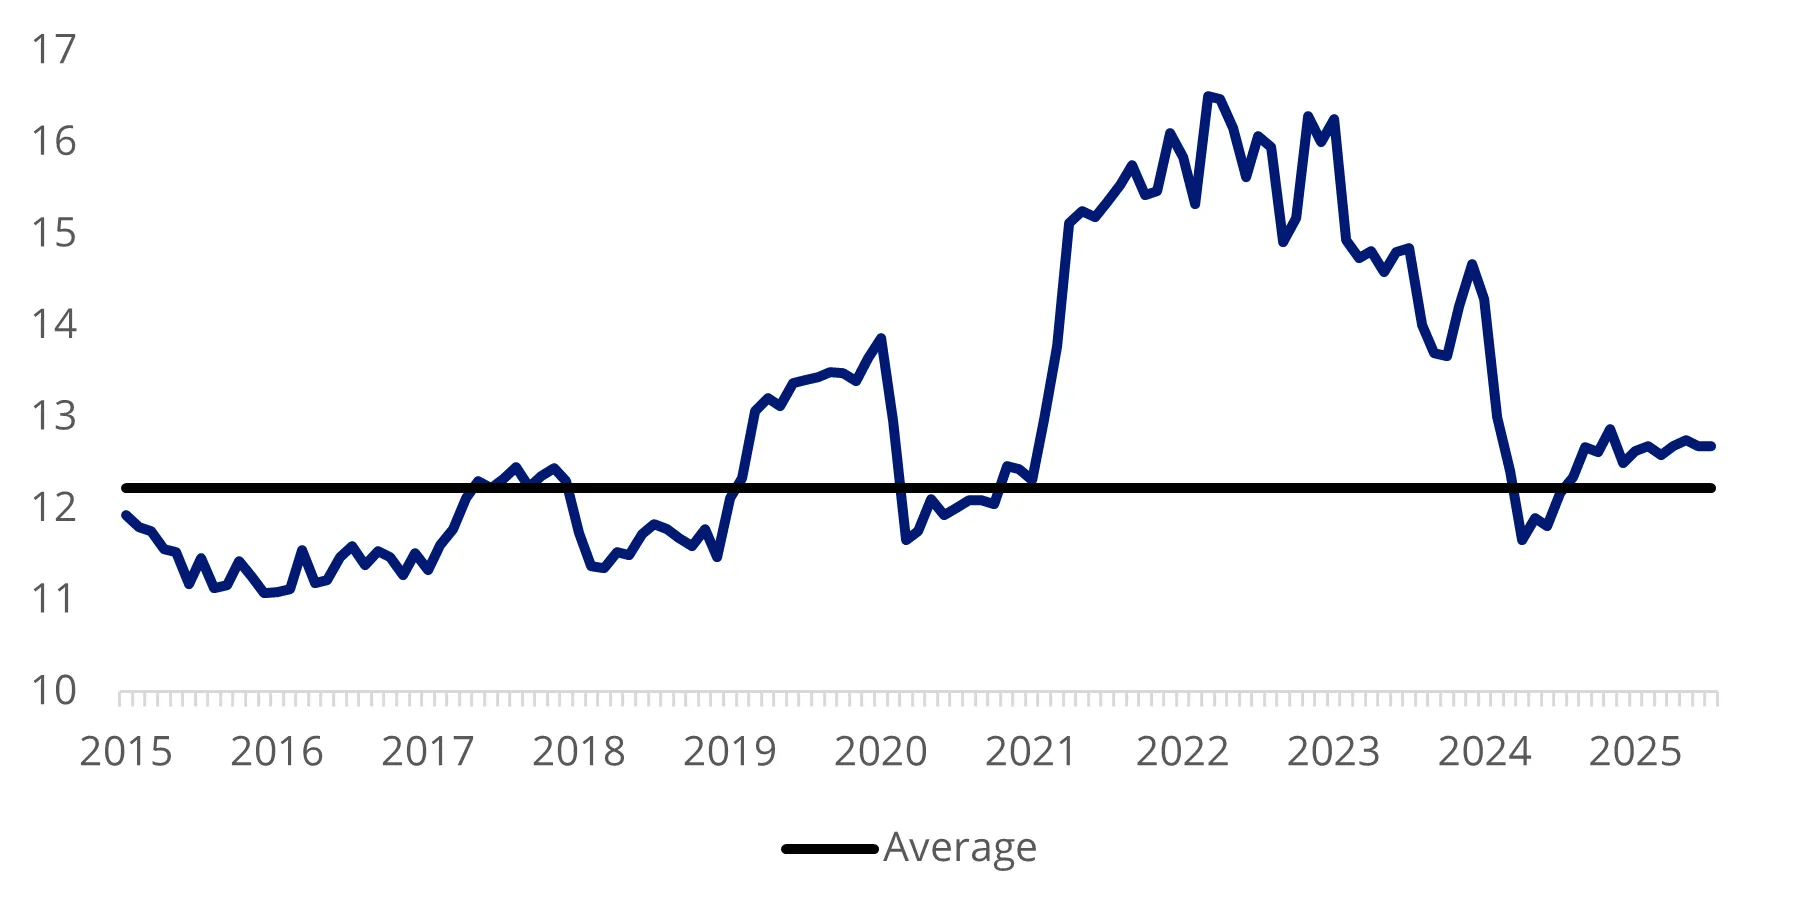
Source: VanEck, FTSE, as at 31 July 2025. Global infrastructure is FTSE Developed Core Infrastructure 50/50 Hedged into Australian Dollars Index.
Big beautiful bill beneficiary
Another tailwind for listed infrastructure is Trump’s Big Beautiful Bill which intends to pave the way for increased fossil fuel production through more tax breaks and reducing red tape. More output means greater demand for gas, electricity utilities, and pipelines – all of which are key listed infrastructure subsectors.
Access to listed global infrastructure
One way to access the listed global infrastructure sector is through the VanEck FTSE Global Infrastructure (AUD Hedged) ETF (IFRA), which offers exposure to a diversified portfolio of 133 global listed infrastructure securities. IFRA tracks the FTSE Developed Core Infrastructure 50/50 Hedged into Australian Dollars Index, which uses sector and stock capping to improve diversification and reduce concentration risk at both a sector and stock level. This index is also used as the global infrastructure benchmark by industry participants including consultants and fund managers.
Key risks: An investment in our global infrastructure ETF carries risks associated with: ASX trading time differences, financial markets generally, individual company management, industry sectors, foreign currency, currency hedging, country or sector concentration, political, regulatory and tax risks, fund operations, liquidity and tracking an index. See the VanEck FTSE Global Infrastructure (AUD Hedged) ETF PDS and TMD for more details.


Published: 18 August 2025
Any views expressed are opinions of the author at the time of writing and is not a recommendation to act.
VanEck Investments Limited (ACN 146 596 116 AFSL 416755) (VanEck) is the issuer and responsible entity of all VanEck exchange traded funds (Funds) trading on the ASX. This is general advice only and does not take into account any person’s financial objectives, situation or needs. The product disclosure statement (PDS) and the target market determination (TMD) for all Funds are available at vaneck.com.au. You should consider whether or not any Fund is appropriate for you. Investments in a Fund involve risks associated with financial markets. These risks vary depending on a Fund’s investment objective. Refer to the applicable PDS and TMD for more details on risks. Investment returns and capital are not guaranteed.