Small caps win the earnings season after-party
Mid-caps led by earnings beats, but higher price target revisions post-season for the ASX’s little league reflects a bright economic outlook.
ASX’s reporting season has wrapped, and it was one like no other, not because of the results, but rather the share price swings after the results.
Looking at the recently completed Australian earnings season, in aggregate, most companies (62%) reported in-line results, with 22% delivering beats and slightly outpacing misses (16%).
Market reactions did not reflect this ‘solid’ result. One in five reporting companies moved more than 10% after they announced their results. Media reports highlighted the unusual price reactions:
AFR - Blue-chip gloom sets in after ‘once-in-a-generation’ profit season
Bloomberg – Profit outlook drags Australia stocks after rocky results season
Chart 1: Australian August 2025 earnings season breakdown
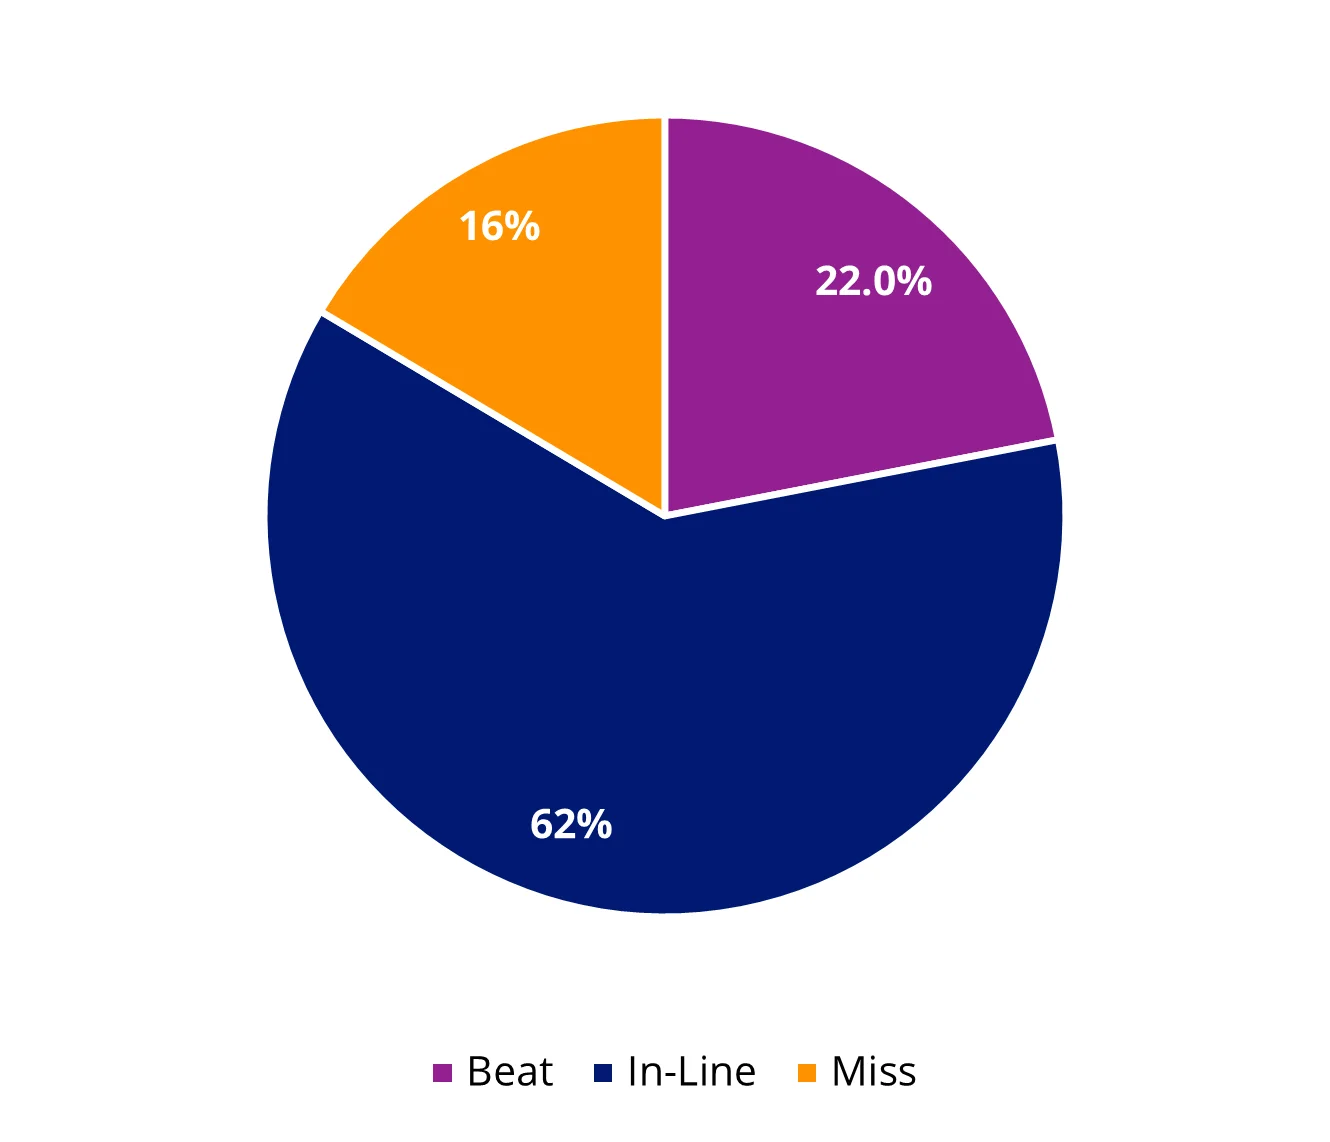
Source: VanEck, Bloomberg. Data as at 29 August 2025.
Analysing the results on a market-weighted basis, mid-cap companies, as represented by the S&P/ASX MidCap 50 Index, led earnings beats this season, with a net-beat rate of 2.9% versus the S&P/ASX 200 Index’s 1.15%.
Small caps, as represented by the companies in the S&P/ASX Small Ordinaries (Small Ords), performed the worst from an earnings per share (EPS) surprise perspective.
What is interesting is that after the earnings season, an analysis of the consensus 12-month price targets shows that small caps sit highest.
Chart 2 & 3: EPS surprises and valuations by size |
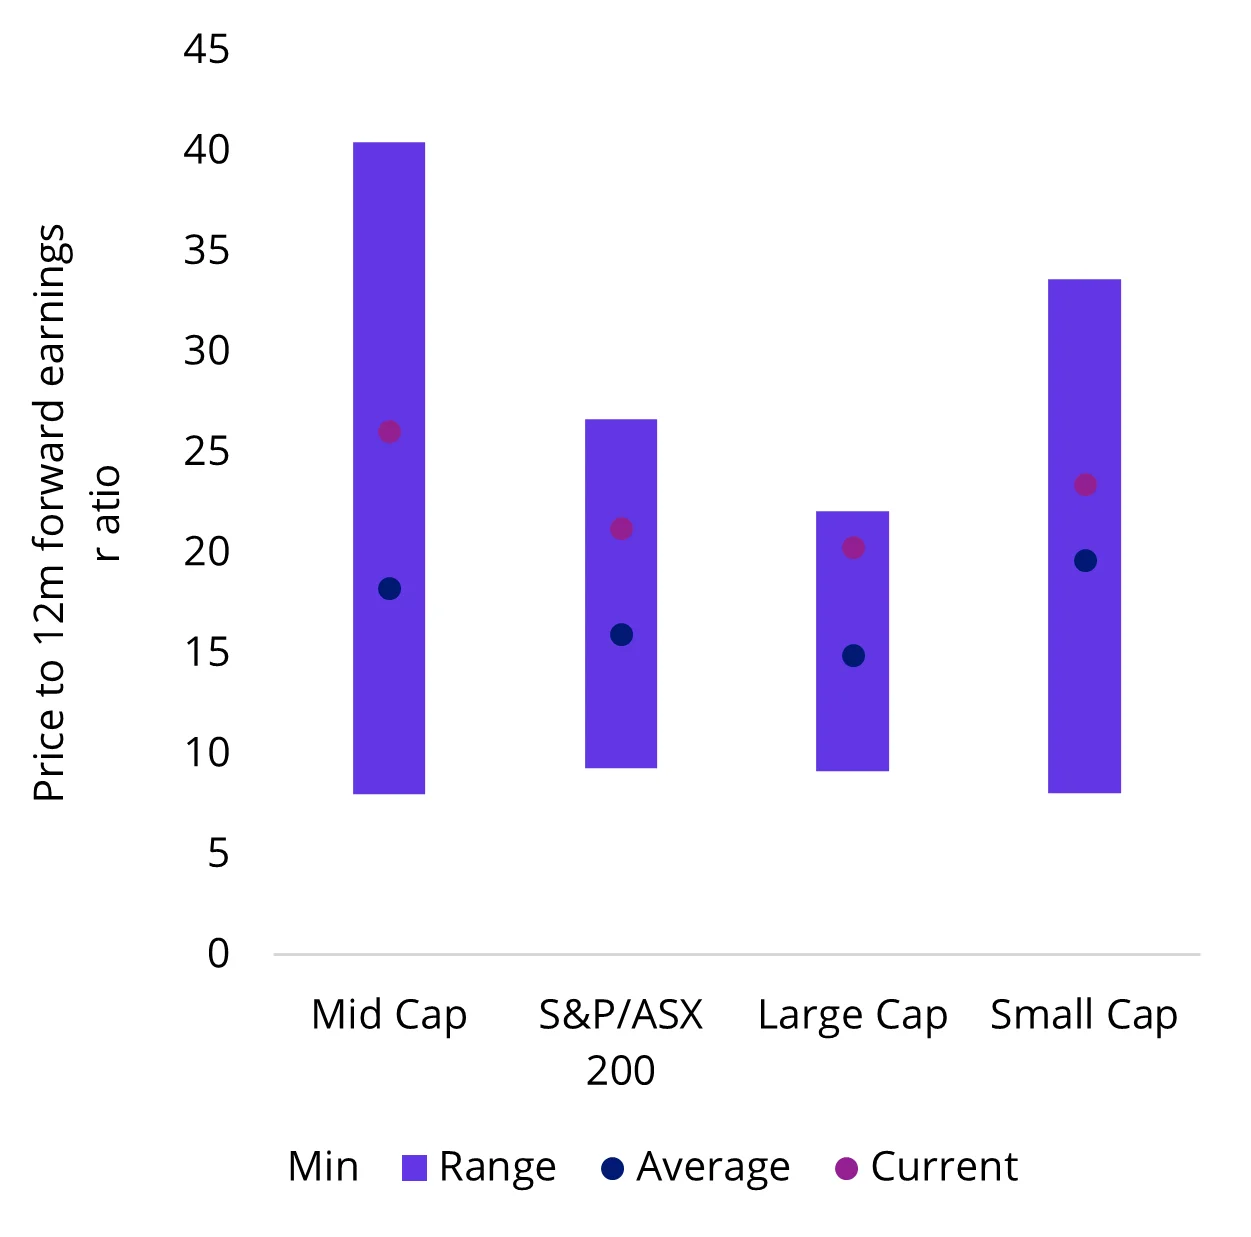 |
Source: VanEck. Bloomberg. Large cap is S&P/ASX 20 Index. Mid cap is S&P/ASX Midcap 50 Index. Small cap is S&P/ASX Small Ordinaries Index.
But small companies still have room to grow
The outlook for small companies is brighter. The RBA is starting to cut rates, lowering capital costs. The economic outlook has led to small companies having the highest price-target revisions, signalling the market’s conviction in Australian small caps.
Chart 4: 12-month consensus price target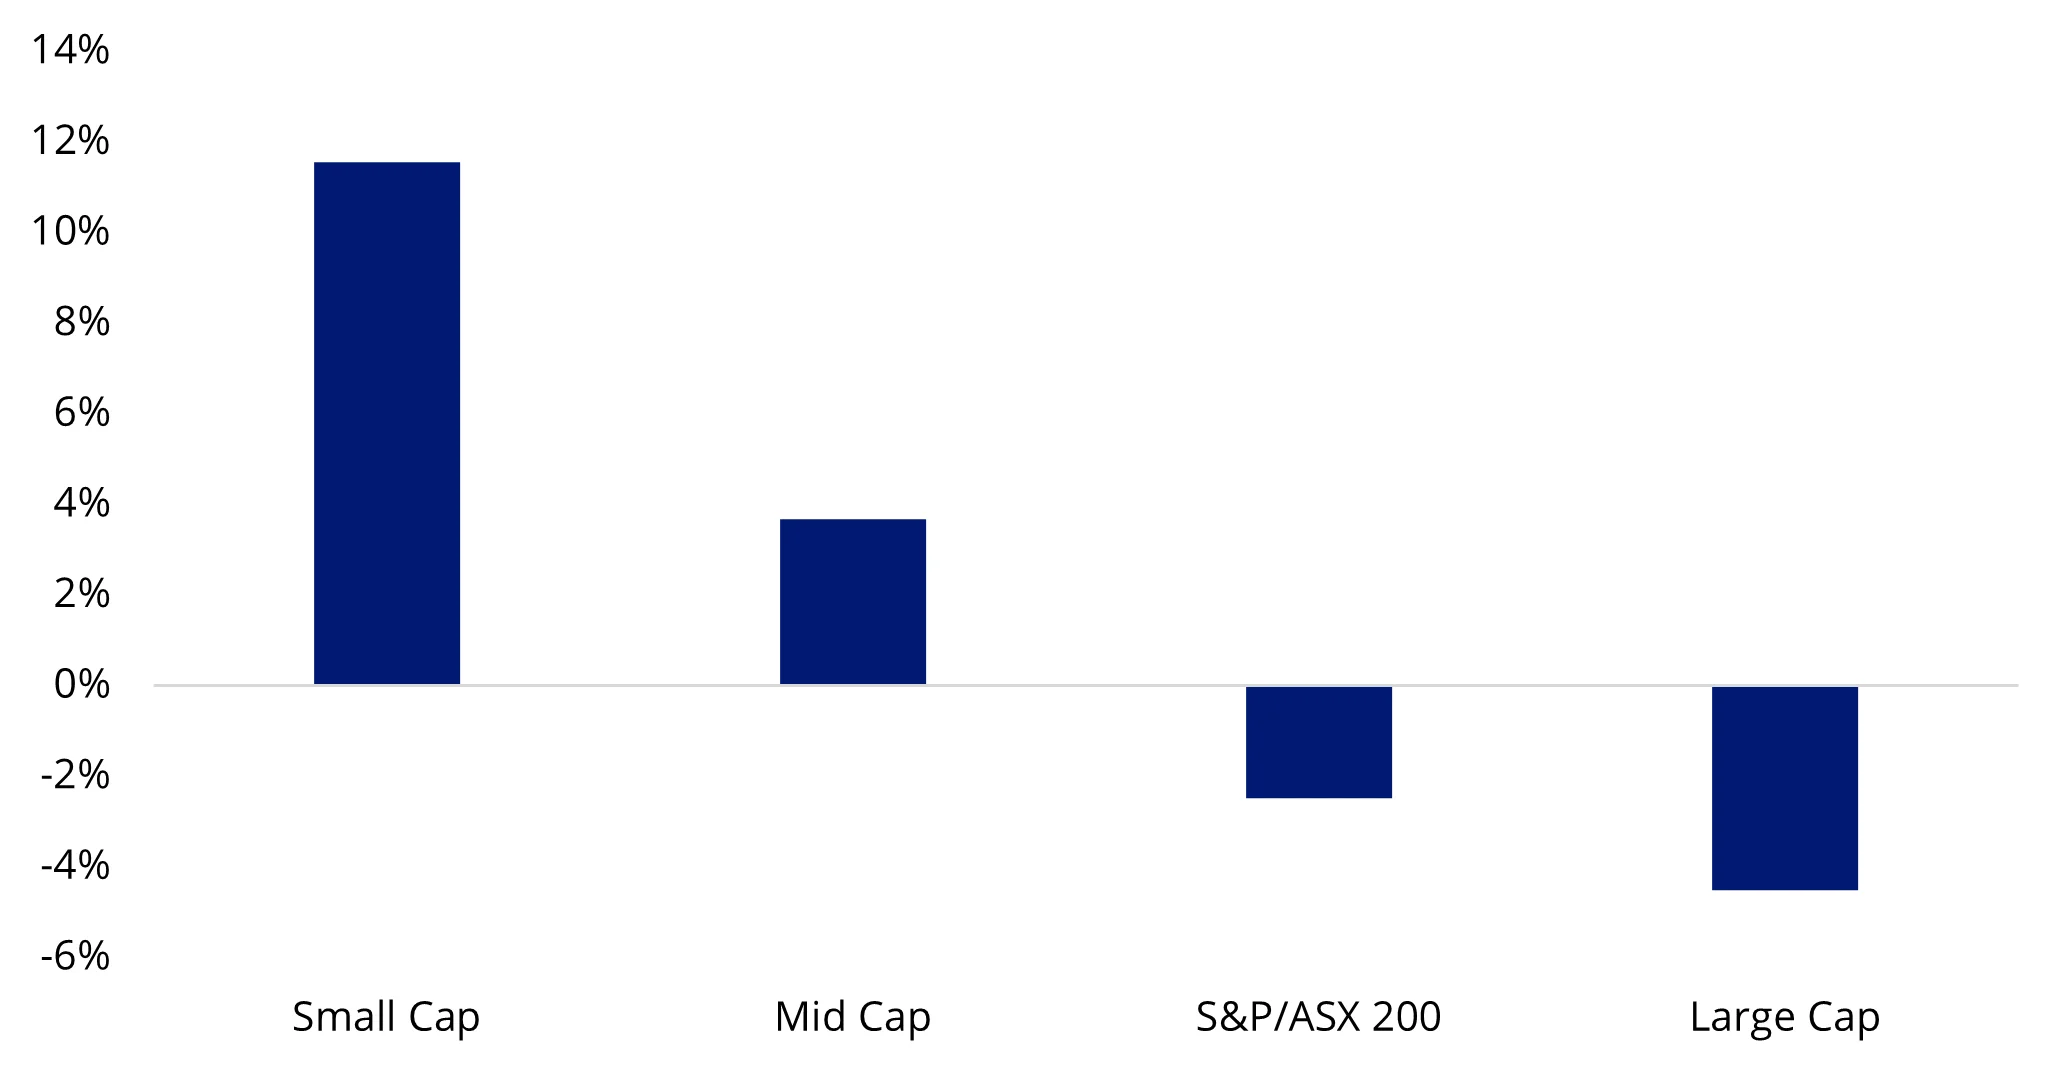
Source: VanEck, Bloomberg. 4 September 2025. Large cap is S&P/ASX 20 Index. Mid cap is S&P/ASX Midcap 50 Index. Small cap is S&P/ASX Small Ordinaries Index. Price target are not guarantees. Small Cap price target should not be considered a reliable indicator of the future performance of MVS. You cannot invest in an index.
Therefore, an allocation to small companies makes sense for Australian investors.
In the past, and during this type of cycle, small caps have offered more upside than large caps because they have fallen further, or not kept pace with large caps as GDP growth slowed. And that has been true during the most recent period of Australia’s economic sluggishness. Australian small companies have been underperforming their large-cap peers. If consensus is to be believed, Australian small companies could be poised for a bounce.
The size factor in Australia
There is no doubt Australians love an underdog and as investors, we invest that way. According to a review of Morningstar data, 12% of all money invested in Australian equity funds (ex ETFs) in Australia are invested in small companies funds (as at 30 June 2025). The lure of small companies is that they have more growth potential than larger companies. The attraction is supported by academic research. In 1981, Banz* found that “smaller firms (firms with low market capitalisation) have higher risk-adjusted returns than large firms on average”.
But Australian investors in small companies, have not experienced what the research suggested. The Small Ords has delivered lower cumulative returns relative to the broader, large-cap dominated S&P/ASX 200 Index over the long term.
Chart 5: The Small Ords have underperformed its large cap counterpart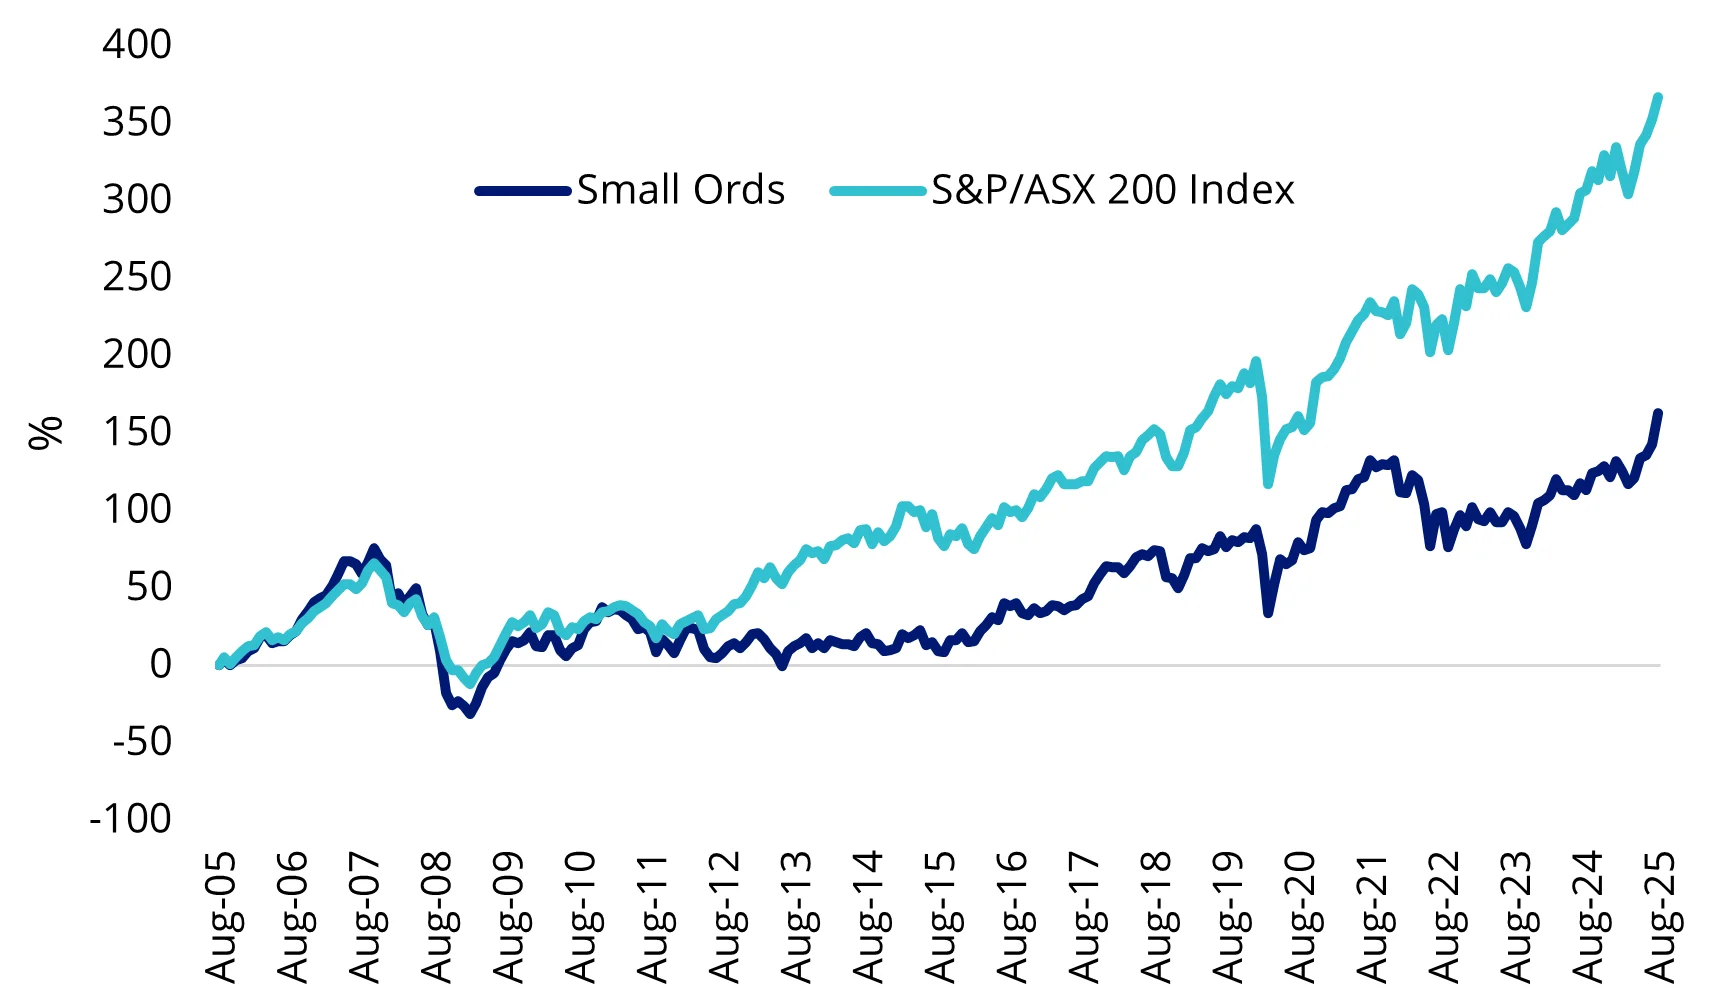
Source: Morningstar Direct, 20 years, 1 September 2005 to 31 August 2025. Past performance is not indicative of future performance. You cannot invest in an index.
We think there are limitations to the size effect in Australia.
- The size of the market and size of companies are too small. The total market cap of the Small Ords is only ~$380 billion.
- Many of the companies in the Small Ords are in their infancy or start-up phase i.e. the extreme risky part of the business cycle.
- The Small Ords includes a larger percentage of explorers and unprofitable resource companies.
- The revenues of Australian small caps are closely aligned with the country’s economic cycle
That is not to say that you shouldn’t invest in Australian small companies. All of the large caps on the ASX were indeed once small caps. This is where being selective can be key. Many active managers have been able to outperform the Small Ords Index and provide Australian investors with exposure to the size effect. Some of the reasons they have been successful are:
- The lack of research coverage means opportunities may have gone unnoticed.
- As information is not readily available, there are mispricing opportunities in small companies i.e. the market is inefficient.
- Diversify by investing in Australia’s emerging opportunities and sectors that are not well represented by the index.
Passive innovations
In 2015, we launched the first smart beta Australian small companies ETF, VanEck Small Companies Masters ETF (MVS). MVS is a concentrated small companies portfolio that has the potential to outperform the Small Ords and thus give Australian investors a low-cost, ‘passive’ exposure to Australian small companies.
Innovations in index design allowed us to change MVS’s index in September 2024 with the intention to better exploit the inefficiencies of the Small Ords.
MVS now tracks the MarketGrader Australia Small Cap 60 Index. The index screens companies using a growth at a reasonable price (GARP) lens and then includes those with the highest earnings yield.
MVS successfully navigated the past reporting period. If we add MVS to the EPS surprise chart, its results stand in contrast to the broader Australian small-cap universe.
Chart 6: EPS surprises by size and MVS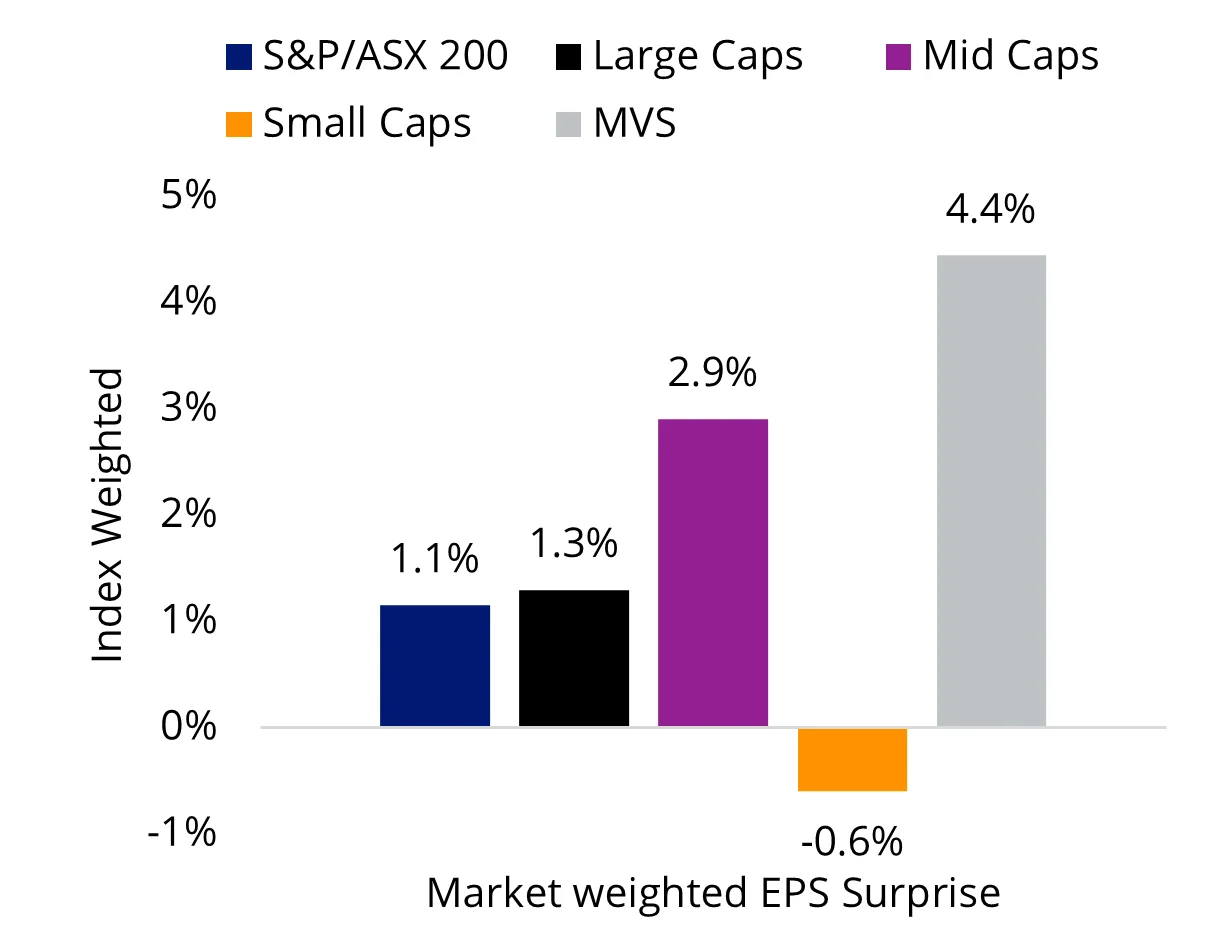
Source: VanEck, Bloomberg. Large cap is S&P/ASX 20 Index. Mid cap is S&P/ASX Midcap 50 Index. Small cap is S&P/ASX Small Ordinaries Index.
Reflecting this, MVS has had relatively strong performance since the beginning of the year, noting that past performance should not be relied upon for future performance.
Table 1: MVS Trailing performance to 31 August 2025
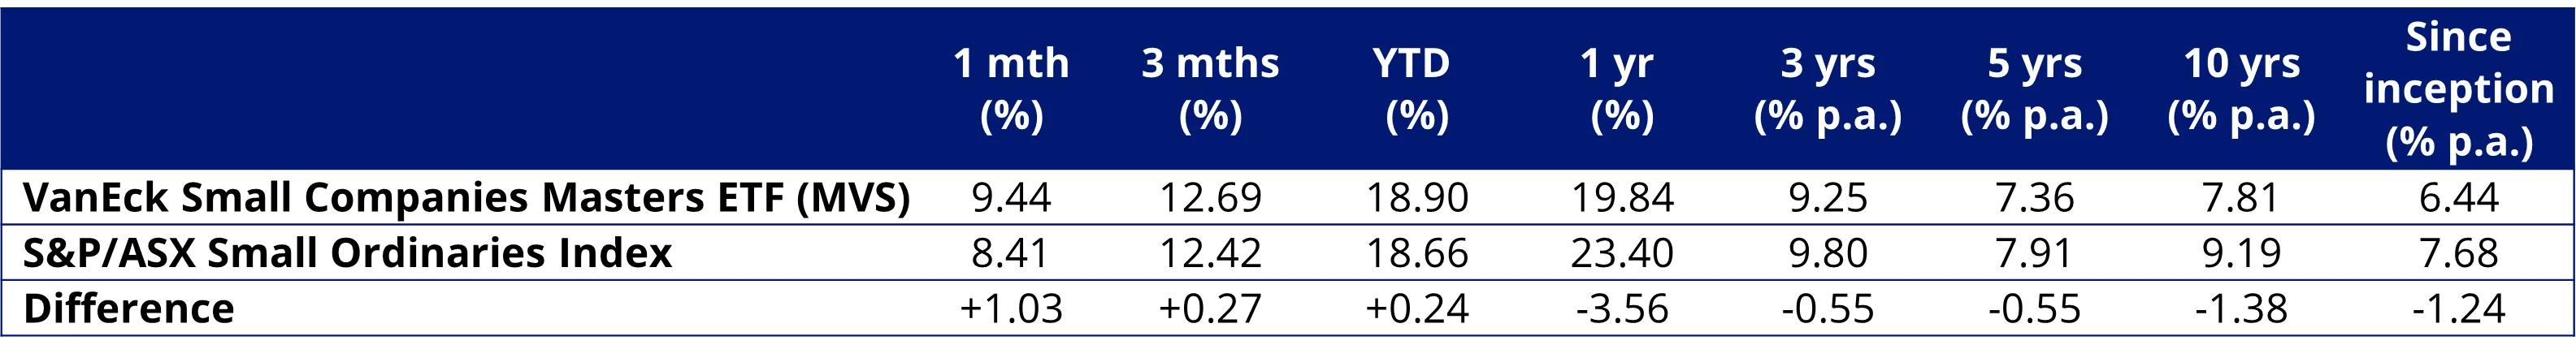
MVS Inception date is 26 May 2015. Effective 23 September 2024, MVS’ reference index changed from MVIS Australia Small-Cap Dividend Payers Index to the MarketGrader Australia Small Cap 60 Index with a change to the investment objective. A copy of the factsheet is here.
Source: Morningstar Direct, VanEck. The table above shows past performance of MVS and of the S&P/ASX Small Ordinaries. You cannot invest directly in an index. Results are calculated to the last business day of the month and assume immediate reinvestment of distributions. MVS results are net of management fees and other costs incurred in the fund, but before brokerage fees and bid/ask spreads incurred when investors buy/sell on the ASX. Returns for periods longer than one year are annualised. Past performance is not a reliable indicator of future performance. The S&P/ASX Small Ordinaries Index (“Small Ords”) is shown for comparison purposes as it is the widely recognised benchmark used to measure the performance of the 200 ASX-listed companies included in the S&P/ASX 300 but not in the S&P/ASX 100, weighted by market capitalisation. The MarketGrader Small Cap 60 Index measures the performance of a portfolio of 60 small-cap companies, 60 Australian small companies with the best growth at a reasonable price (GARP) attributes and the highest earnings yield at rebalance. It has fewer securities and different industry allocations than the Small Ords. ‘Click here for more details’
A longer history of the new GARP approach adopted by MVS’s Index is presented in the table below. Noting, of course, that the past performance of the index should not be relied upon as an indication of future performance of MVS.
Table 2: Modelled index performance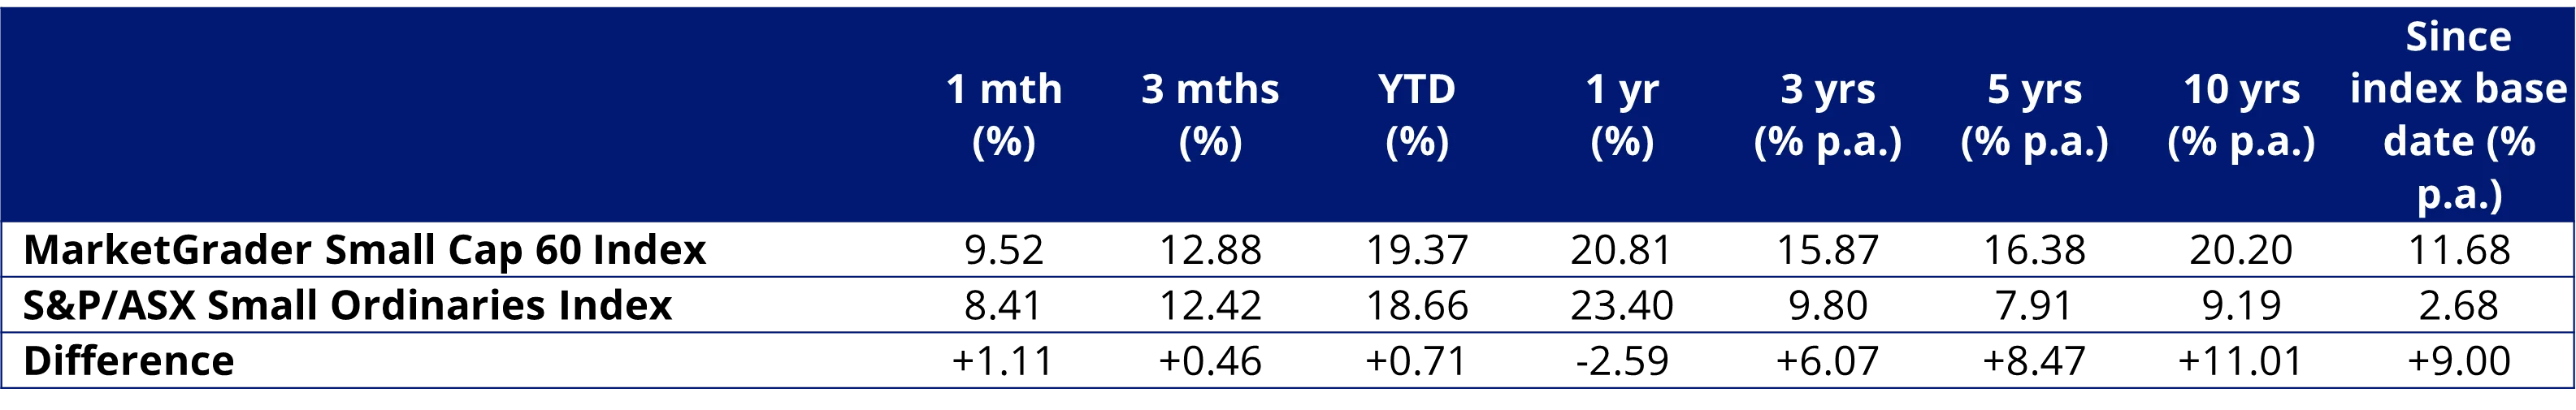
Source: Morningstar, as at 31 August 2025. MarketGrader Australia Small Cap 60 Index base date is 31 December 2007. The MarketGrader Australia Small Cap 60 Index was launched on 30 August 2024. Data prior to the launch date is back-tested. You cannot invest directly in an index. Past performance of the index is not a reliable indicator of future performance of MVS.
The S&P/ASX Small Ordinaries Index (“Small Ords”) is shown for comparison purposes as it is the widely recognised benchmark used to measure the performance of the 200 ASX-listed companies included in the S&P/ASX 300 but not in the S&P/ASX 100, weighted by market capitalisation. The MarketGrader Small Cap 60 Index measures the performance of a portfolio of 60 small-cap companies, 60 Australian small companies with the best growth at a reasonable price (GARP) attributes and the highest earnings yield at rebalance. It has fewer securities and different industry allocations than the Small Ords. ‘Click here for more details’
Key risks
An investment in the ETF carries risks. These include risks associated with financial markets generally, individual company management, industry sectors, stock and sector concentration, fund operations and tracking an index. See the VanEck Small Companies Masters ETF PDS and TMD for more details.
MVS is likely to be appropriate for a consumer who is seeking capital growth and a regular income distribution, is intending to use the product as a minor or satellite allocation within a portfolio, has an investment timeframe of at least 5 years, and has a high risk/return profile.


Published: 17 September 2025
Any views expressed are opinions of the author at the time of writing and is not a recommendation to act.
VanEck Investments Limited (ACN 146 596 116 AFSL 416755) (VanEck) is the issuer and responsible entity of all VanEck exchange traded funds (Funds) trading on the ASX. This information is general in nature and not personal advice, it does not take into account any person’s financial objectives, situation or needs. The product disclosure statement (PDS) and the target market determination (TMD) for all Funds are available at vaneck.com.au. You should consider whether or not an investment in any Fund is appropriate for you. Investments in a Fund involve risks associated with financial markets. These risks vary depending on a Fund’s investment objective. Refer to the applicable PDS and TMD for more details on risks. Investment returns and capital are not guaranteed.MVS tracks the MarketGrader Australian Small Cap 60 Index. "MarketGrader" And “MarketGrader Australian Small Cap 60 Index” are trademarks of MarketGrader.com Corporation. MarketGrader does not sponsor, endorse, sell or promote the Fund and makes no representation regarding the advisability of investing in the Fund. The inclusion of a particular security in the Index does not reflect in any way an opinion of MarketGrader or its affiliates with respect to the investment merits of such security.