Australian equities well worth the weight
At the beginning of 2025, Australian investors looking in the rear-view mirror1 would have seen a year of basking in “American exceptionalism”, reflected by the healthy annual returns of 37.21% for the S&P 500. Conversely, the S&P/ASX 200 returned 11.44%.
In the year to date, however, the story has been markedly different. The S&P 500 (in Australian dollar terms) has fallen 1.98%, and the equity risk premium is negative. The equity risk premium is a calculation that represents the extra return investors can expect investing in shares relative to risk-free asset such as government bonds. It is calculated as Earnings Yield i.e. Earnings per Share / Price-to-Earnings less 10-year government bond yields and is crucial to the likes of the Capital Asset Pricing Model (CAPM) to determine the cost of equity.
The negative risk premium in US equities does not bode well for the expected future risk-reward outcome. Furthermore, the ongoing murkiness surrounding US de-dollarisation or devaluation continues. One shared view is that asset owners are tilting away from US assets.
Meanwhile, the equity risk premium for Australian equities is positive.
Table 1: Equity risk premium – US and Australian equities
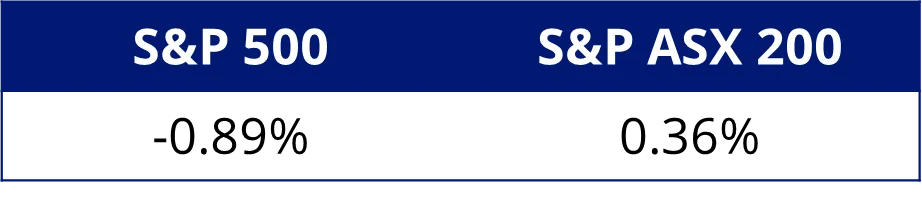
Source: FactSet, as at 21 May 2025.
In the year to date, the S&P/ASX 200 has risen 3.79% (to 20 May 2025). The Commonwealth Bank’s headline-grabbing share price rise has driven the returns of many Australian equity portfolios – comprising over 10% of the benchmark S&P/ASX 200, its share price rise of around 14% since the start of the year has helped lift the overall share market index by 3.8%. (returns to 20 May 2025, source FactSet).
Despite CBA soaring to record highs, taking a pure beta approach, i.e. tracking the S&P/ASX 200, means potentially missing out on more upside that could be on offer in Australian equities. With recent interest rate cuts, we believe it will be important, for the rest of 2025, to have meaningful exposure to those companies that are more likely to achieve growth beyond the market, or be takeover targets, i.e. have exposure beyond mega-caps.
We saw this recently when Bank of Queensland’s (BOQ) share price lifted on soaring profits and a boosted dividend. Despite being in the S&P/ASX 200, funds tracking this index would not have seen much of a lift, given BOQ represents a meagre 0.17% of the overall index.
In the VanEck Australian Equal Weight ETF (MVW), which provides a broader exposure across the capitalisation and sector spectrum, BOQ is 1.42% of the portfolio. MVW’s investors, therefore, benefited more from BOQ’s price growth.
MVW is designed to be a core Australian equities portfolio construction solution that can be deployed to de-risk and diversify, with no one security or sector dominating, thus providing a more balanced exposure to Australia’s economy.
With Australia’s biggest company, CBA, continuing to perform strongly, it would make sense to assume MVW would be underperforming the benchmark, as it only has 1.5% exposure to CBA vs 10% exposure in the S&P/ASX 200.
However, MVW provides a broader exposure across the capitalisation and sector spectrum, which has seen it return 5.82% in the year to date (returns to 21 May 2025), outperforming the S&P/ASX 200’s 3.79%.
MVW has benefited from the growth of stocks such as Evolution Mining (+70.5% YTD), Bluescope Steel (+28.6% YTD) and Medibank Private (+27.6% YTD), all of which have outperformed CBA and the broader market. MVW, as it is equally weighted, has a more meaningful exposure to these companies than a portfolio that tracks the S&P/ASX 200 or S&P/ASX 300 indices. The three companies noted above represent less than half a percent of the S&P/ASX 200, so they cannot meaningfully contribute to the return, whereas MVW has three times more exposure to these stocks.
Table 2: MVW Top 5 Contributors to return
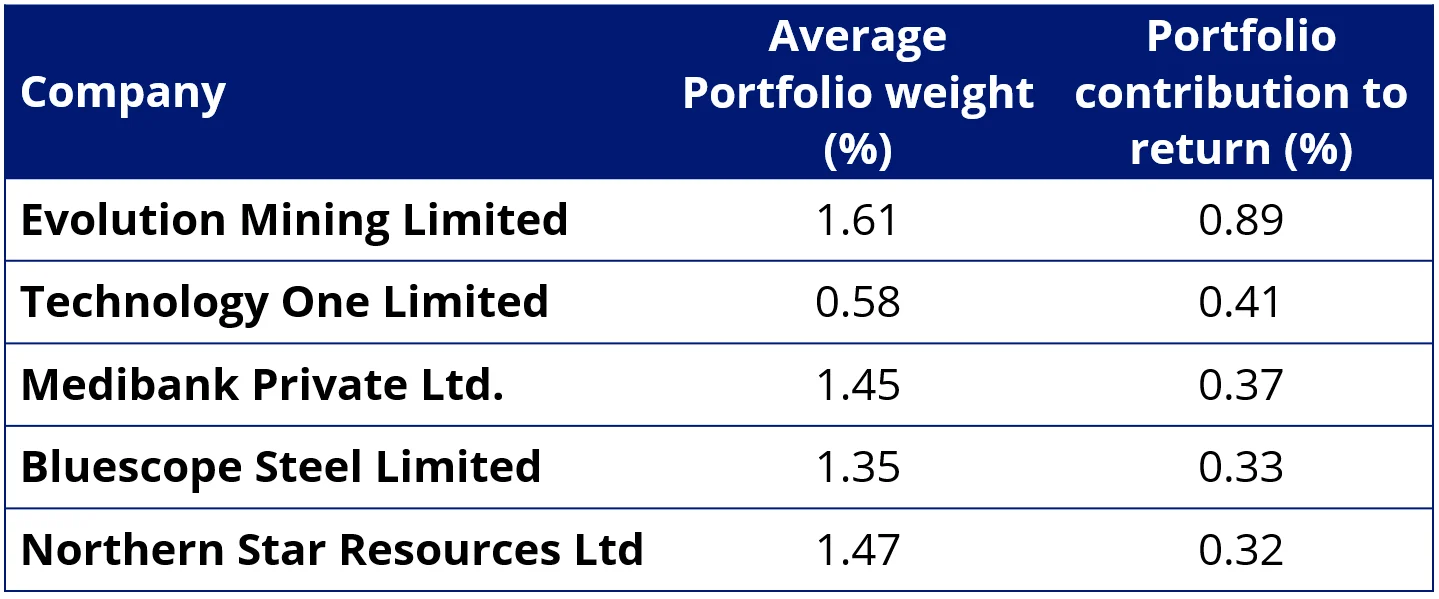
Source: FactSet, 1 Jan 2025 to 20 May 2025. Not a recommendation to act. Past performance is not a reliable indicator of future performance.
Table 3: S&P/ASX200 Top 5 Contributors to return
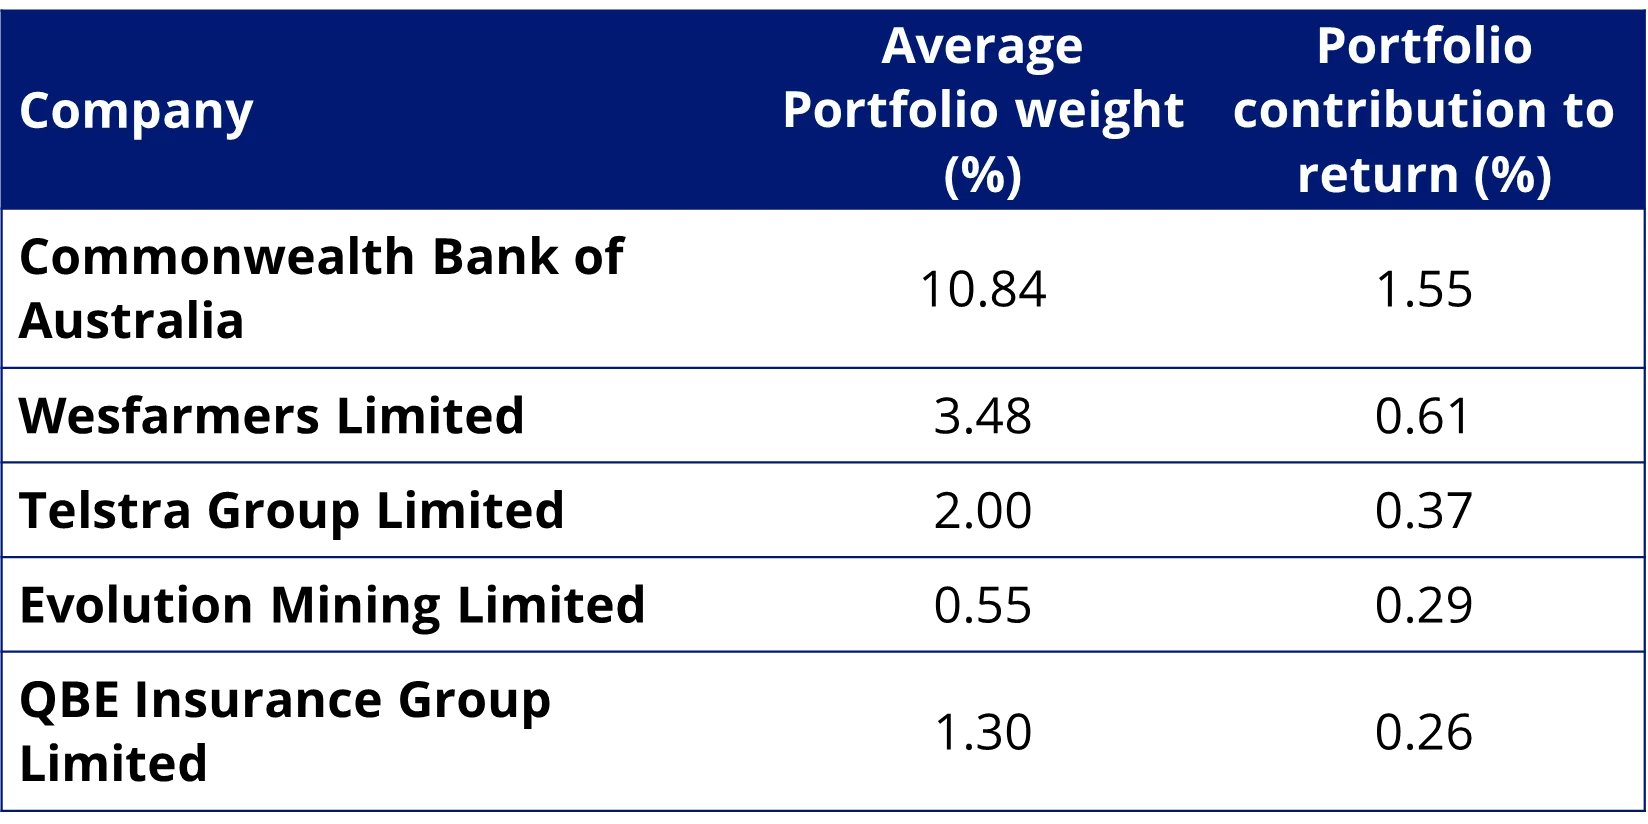
Source: FactSet, 1 Jan 2025 to 20 May 2025. Not a recommendation to act. Past performance is not a reliable indicator of future performance.
Chart 1: Year to date performance of MVW versus large, mid and small cap beta
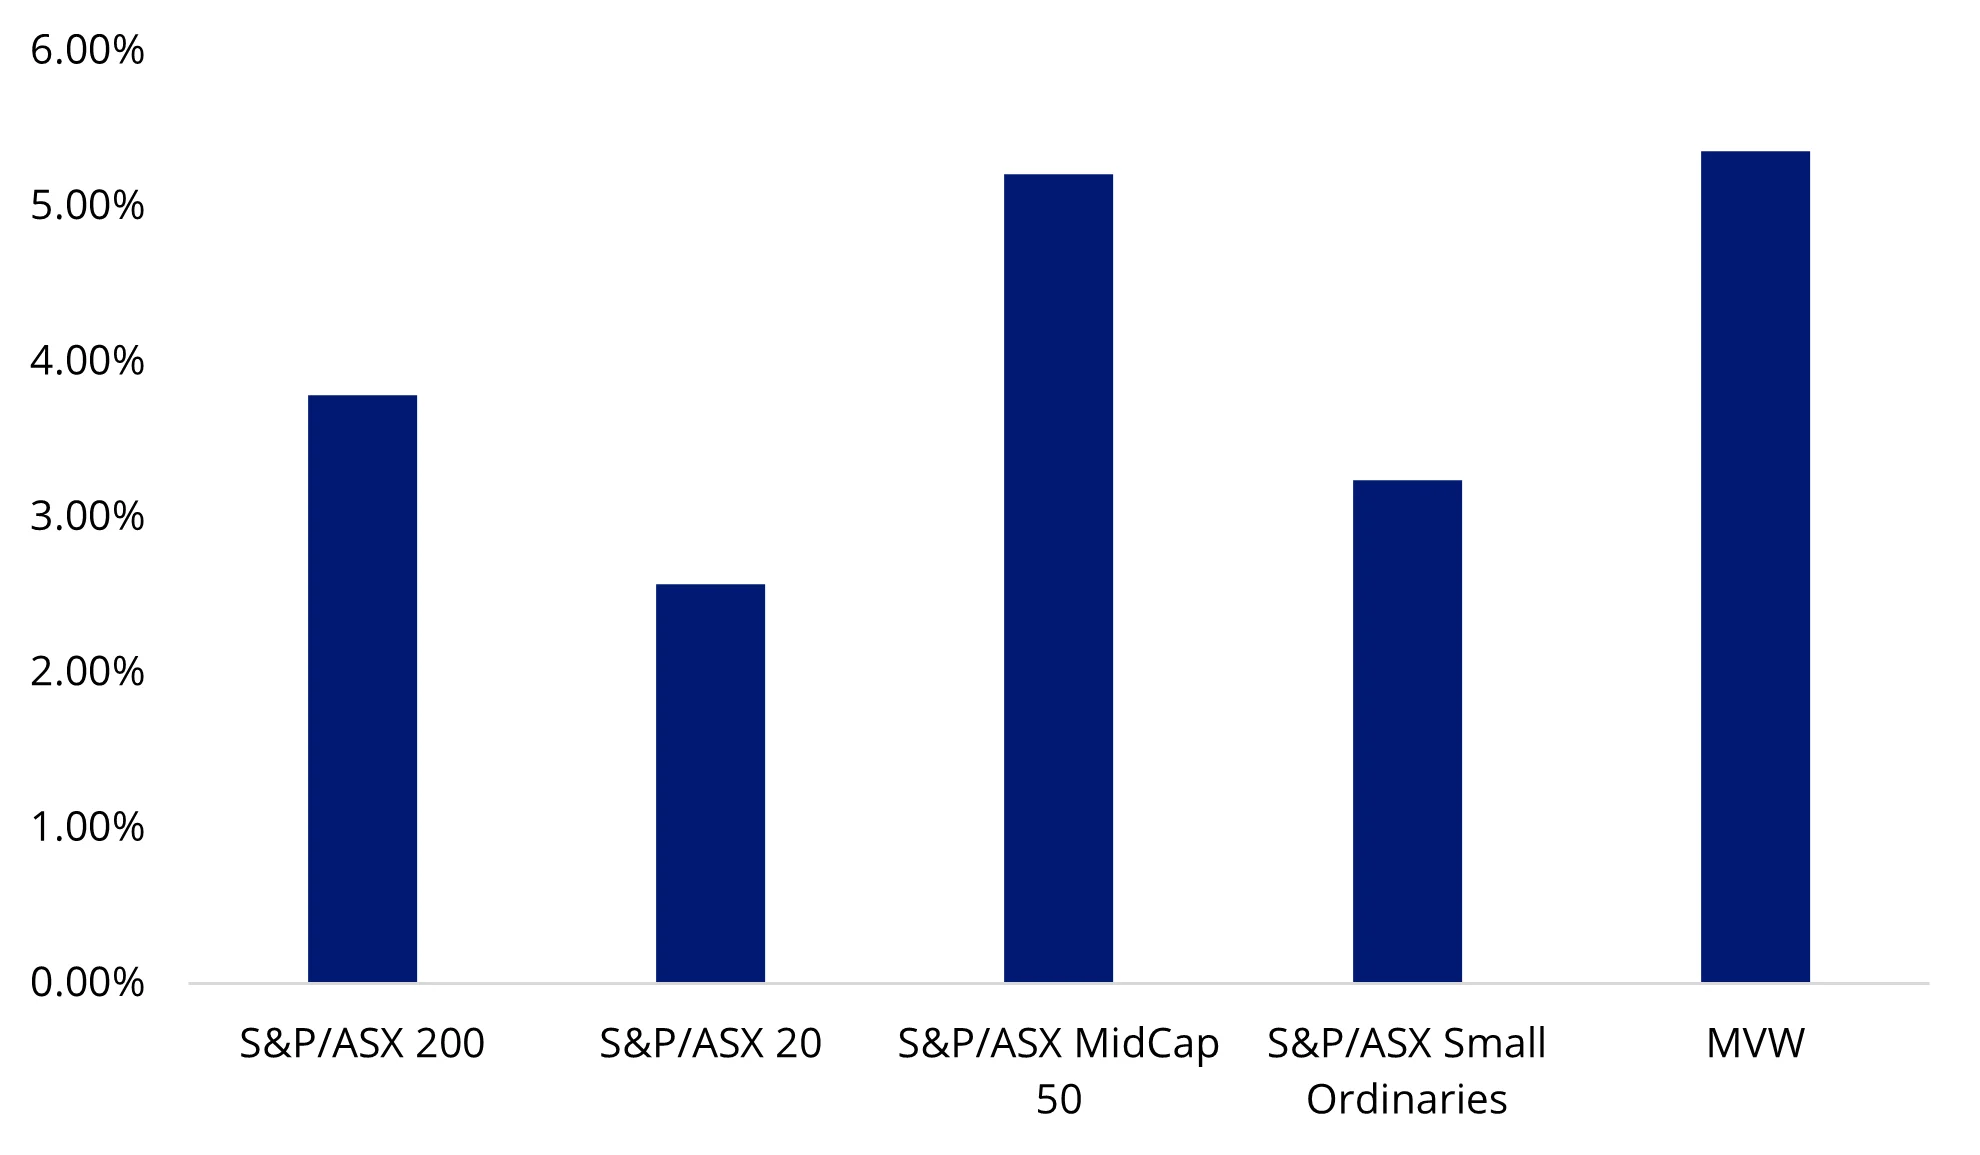
Source: S&P, Morningstar Direct to 20 May 2025. Results are calculated to the last business day of the month and assume immediate reinvestment of distributions. MVW results are net of management fees and other costs incurred in the fund, but before brokerage fees and bid/ask spreads incurred when investors buy/sell on the ASX. Returns for periods longer than one year are annualised. Past performance is not a reliable indicator of future performance. The S&P/ASX indices are shown for comparison purposes as they are the widely recognised benchmarks used to measure the performance of the Australian equities market. MVW’s index has has different industry and market capitalisation allocations than the S&P/ASX indices. Click here for more details.
The recent performance is not an aberration. Since its inception on ASX in 2014, MVW has outperformed the S&P/ASX 200 by 1.14% p.a. As always, past performance should not be relied upon as an indicator of future performance.
Table 4: Trailing performance to 20 May 2025
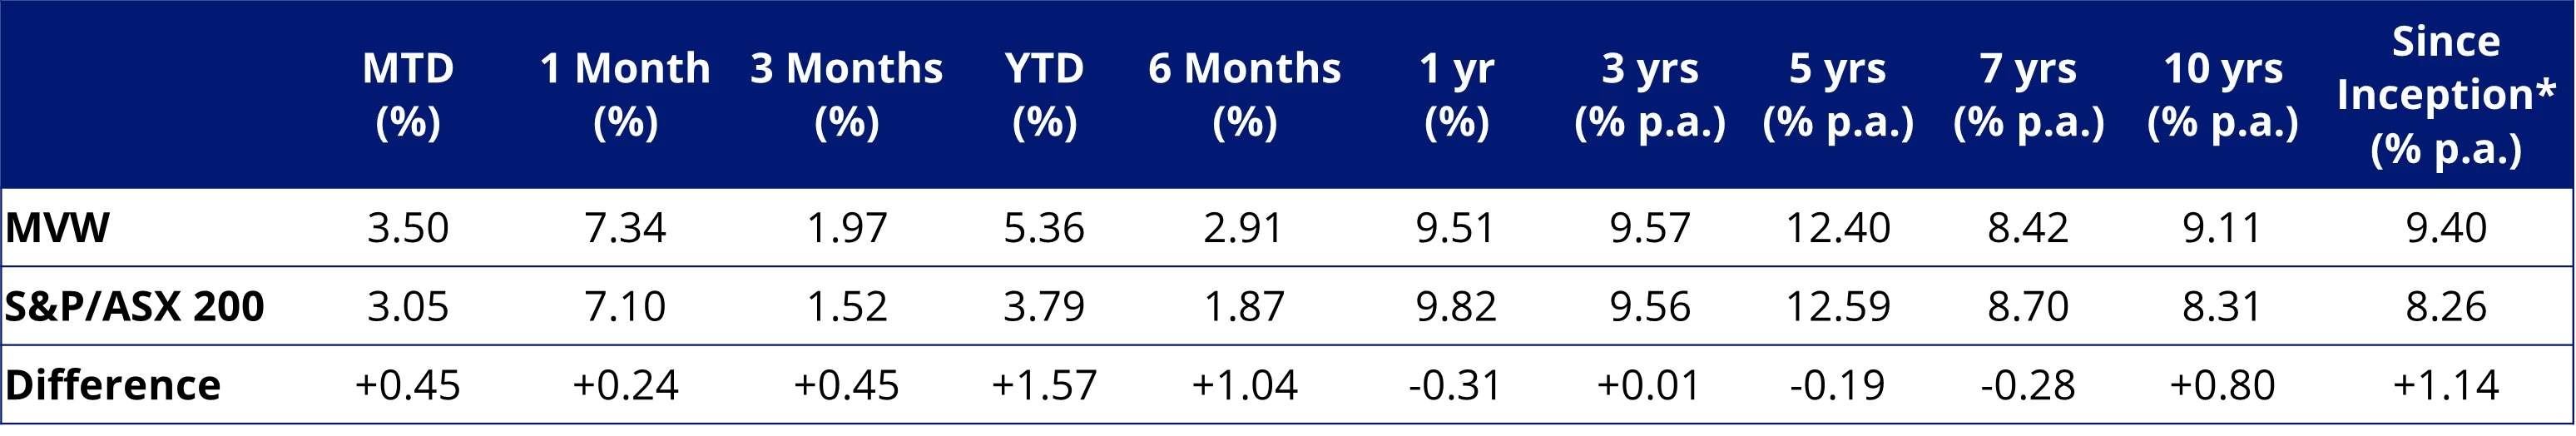
* MVW Inception date is 4 March 2014 a copy of the factsheet is here.
Table 5 source: Morningstar Direct, VanEck. The table above show past performance of MVW and of the S&P/ASX 200. You cannot invest directly in an index. Results are calculated to the last business day of the month and assume immediate reinvestment of distributions. MVW results are net of management fees and other costs incurred in the fund, but before brokerage fees and bid/ask spreads incurred when investors buy/sell on the ASX. Returns for periods longer than one year are annualised. Past performance is not a reliable indicator of future performance. The S&P/ASX 200 Index is shown for comparison purposes as it is the widely recognised benchmark used to measure the performance of the broad Australian equities market. It includes the 200 largest ASX-listed companies, weighted by market capitalisation. MVW’s index measures the performance of the largest and most liquid ASX-listed companies, weighted equally at rebalance. MVW’s index has fewer companies and different industry allocations than the S&P/ASX 200. Click here for more details.
Why equal weighting outperforms
Many academics and financial market professionals have tried to explain why equal-weight indices outperform market capitalisation indices since this phenomenon was first observed. We did this several years ago in a paper titled Why Equal Weighting Outperforms: The Mathematical Explanation.
We would want to highlight one key point about Australian equities that was included in that paper, which is the returns of listed companies are non-ergodic. Ergodicity means that each company should have the same chance to offer the same return, but they don’t.
If the distribution were ergodic, there would be no characteristic of the individual companies that could predict whether certain companies had a lesser chance than other companies of being at either extreme of returns. But that is not the case, as the next chart shows.
Below we have plotted the year-to-date returns of the companies in the S&P/ASX 200 against the company’s size (market capitalisation). You can see that the largest companies’ returns are more narrowly distributed than the rest of the stocks. The mega-sized companies that dominate Australian market capitalisation benchmarks are unlikely to be the ones with extremely high returns. It is the smaller-sized companies outside the top 15 that have generated the highest returns.
Chart 2: Year to date returns for the 200 largest Australian stocks versus their market capitalisation
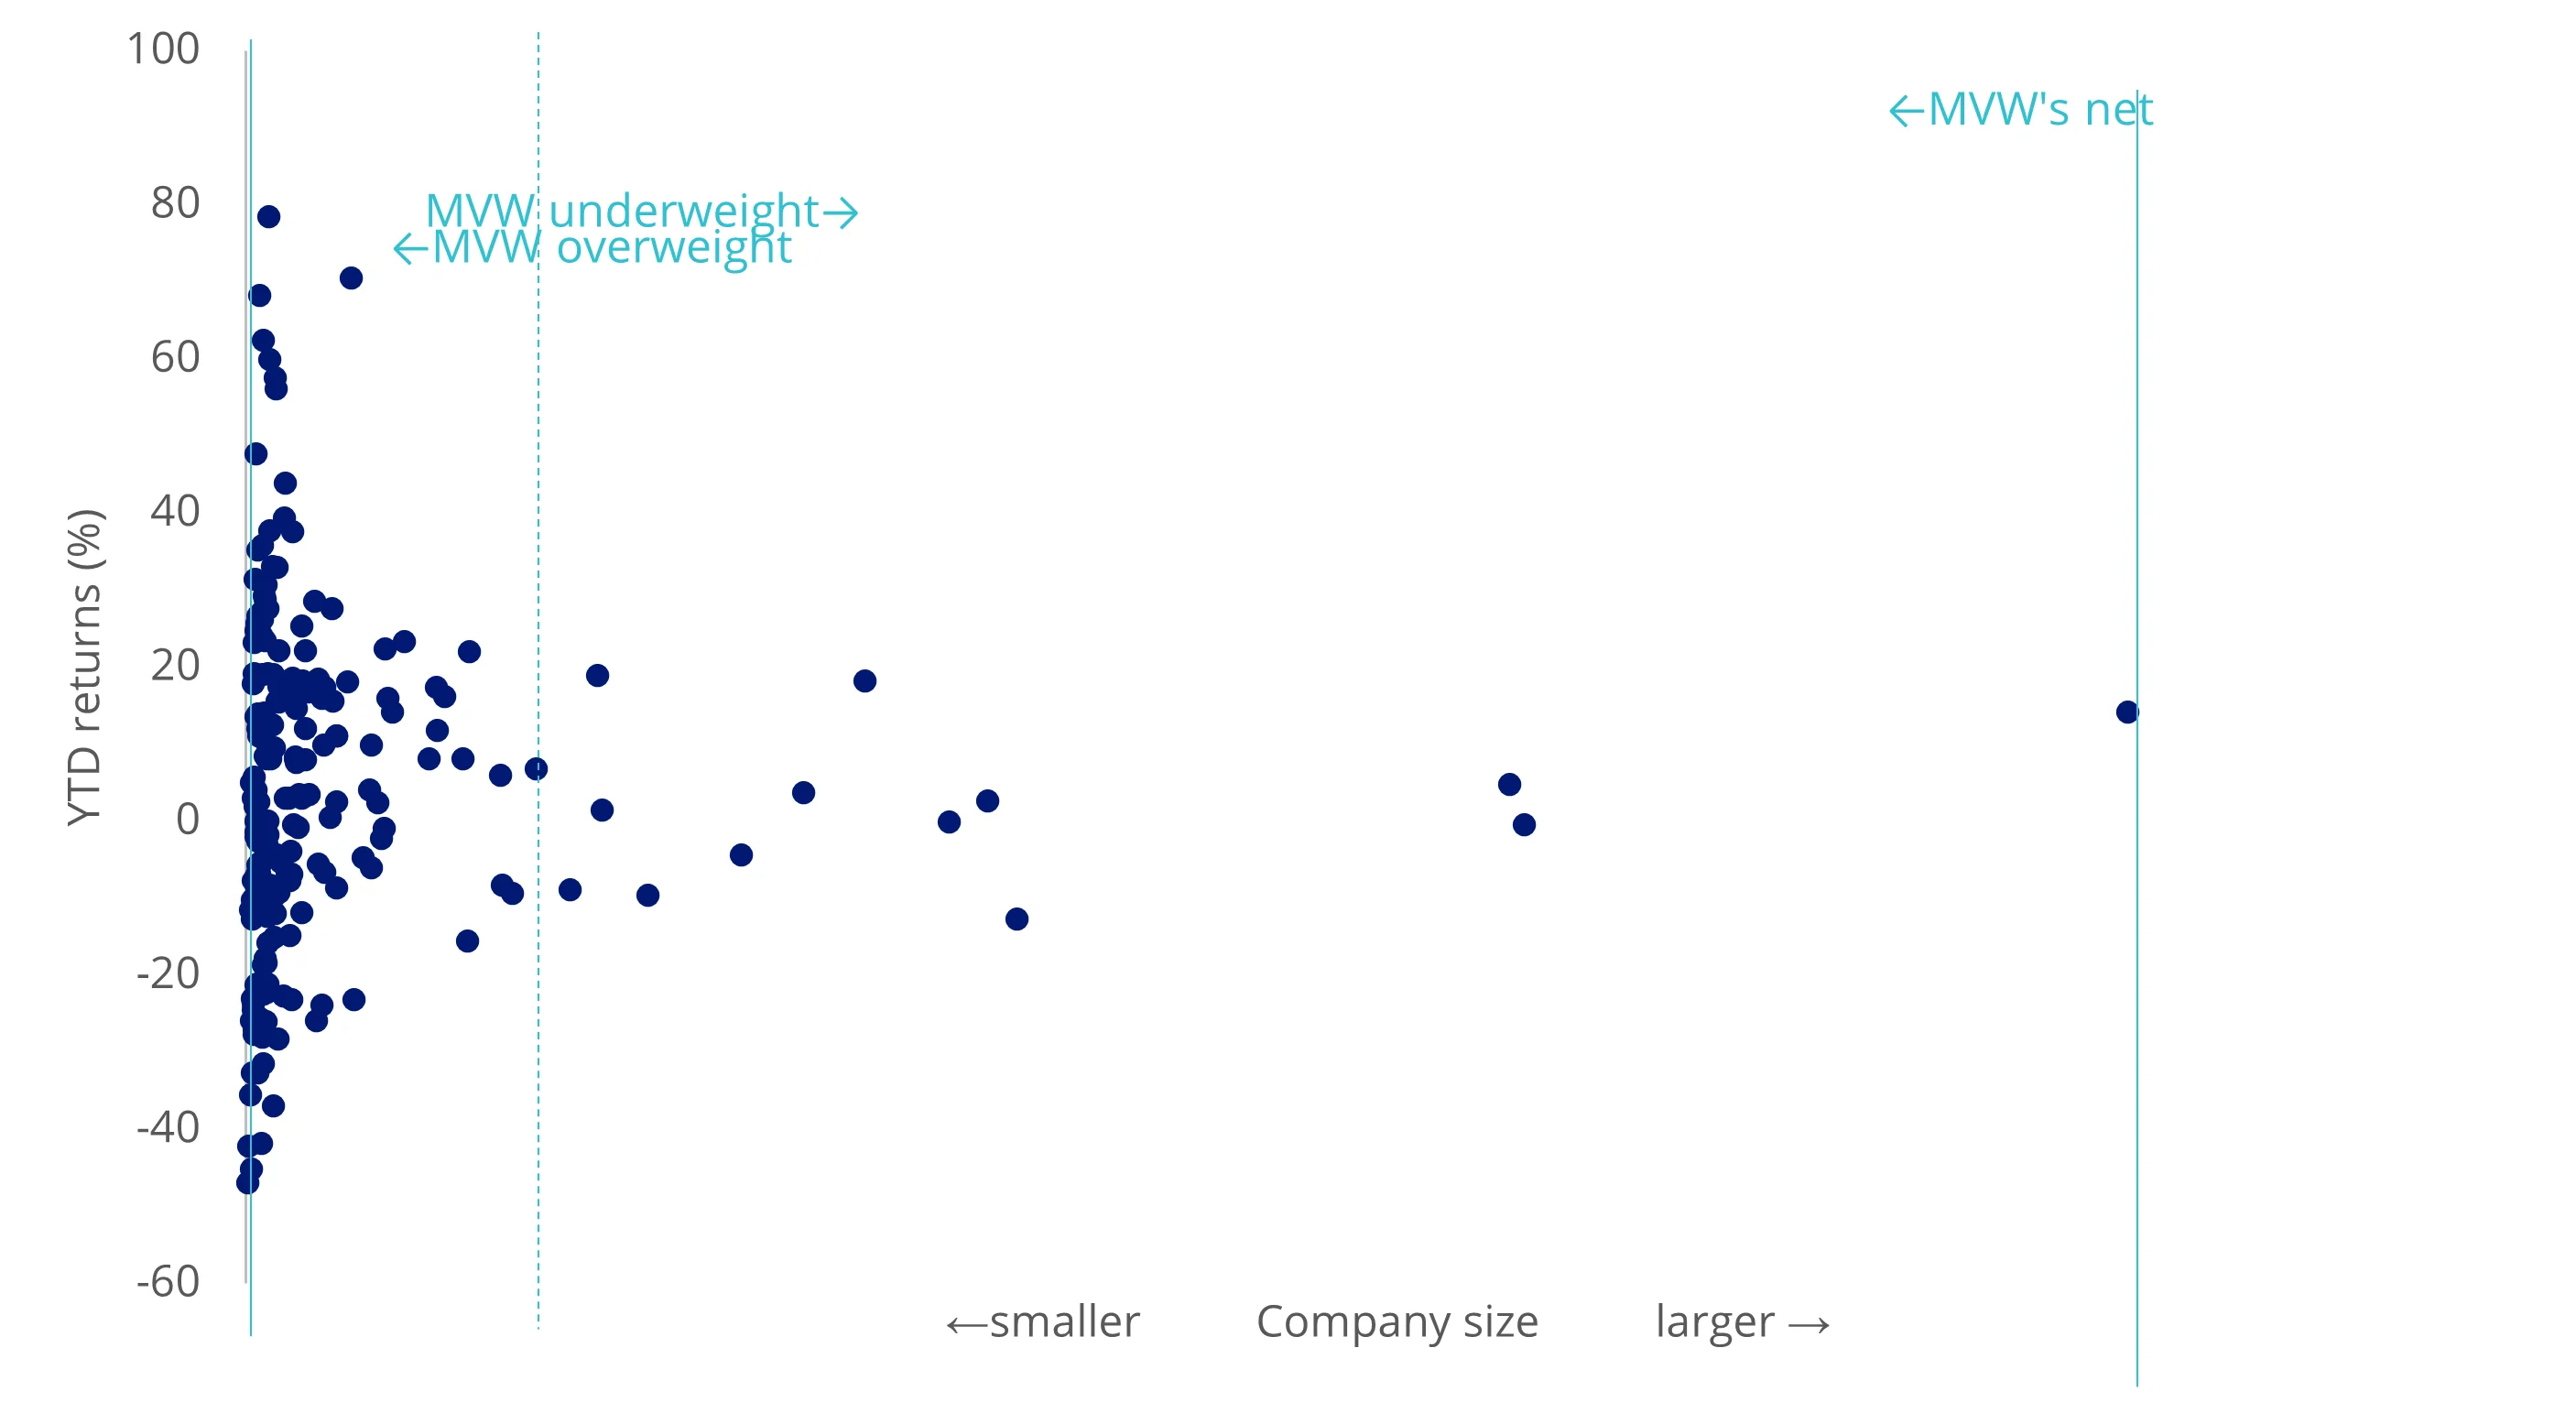
Source: FactSet, 1 Jan 2025 to 20 May 2025. Not a recommendation to act. Past performance is not a reliable indicator of future performance.
This outcome has been shown repeatedly. Therefore, it would make sense to construct a portfolio that has less exposure to the mega-caps and more exposure to the companies that are more likely to experience higher returns. An evenly spread portfolio like MVW is fishing with a much bigger net. MVW currently includes 74 different companies, where each company’s weighting is high enough that the rocketing share price of a company outside the top 15 won’t be lost as a rounding error.
For those interested, the best-performing mega-cap noted in chart 2 above is Telstra (2.00% of the S&P/ASX 200), while the best-performing small cap was Regis Resources (0.11% of S&P/ASX 200). Evolution Mining Limited had the 2ndbest returns for the period.
MVW holds 21 companies, in equal weight, that have had higher returns than CBA since the start of the year. Apart from Telstra, all of these are overweight positions.
Using MVW in a portfolio
Since it launched on ASX in 2014, MVW has become the fourth largest broad-based Australian equities ETF. It is the largest smart beta ETF in its category and has enjoyed support from all parts of the market. These investors have been using MVW to replace or sit alongside their:
- Australian equity unlisted active fund which charges higher fees;
- LICs which are trading at discounts; or
- ASX/200 trackers to reduce stock and sector concentration risks.
MVW has demonstrated resilience across market cycles, consistently avoiding concentration risk inherent in traditional market cap indices, particularly in the context of Australia’s heavily top-weighted financials and resources sectors. For investors focused on long-term stability and enhanced diversification, MVW’s equal-weighted approach offers a compelling alternative for core Australian equities. It is philosophically sound and empirically robust.
Margin of safety
All astute investors understand that ‘value’ offers a margin of safety. MVW currently represents better value with a more compelling price to earnings, price to book and price to sales. It also has higher historical EPS growth than the market index
Table 5: Fundamentals
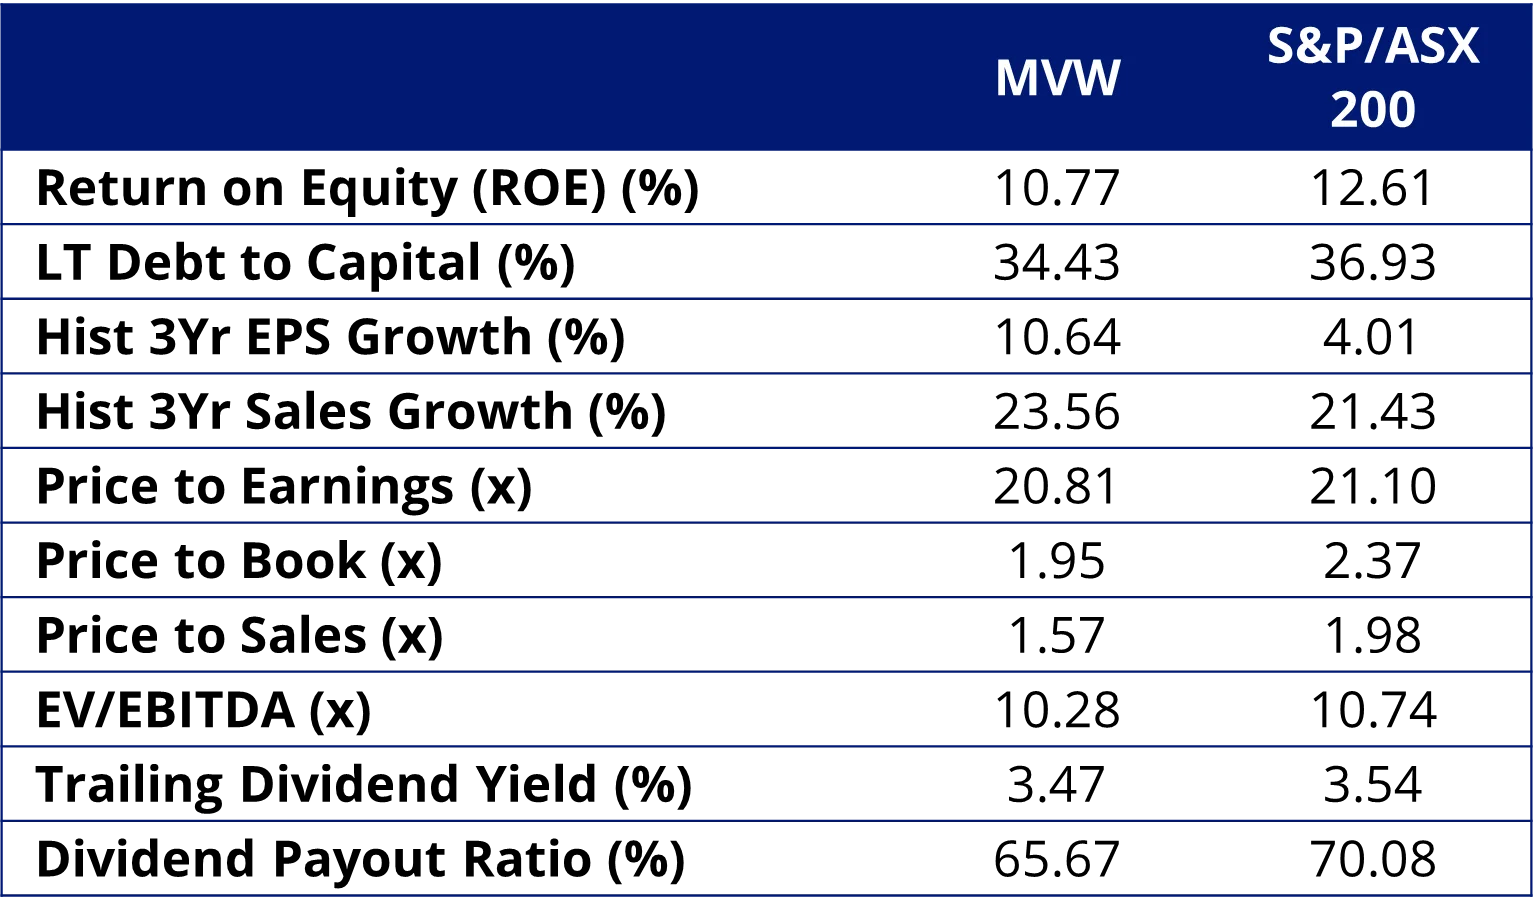
Source: FactSet as at 20 May 2025. This is not indicative of future performance.
MVW’s management fee of just 35 basis points per annum makes it one of the lowest-cost investment funds in its peer group, including unlisted managed active funds. In a landscape where cost, transparency, and value are under the microscope, it’s worth taking a closer look at what’s really being paid for, and whether headline fee signals are telling the full story. MVW does not charge any performance fees.
Many advisers and their investors are already using MVW as their core Australian equity allocation, around which they can add high-conviction satellite ideas.
Key risks
An investment in our Australian equal weight ETF carries risks associated with: financial markets generally, individual company management, industry sectors, fund operations and tracking an index. See the VanEck Australian Equal Weight ETF PDS and TMD for more details.
Source:


Published: 30 May 2025
Any views expressed are opinions of the author at the time of writing and is not a recommendation to act.
VanEck Investments Limited (ACN 146 596 116 AFSL 416755) (VanEck) is the issuer and responsible entity of all VanEck exchange traded funds (Funds) trading on the ASX. This information is general in nature and not personal advice, it does not take into account any person’s financial objectives, situation or needs. The product disclosure statement (PDS) and the target market determination (TMD) for all Funds are available at vaneck.com.au. You should consider whether or not an investment in any Fund is appropriate for you. Investments in a Fund involve risks associated with financial markets. These risks vary depending on a Fund’s investment objective. Refer to the applicable PDS and TMD for more details on risks. Investment returns and capital are not guaranteed.