Seasons change but the strategy doesn't have to


Like the weather, economic cycle changes are inevitable, but their timing, duration and intensity are difficult to predict.
As we approached summer last year, we wrote a Vector Insights about the seasons of the economic cycle and how different investment factors perform as market conditions change.
Like the weather, economic cycle changes are inevitable, but their timing, duration and intensity are difficult to predict.
We titled last year’s piece Seasonal changes seem more volatile, and 2026 appears to have lived up to that title. This year has had lots of ups and downs, from the War in Iran to stubborn inflation and rising rates.
Through 2026, Value has been the winning factor, as it was in 2025. But investors are now preparing for 2027. High rates and inflation persist both at home and abroad, and these are environments in which the Value factor has historically outperformed.
However, many investors are wary of volatility returning to the market. When volatility has risen in the past, quality has outperformed.
We have updated the numbers, and we think they reinforce that investors may be better served by diversifying their factor exposure rather than trying to predict which factor will lead.
A change in the seasons
Growth companies can thrive when economic conditions support earnings expansion and investors are willing to pay for future profits. Value can benefit when market leadership broadens and investors reassess companies trading at relatively attractive valuations. Quality, with its emphasis on financial strength and profitability, can offer resilience when economic conditions become more challenging.
These characteristics help explain why different factors have performed well at different times.
In our previous analysis, Growth had delivered the strongest overall returns since November 1998. But that performance came with greater volatility. Losses, when they occurred, were far deeper. In periods of market turmoil, the go-to factor has been Quality.
Value, meanwhile, has enjoyed periods of strong relative performance, such as in the early 2000s and in the recent past when inflation returned.
The benefits of diversifying
Last year, we considered 46 hypothetical portfolios comprising different proportions of Quality, Growth and Value, with each portfolio rebalanced annually to its original allocations.
The objective was to identify the portfolio with the best risk adjusted returns, as measured by the Sharpe ratio. The Sharpe ratio, which considers the returns and the volatility as the measure of risk, is used by investment professionals to ascertain risk-adjusted returns.
When we did the analysis in 2025, a portfolio with 40% Quality, 30% Growth and 30% Value achieved the highest Sharpe ratio over the 27 years assessed.
We have now extended the analysis from November 1998 to September 2026.
Of the 46 portfolios assessed, a portfolio comprising 30% Quality, 30% Growth and 40% Value now has the highest Sharpe ratio.
|
2025 analysis |
2026 analysis |
|
|
Quality |
40% |
30% |
|
Growth |
30% |
30% |
|
Value |
30% |
40% |
Source: VanEck, MSCI. 2025 Analysis November 1998 to October 2025. 2026 analysis November 1998 to September 2026. Hypothetical portfolios rebalanced annually. Sharpe ratios calculated using monthly returns and the RBA cash rate as the risk-free rate. Past performance is not a reliable indicator of future performance.
The difference, we think, reinforces the point of our earlier articles. Investors may benefit by maintaining a diversified exposure to different investment factors, instead of relying on one factor to perform in every environment.
When Value is leading, as it has in the past 24 months, Growth or Quality may lag. When the market season changes, previous laggards may become important contributors to portfolio performance.
By having an exposure to all three, investors can participate in different sources of return without having to predict when each factor will lead. But as the chart below shows, having an exposure to any factor has delivered a superior result to investing solely in the broad market over the past quarter-century.
Chart 1: Hypothetical performance of international equity models
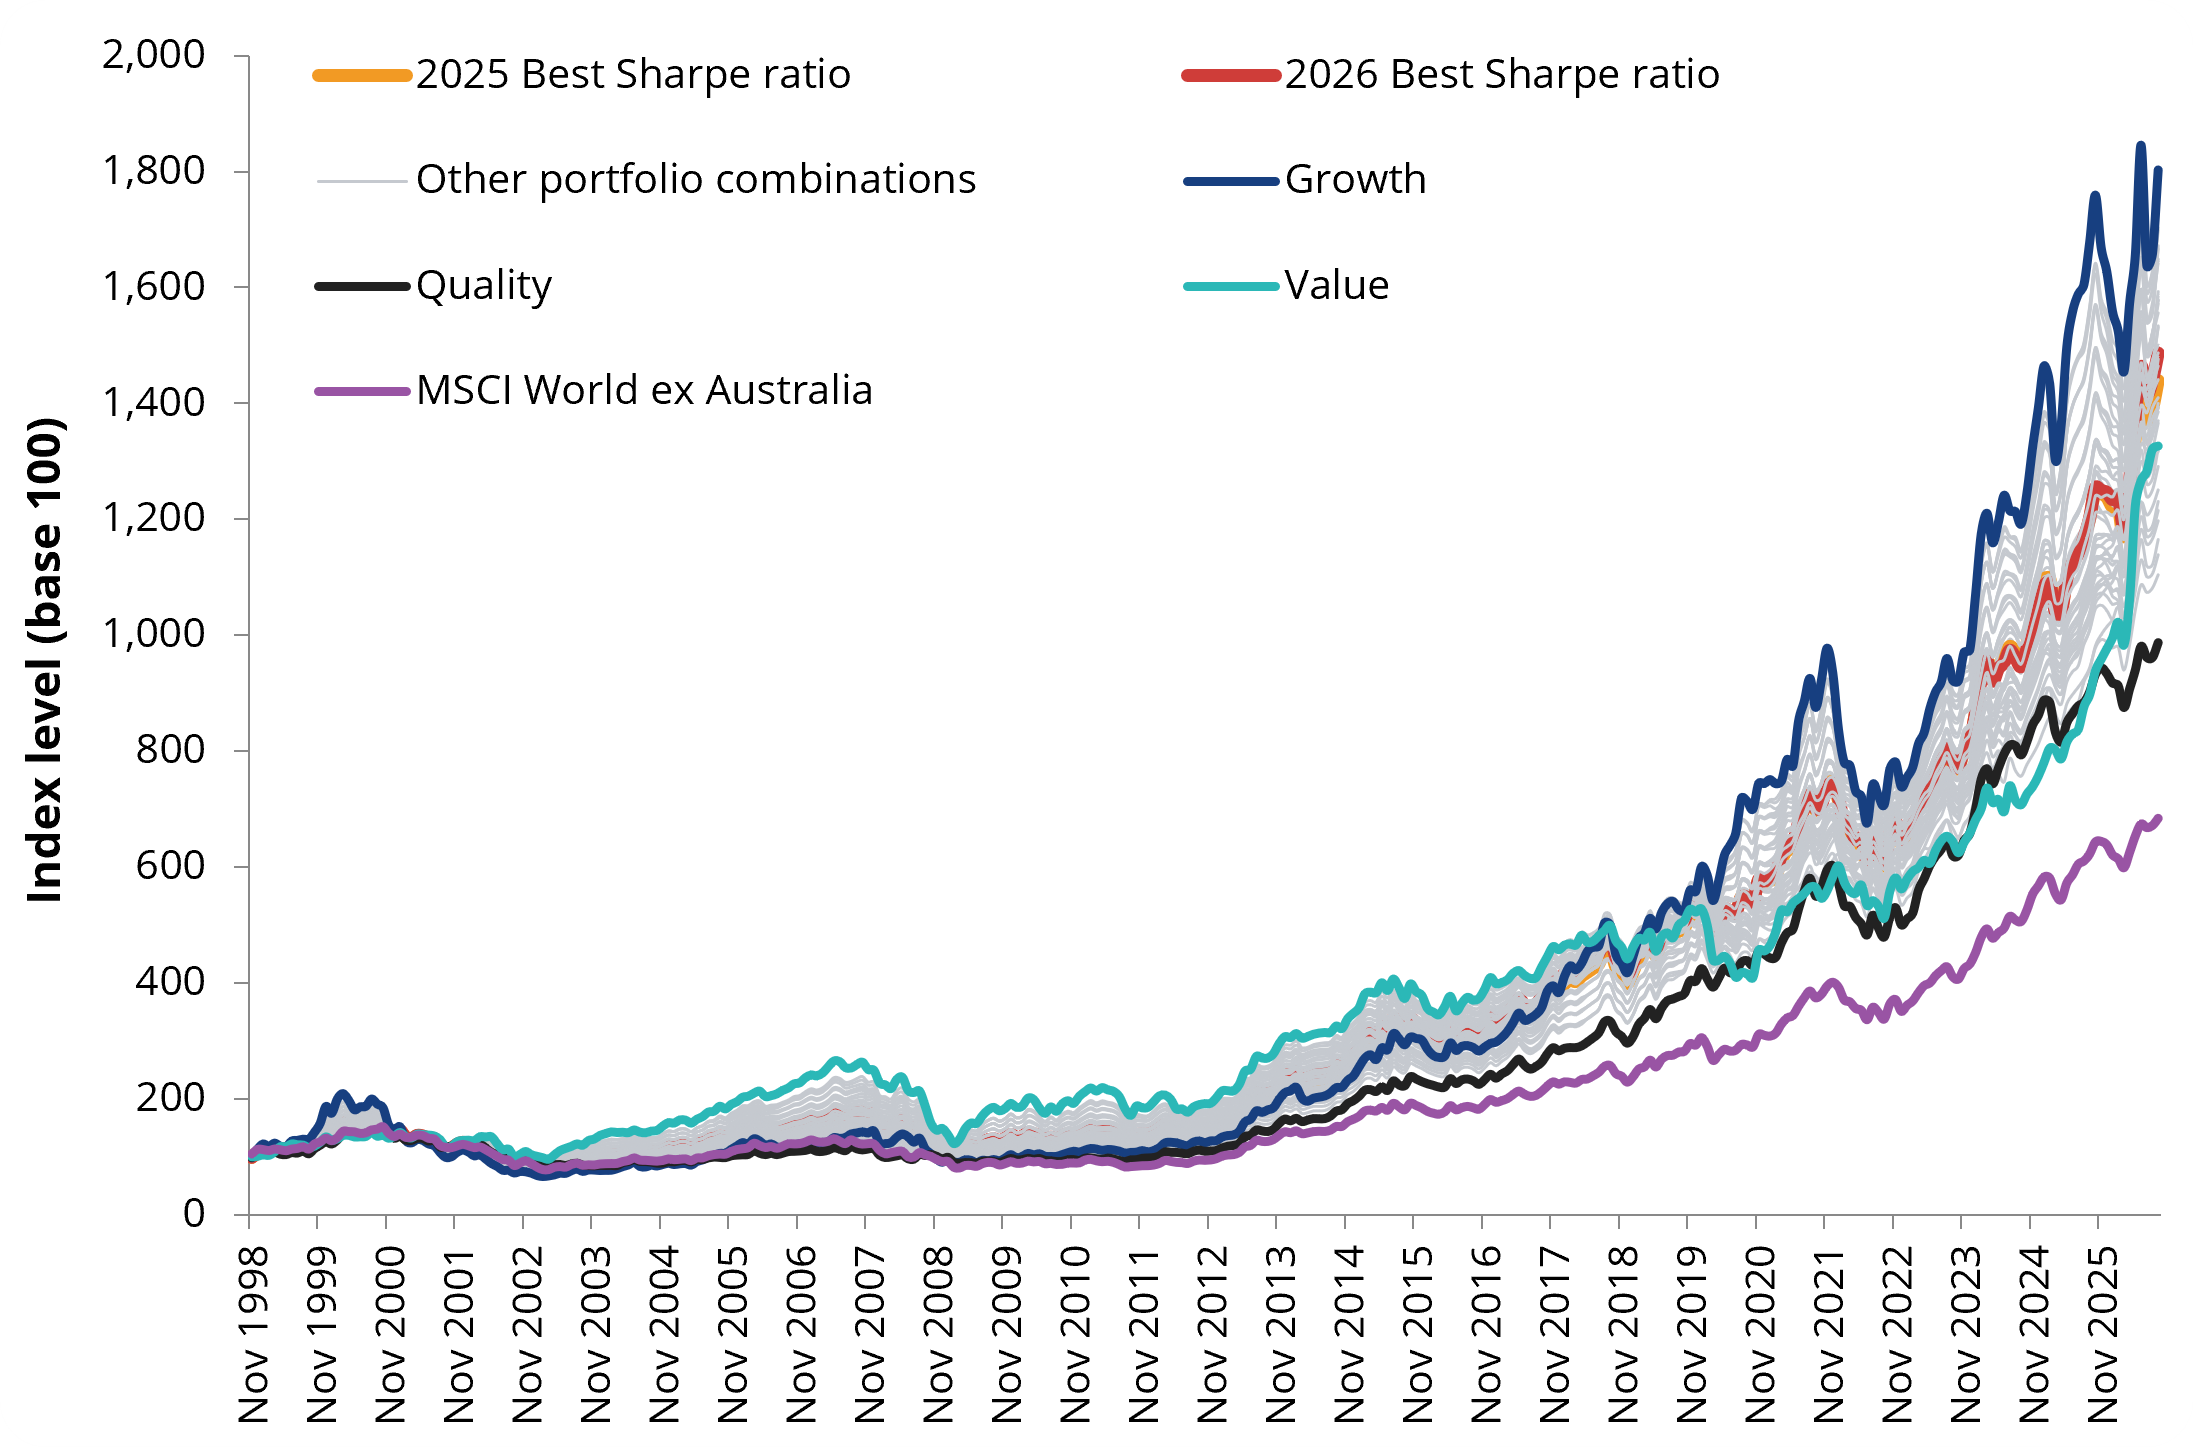
Source: VanEck, MSCI, Morningstar Direct, as at 30 September 2026. Rebased to 100 at 1 November 1998. Growth is MSCI World ex Australia Growth Select Index (GWTH Index), Quality is MSCI World ex Australia Quality Index (QUAL Index), Value is MSCI World ex Australia Enhanced Value Top 250 Select Index (VLUE Index). Other portfolio combinations represent GWTH Index, QUAL Index and VLUE Index in different proportions, assuming an annual rebalance. Past performance is not indicative of future performance. You cannot invest in an index. Results are calculated to the last business day of the month and assume immediate reinvestment of all dividends and exclude fees and costs associated with investing. QUAL’s Index base date is calculated at 30 November 1994. QUAL Index performance prior to its launch on 15 October 2014 is simulated. VLUE’s Index base date is calculated at 30 November 1998. VLUE Index performance prior to its launch on 15 February 2021 is simulated. GWTH’s Index base date is calculated at 31 May 1998. GWTH Index performance prior to its launch on 18 August 2025 is simulated. The MSCI World ex Australia Index (“MSCI World ex Aus”) is shown for comparison purposes as it is the widely recognised benchmark used to measure the performance of developed market large- and mid-cap companies, weighted by market capitalisation. GWTH, QUAL and VLUE’s index have fewer companies and different country and industry allocations than MSCI World ex Aus.
Don't chase the season
The past 28 years have included the dot-com bust, the Global Financial Crisis, a prolonged period of low interest rates, COVID-19 and inflation shocks. Throughout the first part of the century, Value was the go-to factor. After the GFC, it was a relative underperformer for 15 years while Growth and Quality flourished.
Each environment has presented different challenges and opportunities for Quality, Growth and Value.
Our analysis continues to show while investment seasons will continue to change, a diversified factor approach means your investment strategy doesn't have to change with them.
ETFs are the ideal building blocks for an investment portfolio with factors. They offer liquid, diversified and cost-effective exposure to many different asset classes and markets via simple trades on ASX.
We have dedicated pages for quality investing, value investing and growth investing:
- Quality Investing: An investment approach focused on quality companies
- Value Investing: An approach focused on identifying stocks with prices that seem to understate their intrinsic value.
- Growth Investing: An approach focused on identifying companies poised for rapid revenue and earnings expansion
The pages include videos and flyers. They also highlight other investment approaches that capture the quality, growth and value factors.
As always, we recommend you speak to an investment professional to determine which investment/blend is right for you.
Key risks
An investment in our growth, quality and value ETFs carries risks associated with: ASX trading time differences, financial markets generally, individual company management, industry sectors, foreign currency, country or sector concentration, political, regulatory and tax risks, fund operations, liquidity and tracking an index. See the relevant PDS and TMD for more details.


Published: 29 October 2026
Any views expressed are opinions of the author at the time of writing and is not a recommendation to act.
VanEck Investments Limited (ACN 146 596 116 AFSL 416755) (‘VanEck’) is the issuer and responsible entity of all VanEck exchange traded funds (Funds) listed on the ASX. This is general advice only and does not take into account any person’s financial objectives, situation or needs. The product disclosure statement (PDS) and the target market determination (TMD) for all Funds are available at vaneck.com.au. You should consider whether or not an investment in any Fund is appropriate for you. Investments in a Fund involve risks associated with financial markets. These risks vary depending on a Fund’s investment objective. Refer to the applicable PDS and TMD for more details on risks. Investment returns and capital are not guaranteed.
GWTH, VLUE and QUAL are indexed to a MSCI index. GWTH, VLUE and QUAL are not sponsored, endorsed or promoted by MSCI, and MSCI bears no liability with respect to GWTH, VLUE, QUAL or the indices. The PDS contains a more detailed description of the limited relationship MSCI has with VanEck and the funds.