Honey, I shrunk the resources
Small resources companies made up approximately 40% of the S&P/ASX Small Ordinaries Index in 2010. By mid-2014 they dropped to about 18%. During this period over 70% of active small-cap managers outperformed the index. Since then, small resources have recovered but the percentage of active small-cap managers that have outperformed the index has plummeted to below 40%. In a fee conscious world savvy investors are now applying the same scrutiny to active small-cap managers that they apply to active large-cap managers.
Recently S&P Dow Jones Indices released its much publicised SPIVAi Mid-Year Australian Scorecard. The SPIVA Scorecard reports on the performance of actively managed funds against their respective benchmark indices.
Where active management once ruled, the SPIVA Scorecard shows a sharp increase in the number of active small-cap managers that are falling behind the index. SPIVA now utilise the S&P/ASX Small Mid Cap Index because many active small-cap managers are invested in small and mid-cap stocks.
Table 1 shows that for the eight years prior to 2015 over 70% of active small-cap managers outperformed their benchmark index. However, in 2015 this number dropped to less than 45% and then worsened in the 12 months to 30 June 2016 with less than 40% of active managers outperforming. This indicates that the Australian market has changed.
Table 1: Percentage of funds outperformed by the index
2011 |
2012 |
2013 |
2014 |
2015* |
2016* |
|
One year (%) |
29.73 |
15.79 |
6.12 |
8.18 |
55.21 |
61.32 |
Three year (%) |
13.16 |
20.73 |
11.54 |
7.69 |
35.11 |
51.55 |
Five year (%) |
24.64 |
20.78 |
18.10 |
17.12 |
29.17 |
38.00 |
Source: S&P Dow Jones Indices, VanEck. Numbers are for the 12 months to 30 June of the relevant year.
* 2015 and 2016 SPIVA scorecard reporting changed from S&P/ASX Small Ordinaries Index to S&P/ASX Small Mid Cap Index
One of the big changes in the market is the size of the resources sector. Resources are defined as companies classified in the energy sector as well as companies classified in the metals and mining industry, a subset of the materials sector. In 2010 small resources companies made up approximately 40% of the S&P/ASX Small Ordinaries Index. By 2015 resources had became just 12% of the index but since the beginning of 2016 they have started to recover.
Investing actively in resources requires specialist knowledge of geology that most small-cap managers don’t have. By screening out resource stocks prior to the sector’s fall in 2010, when it represented 40% of the index active small-cap managers outperformed.
However as can be seen in Graph 1 below, along with the decline in resources in the Australian small-cap market there has been considerable expansion in other sectors, notably consumer discretionary, health care and information technology.
Graph 1: GICS sector breakdown of S&P Small Ordinaries Index 2008 - 2016
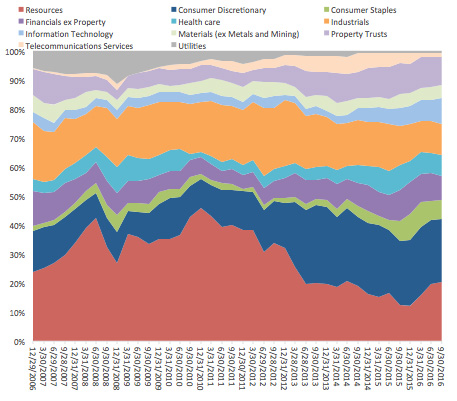
Source: Factset, 1 October 2008 to 30 September 2016
In this new market active small-cap managers, like their large-cap peers, now have to pick stock winners rather than just relying on sector allocation. The past two years indicate that picking winners in small-caps has become as difficult as in large-caps and only the best active managers have the skills to pick winners in every sector of the market.
Passive managers that track the index are outperforming the majority of active small-cap managers and charging lower fees. Prudent investors should be assessing their active small-cap managers with the same scrutiny they apply to their active large-cap managers. Performance should be coming from a variety of small, as opposed to mid-cap, companies including resources stocks.
The VanEck Vectors Small Cap Dividend Payers ETF (ASX code: MVS ) is a low fee, passive fund. MVS is a smart beta ETF which exhibits a quality and value bias relative to the S&P/ASX Small Ordinaries index due to its screens for inclusion. The screens are:
- Liquidity - Holdings in MVS must pass MV Index Solution’s stringent size and liquidity screens so illiquid stocks are avoided; and
- Dividends - Screening for dividend payers helps identify more stable businesses as companies that pay dividends are typically profitable with robust balance sheets and strong cash flows.
The result is a fund that gives investors an instant portfolio of 93 small company stocks from all sectors of the Australian market via a single trade on ASX. MVS has one of the lowest management fees among both active and passive strategies in the market.
Important Information: This information is issued by VanEck Investments Limited ABN 22 146 596 116 AFSL 416755 (‘VanEck’) as responsible entity and issuer of the VanEck Vectors Small Cap Dividend Payers ETF (‘Fund’). This is general information only and not financial advice. It does not take into account any person’s individual objectives, financial situation or needs. Before making an investment decision in relation to the Fund, you should read the PDS and with the assistance of a financial adviser consider if it is appropriate for your circumstances. The PDS is available at www.vaneck.com.au or by calling 1300 68 38 37. The Fund is subject to investment risk, including possible loss of capital invested. Past performance is not a reliable indicator of future performance. No member of the VanEck group of companies gives any guarantee or assurance as to the repayment of capital, the payment of income, the performance, or any particular rate of return from the Fund.
i SPIVA – S&P Indices Versus Active


Published: 09 August 2018