3 ideas for Australia's economic prospects


Australia has earned a reputation for resilience. It has weathered the pandemic, inflation and the fastest interest-rate tightening cycle in decades without falling into recession.
Yet resilience should not be mistaken for strength. While inflation has eased from its peak, underlying price pressures remain among the highest in the developed world, business hiring intentions are softening and consumer confidence remains subdued. Together, they point to an economy that is slowing rather than stalling.
Last week, the OECD’s Annual Employment Outlook revealed that Australians have experienced one of the steepest declines in living standards in the developed world since the pandemic. Their research also found that real wages have seen a 5.1% decline in Australia since March 2021, versus the average OECD member country which has enjoyed a 5% lift in living standards over that same time frame.
Deloitte Access Economics, meanwhile, expects Australia's economy to record its longest stretch of sub-2% growth since the recession of the early 1990s. Its report argues the problem is not simply a weak economic cycle, but years of underinvestment and dwindling productivity, leaving Australia less able to generate sustainable growth.
Chart 1: Productivity in Australia vs the US
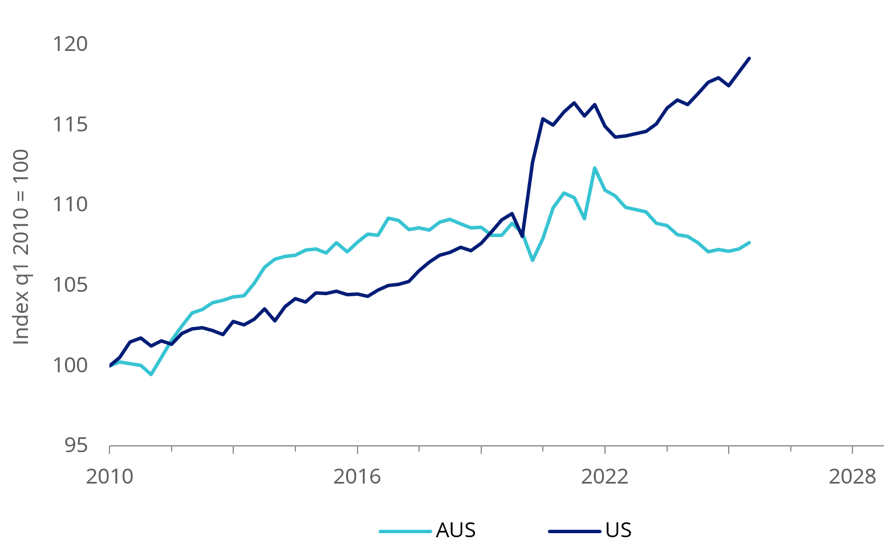
Source: Organisation for Economic Co-operation and Development, National Bureau of Economic Research, Data to 31 March 2026.
One manifestation of this underinvestment has been Australia's enduring preference for housing over productive investment. Investment loans, therefore, make up an important component of Australian banks loan books. But early indications are that, since the budget, property has lost its appeal for investors. Investor lending was rising in May, before the budget. Westpac has subsequently reported that its investor loans fell by a fifth from the budget to mid-June.
Chart 2: Investors taking up a smaller share of Westpac home loans
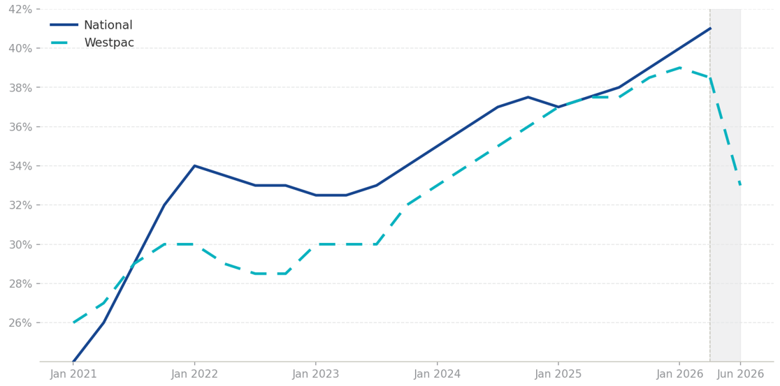
Source: Australian Bureau of Statistics, Westpac. Notes: Shaded area indicates post-Budget. Westpac data is current as at June 2026, based on preliminary results.
And this is all having an impact on house prices. Cotality reported that nationally, property prices fell 0.4 per cent in May, while Sydney and Melbourne experienced 3.2 and 2.6 per cent falls respectively in the June quarter. The property data provider also reported that the previous weekends auction clearance rate was 49.8 per cent, well below the decade average of 65 per cent.
Many economists think that the house slump could trigger a slowdown in the wider economy, as consumption falls as wealth does. With an estimated two thirds of household wealth tied to property in Australia, price falls are likely to have an impact on other parts of the economy, as households don’t feel so wealthy.
Together, these trends explain why Australia's economic and earnings outlook has become more challenging than many of its developed market peers, and why Australian equities have increasingly struggled to keep pace with global markets.
The ASX 200’s consistent underperformance is being noticed
For years, we have argued that simply buying the index is not always the most effective way to build wealth. The past financial year has brought this case to the fore more than ever.
Since the start of 2010, the S&P/ASX 200 has trailed the MSCI World, which tracks developed markets globally, in 11 of the past 17 financial years.
But the bigger concern is that the underperformance is getting worse. FY26 saw the underperformance run extend to four consecutive years, and the second biggest performance gap since 1996.
Chart 3: Australian equity underperformance is starting to sting
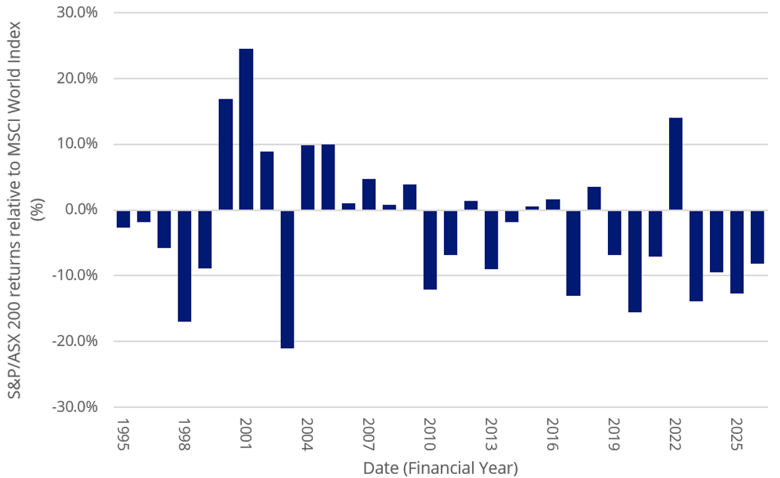
Source: Bloomberg, VanEck. As at 30 June 2026. Past performance is not indicative of future performance. You cannot invest directly in an index.
If Australia's economy is entering a period of more subdued growth, investors should not be surprised if earnings growth becomes harder to find domestically. That strengthens the case for looking beyond a standard S&P/ASX 200 index fund.
Strengthen the portfolio’s foundation
When growth is scarce, relying on a handful of companies to drive returns becomes a bigger risk.
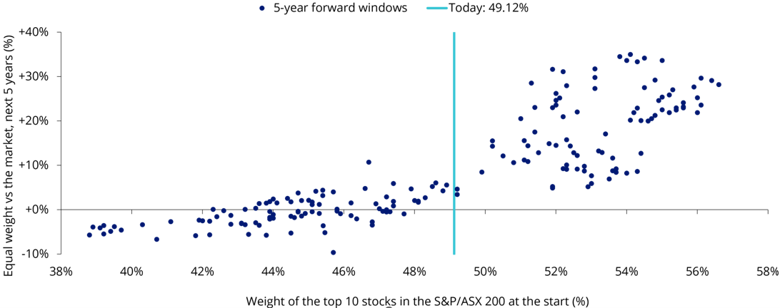
Today, the S&P/ASX 200 remains one of the most concentrated developed market indices, with almost half the index invested in just ten companies.
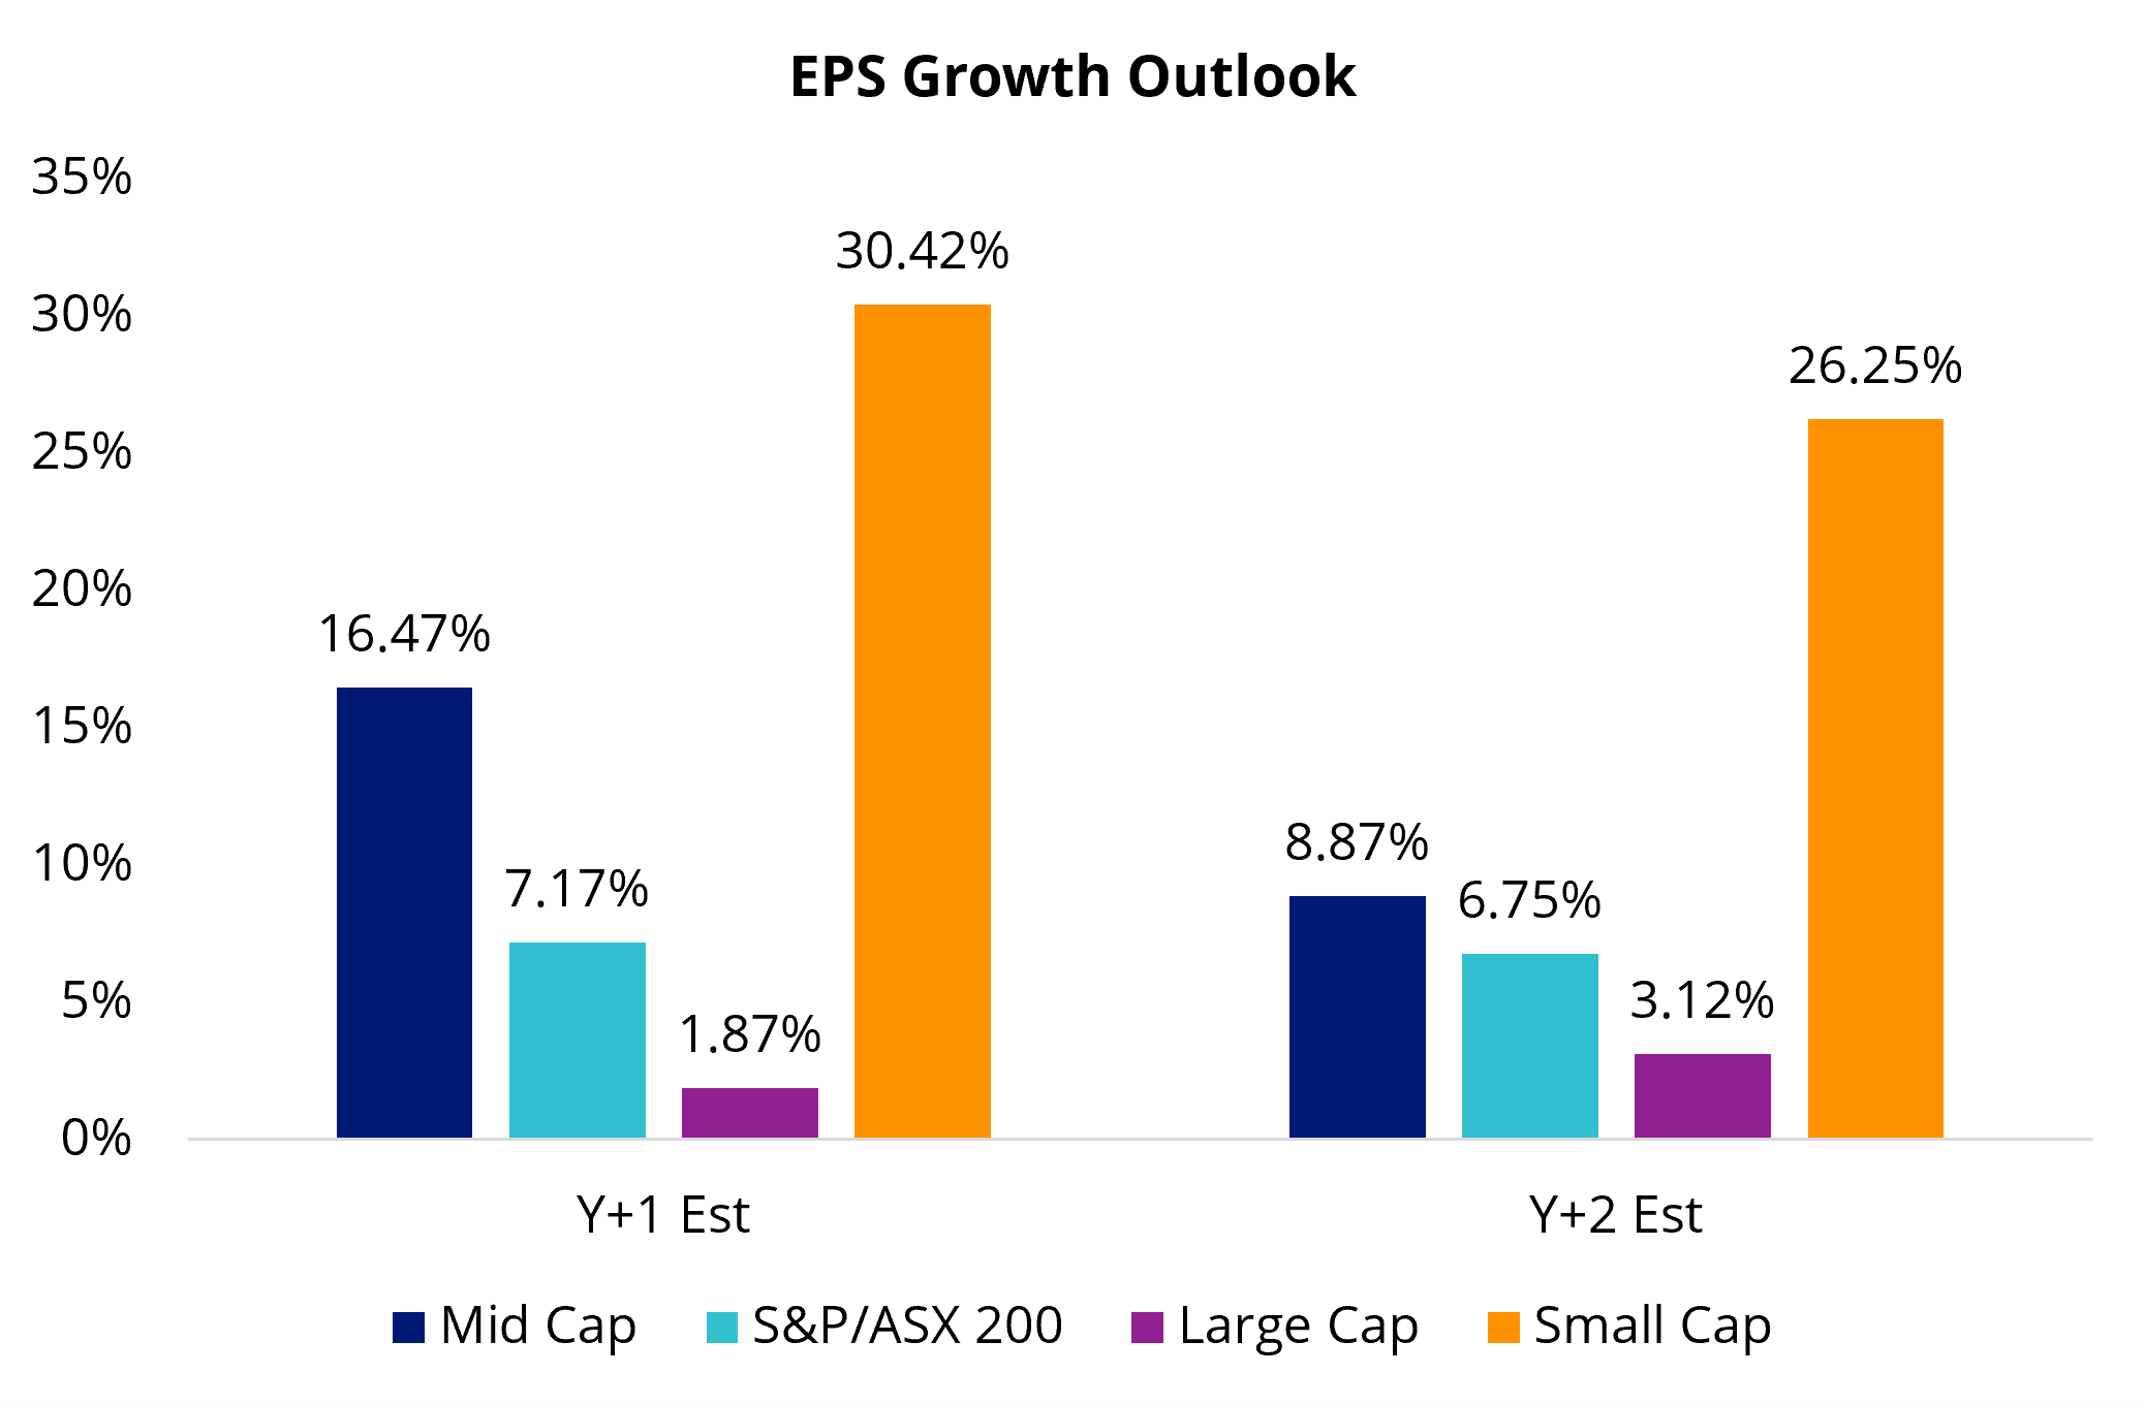
But that concentration tells only part of the story. As the chart below shows, earnings growth is still expected across the Australian market. What's more, some of the strongest growth is forecast to come from Australia's mid- and small-cap companies, while valuations remain attractive relative to large caps.
Chart 4: Australian mid and small caps offer better potential EPS growth
Source: FactSet. VanEck. Bloomberg. As at June 2026. Large cap is S&P/ASX 20 Index. Mid cap is S&P/ASX Midcap 50 Index. Small Cap is S&P/ASX Small Ordinaries Index. Past performance is not indicative of future performance.
Investors looking to build a more diversified Australian core may consider VanEck Australian Equal Weight ETF (MVW), which equally weights Australia's largest companies rather than concentrating in the largest names.
Beyond the core, investors can also broaden their exposure across the Australian market. The VanEck S&P/ASX MidCap ETF (MVE) focuses on Australia's mid-cap companies, a part of the market that has historically offered an attractive balance between earnings growth and business maturity.
The VanEck Small Companies Masters ETF (MVS) looks even further afield, combining growth, valuation and profitability to build a portfolio of high-quality small companies rather than simply owning the broader small-cap index.
For investors strengthening their Australian core, history offers a useful guide. Historically, when Australia's share market has become this concentrated, equal-weight strategies have often performed better over the following five years.
Chart 5: When the index is this concentrated, equal weight has historically outperformed
Source: VanEck. Top 10 = 49.12% as at 31 May 2026. Equal weight is MVIS Australia Equal Weight Index. 184 monthly start points, 2006-2021, 5-year forward windows. Past performance is not indicative of future performance.
While history is no guarantee of future returns, it reinforces a simple principle: diversification tends to become more valuable when markets become more concentrated. MVW has outperformed the S&P/ASX 200 by 1.65% over the past three months and since its 2014 inception, has outperformed the S&P/ASX 200.
The sweet spot of the market
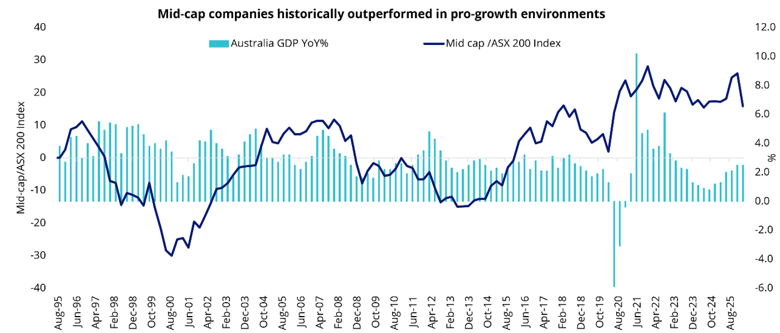
Australian mid-cap companies occupy a sweet spot in the market. They are typically more established than emerging small companies but still have meaningful scope to grow earnings. Analysts expect company profits in this part of the market to grow much faster than Australia's largest companies, while valuations are still around their long-term averages.
MVE provides exposure to this often-overlooked part of the market through the S&P/ASX MidCap 50 Index. For investors looking to complement a large-cap Australian allocation, it offers access to businesses with greater growth potential, without moving too far down the risk spectrum.
Chart 6: Mid-cap companies have historically outperformed when economic conditions are resilient
Source: Bloomberg. VanEck. Mid Caps is S&P/ASX 50 Mid Cap Index. Large Caps is S&P/ASX 200 Index. 31 May 2026. Past performance is not indicative of future performance. You cannot invest in an index.
Finding growth at a reasonable price
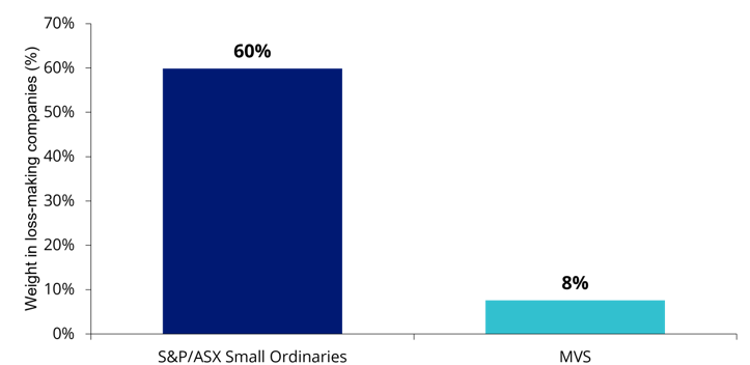
Smaller companies have also historically rewarded patient investors, but broad small-cap indices also contain many speculative and loss-making businesses. MVS looks for smaller companies with a combination of strong growth prospects and reasonable valuations, while avoiding many businesses that are still losing money. As the chart below shows, just 8% of MVS is invested in loss-making companies, compared with around 60% for the Small Ordinaries Index.
Chart 7: MVS vs small cap index: weight of loss making companies
Source: VanEck, FactSet, as at 30 June 2026. Negative trailing Annual EPS, 98% coverage.
Now is the time to build a more resilient portfolio
No one can predict exactly how Australia's economy will evolve over the next few years. Growth may surprise on the upside, inflation may prove more persistent, or global conditions could shift again.
Investors can't control markets, but they can control how they build their portfolio.
A more challenging domestic backdrop is a reminder that returns need not come from a handful of mega-cap companies or a single part of the market. Strengthening your foundation exposure to Australian equities with equal weighting, complementing it with quality, and seeking growth where valuations remain compelling can create a more resilient portfolio for whatever comes next. Simply buying the index may no longer be enough in a slower growth world.
Key risks
An investment in the ETFs carries risks. These include risks associated with financial markets generally, individual company management, industry sectors, country, stock and sector concentration, fund operations and tracking an index. Investors should read the relevant PDS and TMD for details before making any investment decision.


Published: 13 July 2026
Any views expressed are opinions of the author at the time of writing and is not a recommendation to act.
VanEck Investments Limited (ACN 146 596 116 AFSL 416755) (VanEck) is the issuer and responsible entity of all VanEck exchange traded funds (Funds) trading on the ASX. This information is general in nature and not personal advice, it does not take into account any person’s financial objectives, situation or needs. You should consider whether or not an investment in any Fund is appropriate for you. Investments in a Fund involve risks associated with financial markets. These risks vary depending on a Fund’s investment objective. Refer to the applicable product disclosure statement (PDS) and target market determination (TMD) available at vaneck.com.au for more details. Investment returns and capital are not guaranteed.