China stimulus to boost Australian resources stocks
Growing expectations of a potential economic stimulus package in China could give Australian resources stocks a boost.
After the initial strong rebound in the Chinese economy late last year, investors are looking for clues about what the growth trajectory may be going forward. So far, China’s central bank, the PBoC has taken a drip-feed approach on the monetary front. However, there are hopes a symbolic cut of 10bps in the one-year and five-year loan prime rates last week could be a sign of more cuts and more fiscal stimulus from the Chinese government in the months ahead.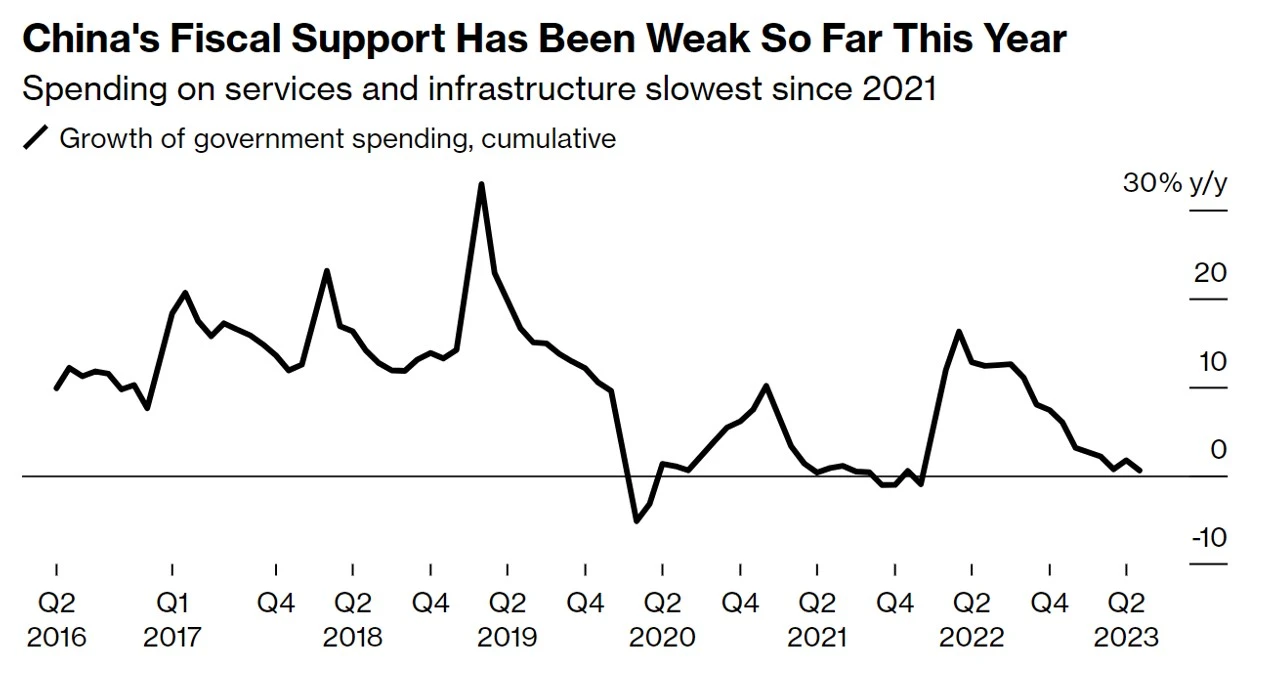
Source: China Ministry of Finance; Bloomberg. Note: Data covers two main budgets - the general budget and the capital spending budget.
China's infrastructure investment has been a major driving force in the past to prop up the economy, most noticeably during the GFC era. While the year-on-year growth has come down in recent years, infrastructure remains a key priority for the country, the Wall Street Journal recently reporting Beijing is planning major steps to revive the country’s economy, including the possibility of $US140 billion of new infrastructure spending.
Infrastructure is a major contributor to China’s GDP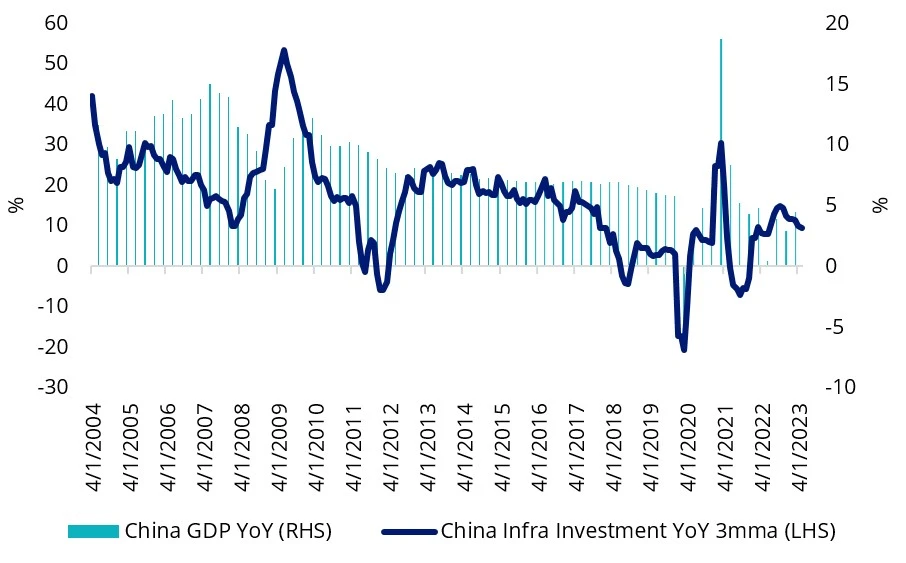
Source: Bloomberg as at 31 May 2023. 3mma means 3 month moving average.
If China’s fiscal stimulus package comes through, we would expect Australian resources companies to become a major beneficiary as the increased demand for resources would drive up prices. According to the government data1, Australia’s mining sector accounts for approximately 13.7% GDP and over two-thirds of the country’s total merchandise exports, while China tops the list of Australia’s resources and energy exports at $140 billion in 2021-22.
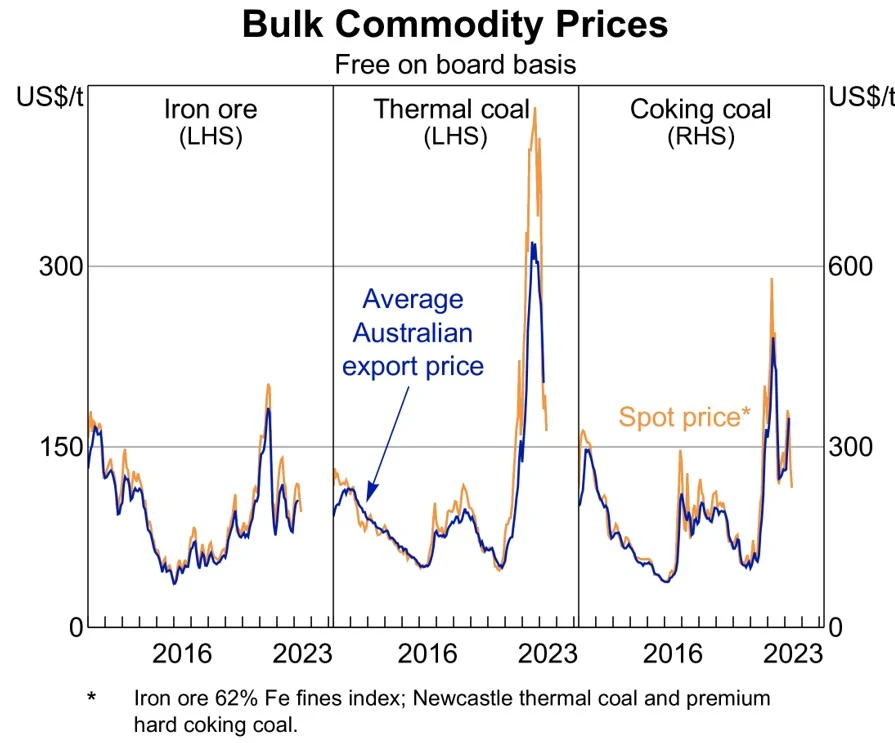
Source: ABS; Bloomberg; McCloskey by OPIS; RBA.
Iron ore, for instance, is a critical component in the construction of infrastructure projects.
Fortescue, Australia's third-largest iron ore miner after Rio Tinto and BHP Group, has close to 88% of revenue generated out of China.
Revenue attribution from China (%)
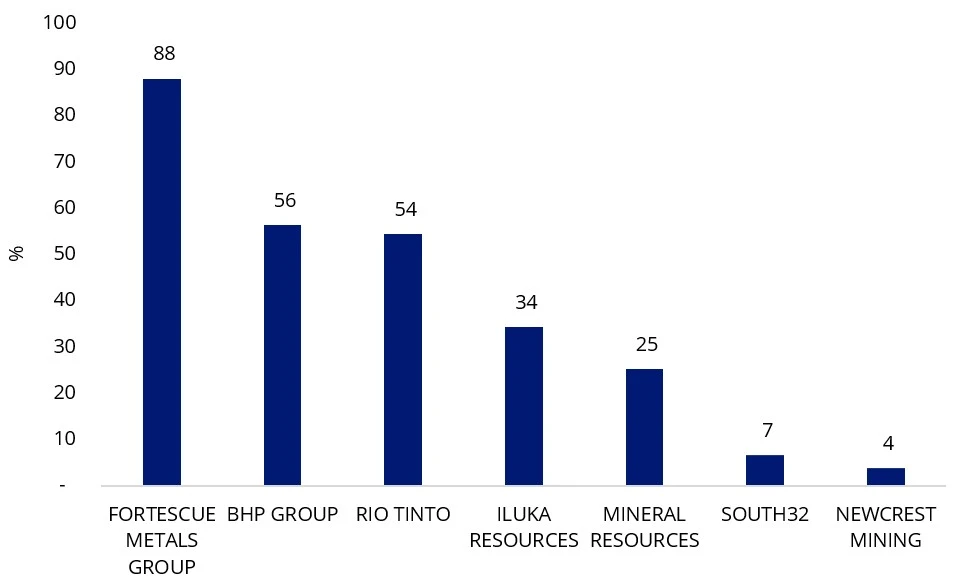
Source: Bloomberg, company annual reports
On the day that China cut rates, iron ore prices rose to over USD$114.30 a tonne and have rebounded about 6 per cent since June 6 2023.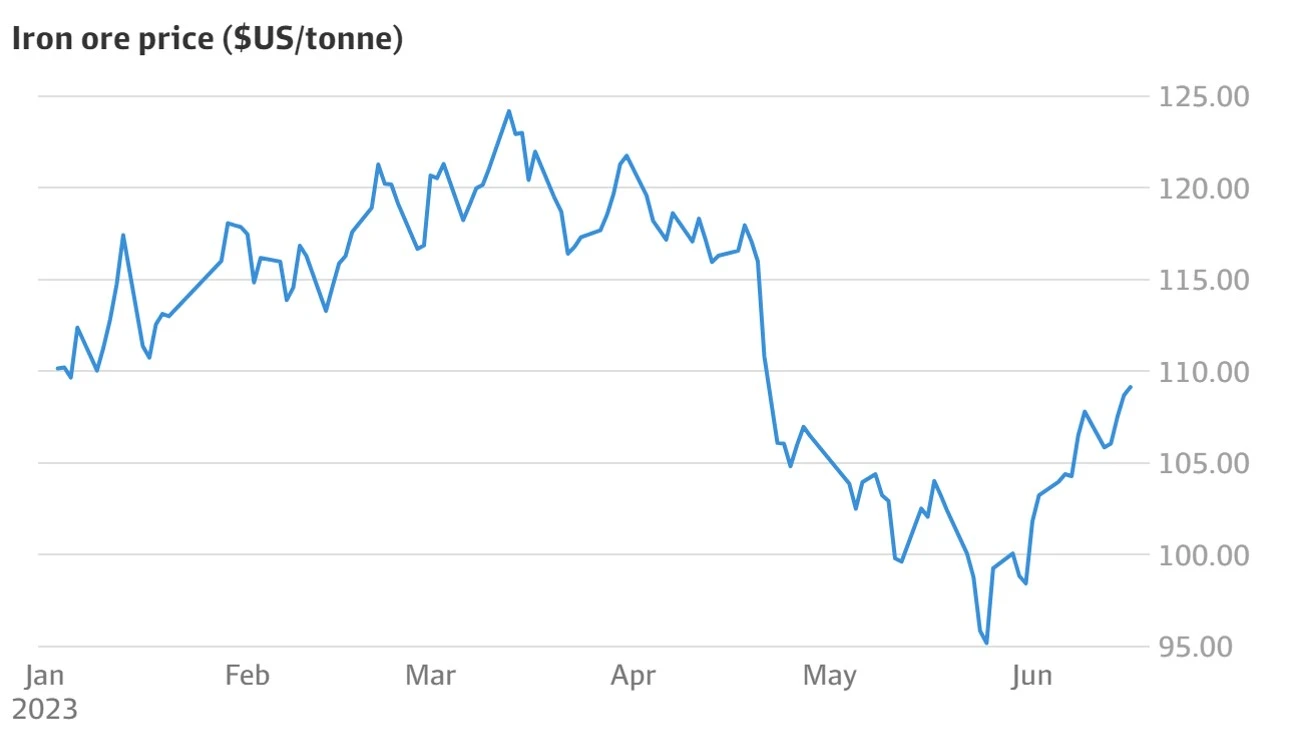
Source: Bloomberg.
Considering China’s need to revive the economy post pandemic, an acceleration of the infrastructure push could take Australian resources stocks higher.
China cuts main interest rates to bolster growth
As mentioned above, last week the PBoC cut its one-year loan prime lending rates (LPR) for the first time in 10 months by 10 basis points from 3.65 per cent to 3.55 per cent and five-year lending rates by 10 basis points to 4.2 per cent. But more meaningful cuts may be on the horizon, Goldman Sachs analysts wrote in a note on Tuesday; “We continue to expect further policy easing measures to be announced in the next few weeks, especially on fiscal, housing and consumption, although the magnitude of stimulus should be smaller than in previous easing cycles.”
The Chinese central bank is reducing key rates to encourage bank lending and is also looking at a round of stimulus aimed at the real estate sector which makes up more than a quarter of the Chinese economy. The Chinese property sector has been hit hard by the fall-out from the crackdown on developer debt.
The injection of economic stimulus and move to cut lending rates means iron ore prices and miners could record a strong second half of 2023 as the world’s second largest economy needs materials and resources to build infrastructure and develop property.
Access to Australian resources
The VanEck Australian Resources ETF (ASX: MVR) tracks the MVIS Australia Resources Index offering investors broad exposure to the Australian resources sector. The ETF provides overweight exposure to oil & gas refining, gold, coal, and aluminium relative to the S&P/ASX 200 Resources index.
GICs sub industry breakdown: MVR versus S&P/ASX 200 Resources
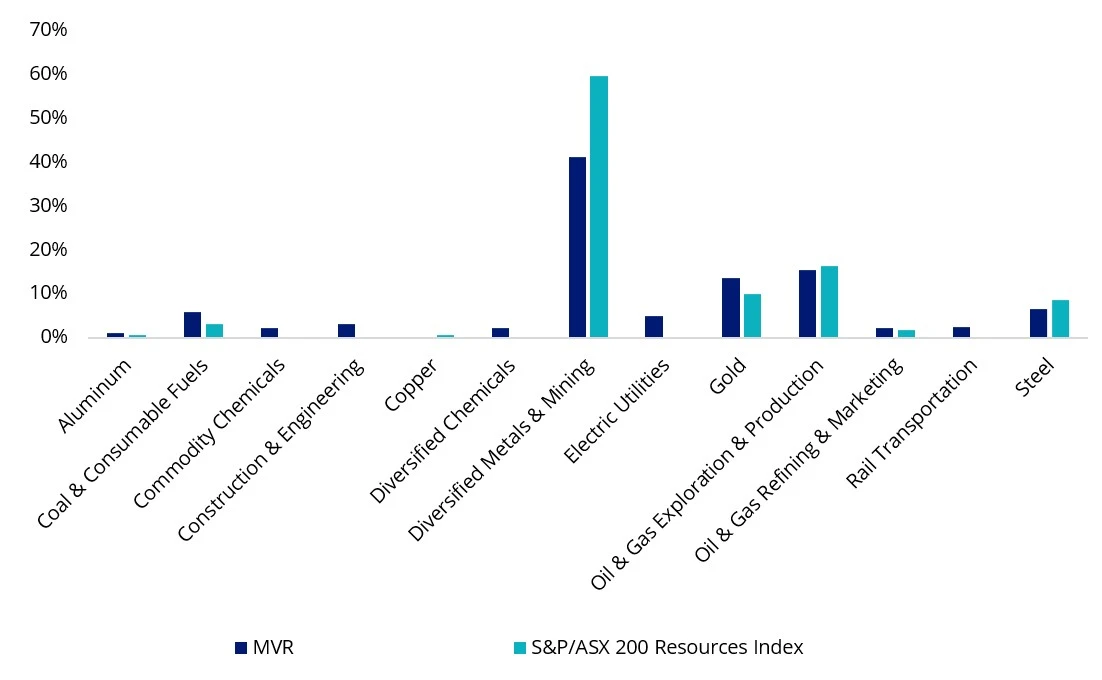
Source: FactSet as at 31 May 2023.
Key Risks
An investment in the ETF carries risks associated with: financial markets generally, individual company management, industry sectors, stock and sector concentration, fund operations and tracking an index. See the PDS for details.


Published: 23 June 2023
1Resources and Energy Quarterly, March 2023. https://www.industry.gov.au/sites/default/files/2023-04/resources-and-energy-quarterly-march-2023.pdf
Any views expressed are opinions of the author at the time of writing and is not a recommendation to act.
VanEck Investments Limited (ACN 146 596 116 AFSL 416755) (VanEck) is the issuer and responsible entity of all VanEck exchange traded funds (Funds) listed on the ASX. This is general advice only and does not take into account any person’s financial objectives, situation or needs. The product disclosure statement (PDS) and the target market determination (TMD) for all Funds are available at vaneck.com.au. You should consider whether or not an investment in any Fund is appropriate for you. Investments in a Fund involve risks associated with financial markets. These risks vary depending on a Fund’s investment objective. Refer to the applicable PDS and TMD for more details on risks. Investment returns and capital are not guaranteed.
MVIS Australia Resources Index (‘MVIS Index’) is the exclusive property of MV Index Solutions GmbH based in Frankfurt, Germany (‘MVIS’). MVIS is a related entity of VanEck. MVIS makes no representation regarding the advisability of investing in the Fund. MVIS has contracted with Solactive AG to maintain and calculate the MVIS Index. Solactive uses its best efforts to ensure that the MVIS Index is calculated correctly. Irrespective of its obligations towards MVIS, Solactive has no obligation to point out errors in the MVIS Index to third parties.