Expert Analysis: Australian Resources
One sector that has received a lot of attention from investors has been resources. The problem for ASX investors is that the resources sector is dominated by one single stock, that just got a whole lot bigger. Here we provide some insightful analysis of our popular of VanEck Australian Resources ETF (MVR) which tracks an index that has a simple way of ensuring diversification so no single stock dominates.
Most Australian investors have exposure to the resources sector. The resources sector has been one of the pillars of Australia’s economy and our biggest exporter. Most Australian investors have exposure to this sector directly, either via a single blue chip or indirectly, via a fund.
Investing in resources requires specialist knowledge that many stock pickers do not have and that is why some investors prefer to utilise resource sector ETFs to gain additional resources exposure.
Many resources funds follow market capitalisation indices. A limitation of a market capitalisation index is the potential for concentration, and the Australian resources market captalisation index, the S&P/ASX 200 Resources Index is an example of this.
BHP recently consolidated its Australian and UK listings into a single entity on ASX. As a result, BHP is over 43% of the S&P/ASX 200 Resources Index. In other words, if you invest in a fund that tracks this index, you are investing two fifths of your money in just one company. It also means BHP has the ability to be the single driver of performance for the entire sector, which adds a layer of unintended risk. BHP is also a company many investors already own, either directly or indirectly.
Chart 1: BHP weighting in S&P/ASX 200 Resources Index since 2001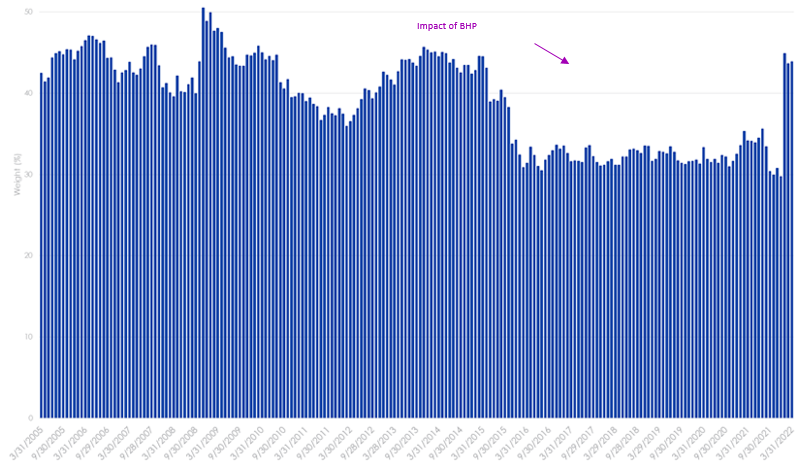
Source: VanEck, FactSet, as of 31 January 2021
MVR’s ‘smarter’ approach
VanEck Australian Resources ETF (MVR) tracks the MVIS Australia Resources Index. This index is a ‘smart beta’ index, which means it is constructed differently to the market capitalisation index.
The MVIS Australia Resources Index caps its holdings at 8%. What this means is that MVR is not just a proxy BHP exposure. At rebalance, no stock, including BHP, is more than 8%. The impact of this capping is that it reduces the dominance of the mega/large-cap stocks and increases exposure to mid-caps.
So let’s walk through the difference between MVR and the S&P/ASX 200 Resources Index.
MVR and the S&P/ASX 200 Resources Index - Top 10 holdings
Below you can see the top 10 companies. The differences are stark – to see all the holdings in MVR and its weightings click here.
Table 1: Top 10 holdings MVR Table 2: Top 10 S&P/ASX 200 Resources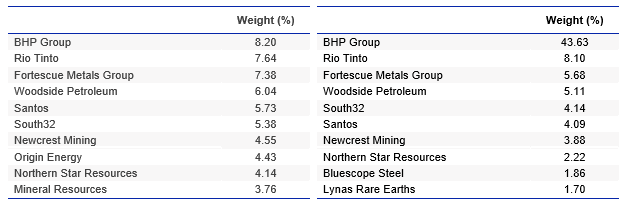
Source: FactSet, VanEck, MVIS, as at 31 March 2022 Source: FactSet, VanEck, S&P, as at 31 March 2022
MVR and the S&P/ASX 200 Resources Index – Sub-sector exposures
MVR is currently underweight the diversified metals and mining sectors compared to the S&P/ASX 200 Resources Index. BHP sits in this sector. Conversely, MVR is overweight the oil subsectors, gold, coal, copper and aluminium.
Chart 2: S&P/ASX 200 Resources and MVR sub sector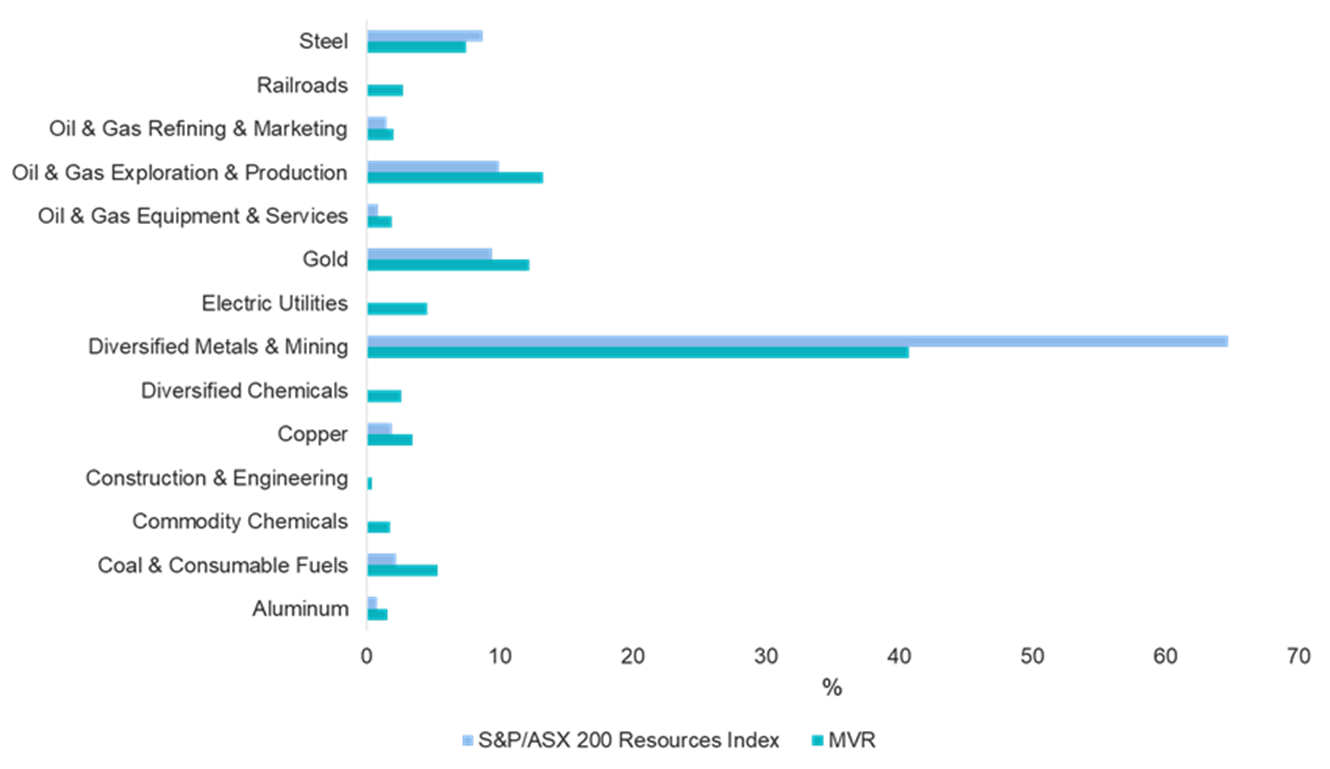
Source: FactSet, 31 March 2022
MVR vs S&P/ASX 200 Resources - Performance
MVR offers investors broad exposure to the resources sector, tracking the performance of the largest and most liquid ASX-listed resources companies. The ETF has outperformed the S&P/ASX 200 Resources Index by 1.28% p.a. since its inception. As always, past performance is not indicative of future performance.
Chart 3: Cumulative performance since MVR inception date to 31 March 2022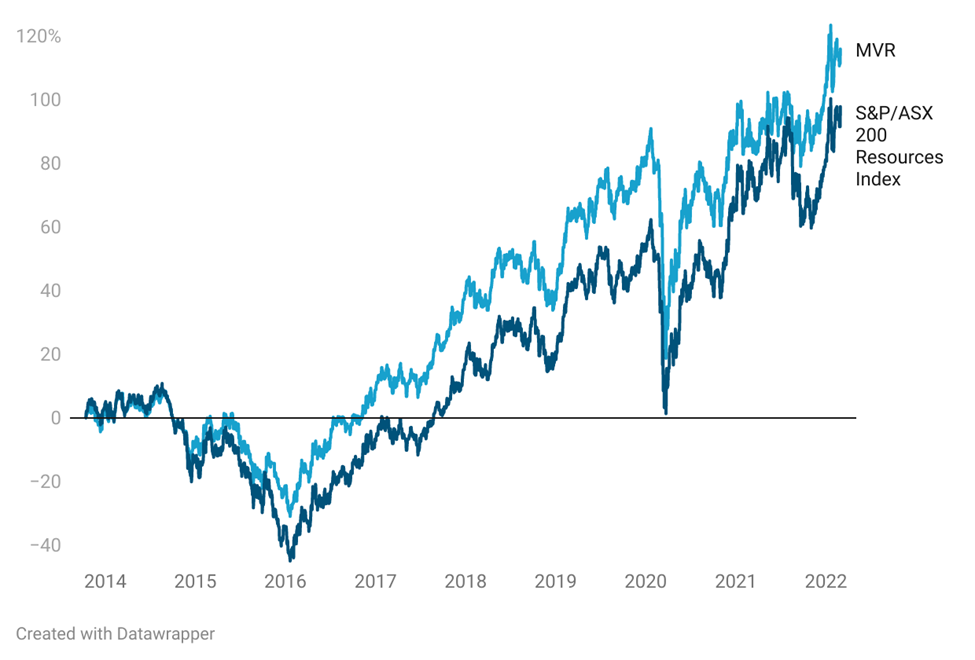
|
1 Month (%) |
3 Months (%) |
1 yr (%) |
3 yrs (% p.a.) |
5 yrs (% p.a.) |
7 yrs (% p.a.) |
Since Inception* (% p.a.) |
|
|
MVR |
10.38 |
16.88 |
29.63 |
13.53 |
16.34 |
14.09 |
10.81 |
|
S&P/ASX 200 Resources |
9.87 |
20.36 |
28.38 |
14.80 |
18.01 |
13.45 |
9.61 |
|
Difference |
+0.51 |
-3.48 |
+1.25 |
-1.27 |
-1.67 |
+0.64 |
+1.20 |
Chart 3 and Table 3 source: Morningstar Direct, VanEck as at 31 March 2022. The chart and table above show past performance of MVR and of the S&P/ASX 200 Resources Index. You cannot invest directly in an index. Results are calculated to the last business day of the month and assume immediate reinvestment of distributions. MVR results are net of management fees and other costs incurred in the fund, but before brokerage fees and bid/ask spreads incurred when investors buy/sell on the ASX. Returns for periods longer than one year are annualised. Past performance is not a reliable indicator of future performance. The S&P/ASX 200 Resources Index is shown for comparison purposes as it is the widely recognised benchmark used to measure the performance of the resources companies included in the S&P/ASX 200, weighted by market capitalisation. MVR’s index measures the performance of the largest and most liquid ASX-listed companies that generate at least 50% of their revenues or assets from the Australian resources sector, with a maximum weight of 8% in each company at rebalance. Consequently it has fewer companies and different industry allocations than the S&P/ASX 200 Resources Index. Click here for more details.
MVR vs S&P/ASX 200 Resources Index- Style
When looking at portfolios it is important to determine what style (e.g. value or growth) and what size bias a portfolio holds (e.g. giant, large, mid or small). Below we can see MVR’s. Importantly MVR holds large companies with a similar value orientation relative to the S&P/ASX 200 Resources Index, which has a giant-cap bias.
Chart 4: MVR holdings based style map Chart 5: S&P/ASX 200 Resources Index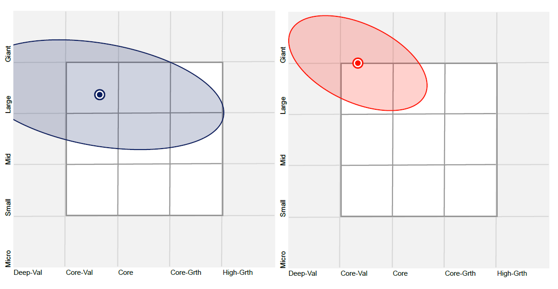
Source: Morningstar Direct, as at 31 March 2022
While each Australian resources ETF has its merit for portfolio inclusion, you should assess all the risks and consider your investment objectives.
Past performance is no guarantee of future performance. The above is not a recommendation. Please speak to your financial adviser or stock broker.
For further information you can email us or call on us on +61 2 8038 3300.
Key risks
An investment MVR carries risks associated with: ASX trading time differences, financial markets generally, individual company management, industry sectors, country or sector concentration, political, regulatory and tax risks, fund operations and tracking an index. See the PDS for details.


Published: 08 April 2022