The ASX concentration risk is rising
Concentration in Australian Equities is a risk, and the Australian share market, as represented by the S&P/ASX 200, is one of the most concentrated in the world.
We have conducted an analysis that shows that it has recently become more concentrated, and it has done so at a fast pace.
In the past, when this dynamic was witnessed, it has historically been followed by a period of relative outperformance of equal weighting relative to market capitalisation, noting, of course, that past performance should not be relied upon for future performance.
Concentration in the media
Our research on ASX concentration risk was featured in two articles in the Australian Financial Review:
- a front-page markets piece by Alex Gluyas: Super funds at risk as war triggers ‘overcrowding’ of the ASX;
- a Chanticleer column by James Thomson: Iran shock will lock in the downturn we have to have .
This coverage reinforces the idea that concentration in the S&P/ASX 200 is rising at a pace not seen outside of a crisis, and historically these are the conditions that have coincided in the past with periods when equal weighting outperforms market capitalisation (noting, as always, past performance is not indicative of future performance).
We think it is worth reinforcing why we think this matters for portfolio construction right now.
The concentration signal
The top 10 stocks in the S&P/ASX 200, as at the 27thMarch 2026, account for 49.2% of the index, up from 45.6% in November 2025. That increase of 3.6% in just four months is faster than during COVID (43.9% to 46.7% in three months) and faster than the first four months of the GFC. The only period with sharper moves was late 2008, at the peak of the financial crisis.
We examined 20 years of monthly S&P/ASX 200 constituent data to test whether concentration at the start of a period predicts subsequent equal-weight outperformance. The chart below plots each monthly observation up until the 28thFebruary 2026, with concentration on the x-axis and the subsequent five-year return difference between the MVIS Australia Equal Weight Index and the S&P/ASX 200 on the y-axis. The vertical line marks where concentration sits today. In the first 27 days of March, this has risen to 49.2%. It’s important to note that circumstances may differ in the future, and historical analysis is not a reliable indicator of future performance.
Chart 1: Concentration in the S&P/ASX 200
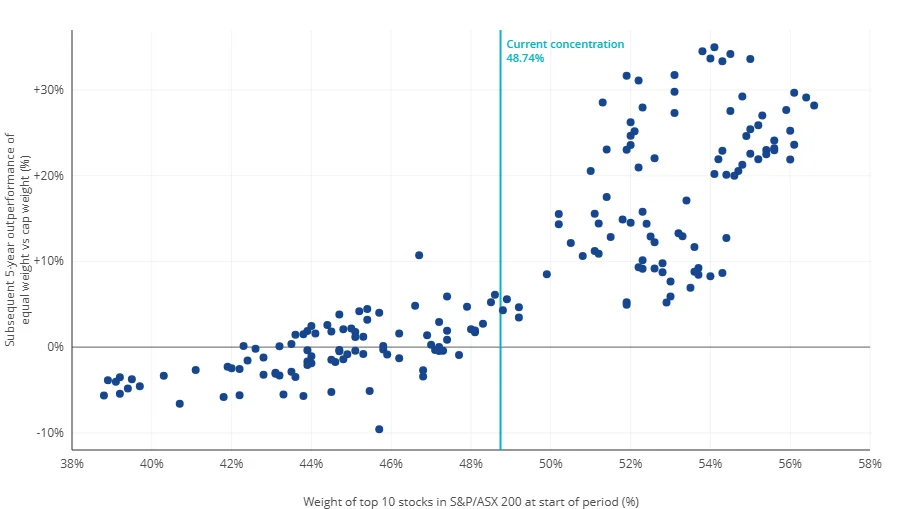
Source: MarketVector, S&P, FactSet. Month-end observations February 2006 to March 2026. Current concentration as at 31 March 2026.
The key findings:
- When concentration has been at or above its long-run average (48.6%), equal weighting has outperformed over the following five years in every single observation. 91 out of 91. A 100% hit rate, with average cumulative outperformance of +15.5%.
- At concentration levels similar to today (48-50%), the historical win rate is 86%, with average cumulative outperformance of +4.0%.
- At March 2021 levels (45.5%), the win rate was just 35%, with average cumulative underperformance of -1.6%. We believe the regime has shifted.
- Concentration peaked at 56.6% in April 2013 during the post-GFC bank and mining boom. That period produced the strongest outcomes in our dataset, with average five-year outperformance of +22.1%. There remains significant headroom from today's level to that peak.
The direction of travel matters. If the current macro uncertainty persists and concentration continues to rise, as the AFR's Chanticleer column today suggests it is likely under HSBC's scenario of sustained oil above US$100, the forward case for equal weight strengthens with every tick higher.
The dividend yield spread
The concentration signal is reinforced by the dividend yield picture. The chart below compares MVW's rolling 12-month excess return over the S&P/ASX 200 (dark blue) against the difference in dividend yields between the two (light blue), alongside the long-term average of that spread (orange).

Source: Factset, As at 31 March 2026. Not a recommendation to act. Past performance is not indicative of future performance.
The yield spread is at its widest level on record. In 2015 and again in 2021, when this spread was elevated and then reverted toward average, MVW outperformed. We think the current setup is analogous.
Valuations favour the breadth of the market
The recent drawdown has made valuations outside the mega-caps increasingly attractive. Large caps remain at the upper bound of their historical forward PE range. Mid-cap, equal weight and small-cap valuations are close to or below their historical averages. Forecast EPS growth also skews heavily toward companies outside the top 10.

Source: Bloomberg. Large cap is S&P/ASX 20 Index. Mid cap is S&P/ASX Midcap 50 Index. Small Cap is S&P/ASX Small Ordinaries Index. Data from 31 January 2015 to 31 March 2026. Past performance is not indicative of future performance. You cannot invest in an index.
Equal weight in rate-rising environments
The RBA has now hiked rates twice since the start of the year. Going back to previous hiking cycles, the MVIS Australia Equal Weight Index has outperformed.

Source: VanEck, Bloomberg. Small Cap is ASX Small Ords Index. Mid Cap is ASX Mid 50 Index. Large Cap is ASX 20 Index. Equal weight is MVIS Australia Equal Weight Index. Performance in AUD. Past performance is not indicative of future performance. You cannot invest an Index.
The portfolio construction case
The concentration data, the dividend yield spread, the valuation picture and the rate environment are all pointing in the same direction. We think this convergence makes a compelling case for reducing concentration risk in Australian equity portfolios.
While no one knows what will happen for the rest of 2026, we think diversification, rather than concentration, is a prudent approach.
The VanEck Australian Equal Weight ETF (MVW) is a portfolio construction solution that reduces concentration to banks and can be deployed to diversify without one security or sector dominating, providing a more balanced exposure to Australia's economy.
In rate rising environments have also, in the past, been a period when MVW has outperformed the S&P/ASX 200; we also think that the current dividend yields of MVW, relative to the S&P/ASX 200, support its consideration.
We also think smaller companies, i.e. smaller-sized than the mega-caps, may present an opportunity at current valuations.
Another diversification tool is our VanEck Australian Long Short Complex ETF (ALFA), which uses a dynamic quantitative stock selection approach utilising sophisticated computations and programmed learning designed to be agnostic of market cycles and style rotations.
The VanEck Australian Long Short Complex ETF (ALFA) monetises the same concentration distortion actively, running a long book of quality businesses that the market tends to be underweight and a short book of those expected to underperform. In a way, MVW and ALFA are complementary expressions of the same insight: the ASX is systematically distorted by concentration.
Key risks
An investment in the ETFs carries risks. For MVW these include risks associated with financial markets generally, individual company management, industry sectors, fund operations and tracking an index. ALFA is considered to have a higher investment risk than a comparable fund that does not engage in short selling and leverage. Investors should actively monitor their investment as frequently as daily to ensure it continues to meet their investment objectives. Risks associated with an investment in ALFA include those associated with short-selling risk, leverage risk, prime broker risk, counterparties risk, concentration risk, operational risk and material portfolio information risk. See the relevant PDS and TMD for details.


Published: 16 April 2026
Any views expressed are opinions of the author at the time of writing and is not a recommendation to act.
VanEck Investments Limited (ACN 146 596 116 AFSL 416755) (VanEck) is the issuer and responsible entity of all VanEck exchange traded funds (Funds) trading on the ASX. This information is general in nature and not personal advice, it does not take into account any person’s financial objectives, situation or needs. The product disclosure statement (PDS) and the target market determination (TMD) for all Funds are available at vaneck.com.au. You should consider whether or not an investment in any Fund is appropriate for you. Investments in a Fund involve risks associated with financial markets. These risks vary depending on a Fund’s investment objective. Refer to the applicable PDS and TMD for more details on risks. Investment returns and capital are not guaranteed.