BHP – Bet Heavy, Pray
Last week, an active Australian equity manager proudly announced BHP as their largest holding at 10%, their biggest single position. Yet if BHP outperforms the S&P/ASX 200, they'll still underperform. That is not what they are aiming to achieve.
Actively managed funds aim to outperform the fund’s benchmark index. In Australia, most active Australian equity funds use the S&P/ASX 200 as the index they are trying to beat.
So, if the S&P/ASX 200 Index returns 10%, the active Australian equities fund aims to outperform it by returning more than 10%. If the benchmark index falls 10%, the fund’s goal is to fall less than 10%.
To outperform a benchmark index, an active fund manager will buy stocks they expect to outperform the rest of the index and sell, or not hold, stocks they expect to underperform.
Think about that active manager announcing his biggest bet, BHP. At 10%, the active fund is underweight BHP, because that company is 11% of the S&P/ASX 200 Index. If BHP outperforms the rest of the index, this active fund will still underperform. To outperform, the fund would need to have more than the index weight.
We think this highlights a structural issue of the Australian equities market and the S&P/ASX 200 Index. It is a concentrated bet on a few companies, not a deep and diversified investment universe.
Investors buying a diversified Australian equity strategy would think it is unlikely that two stocks would be 22% of the portfolio, nor would they think two sectors represent over 50% of the portfolio. This is a risk: Concentration risk.
Nothing highlighted this more than the post-budget fall of CBA. Australia’s 2ndlargest company fell by over 10% on Wednesday.
Concentration makes sense if you have high conviction in these stocks and sectors, but for a core strategic allocation, it introduces unintended risk.
Professional active managers don’t want to take those types of bets. It’s a risk they are not willing to take, so why should you? We think this is the takeaway of an active manager rotating into the Big Australian, but their biggest single exposure is at a weight less than the market index.
When you buy a low-cost fund that tracks the Australian Index, you are, in effect, taking this bet. The lion's share of your investment is a bet on a few stocks and a couple of sectors.
That is not diversification and is therefore, in our opinion, not prudent risk management.
There is another way to express portfolio ideas while managing concentration risk. It starts with the index.
Managing Australian share market risk with alternative weighting
Rather than constructing an index or a portfolio using constituents’ size, as the S&P/ASX 200 or S&P/ASX 300 do, an alternative method is to equally weight constituents. The MVIS Australia Equal Weight Index (MVW Index) includes only the largest and most liquid companies on ASX, currently 76 stocks, and equally weights them once a quarter at each rebalance.
Australian equity market – company weights
Because of the MVW Index’s equal weight construction methodology, at the last rebalance, no company was more than 1.32%. Therefore, MVW, which tracks this index has less stock concentration risk than the S&P/ASX 200. What this means is that if BHP goes own 2% (or CBA falls 10% in a day), its impact on the S&P/ASX 200 is greater than on MVW. Naturally, the reverse is true too, when Australia’s mega-caps do better than the rest of the market, MVW will likely underperform.
On the other side of the coin, there are 60-odd companies MVW holds that have a higher weighting compared to the S&P/ASX 200 and therefore have greater influence on its performance. As Chart 1 below shows, at the end of last month, MVW had a larger exposure than the market capitalisation weighted benchmark index for around 80% of its portfolio (the instances in which the dark blue is higher than the light blue). The companies in which MVW is overweight may be former small and mid-caps that have grown large, or they may be large or mega caps that have fallen in size. Importantly, these companies have much greater potential for growth or are more likely to be taken over than the largest handful of stocks on ASX.
Chart 1: MVW and S&P/ASX 200 Index constituents by size (%) as at 30 April 2026
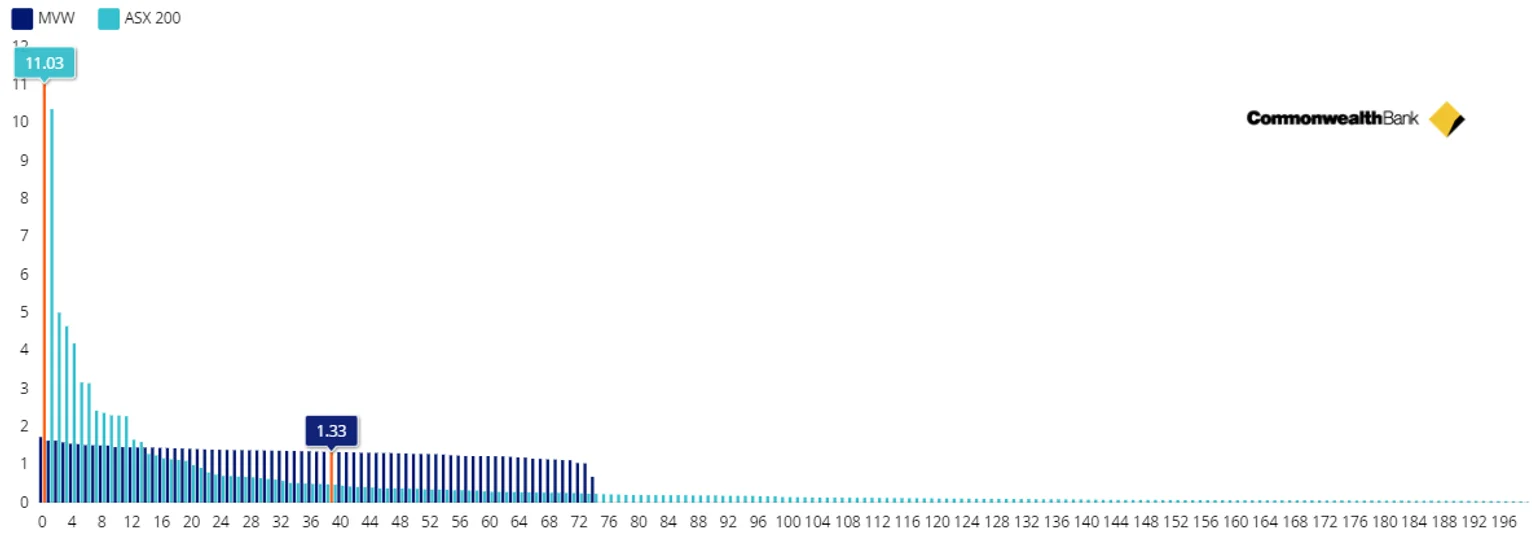
Source: Factset.
Australian equity market – sector weights
Another consequence of the MVW Index’s construction methodology is that MVW will be underweight, relative to the S&P/ASX 200, sectors that contain the larger-than-average companies. For example, the MVW Index is currently underweight the financials sector by 14.9% compared to the S&P/ASX 200. Conversely, it will be overweight sectors that contain smaller-than-average companies. The MVW Index is currently overweight industrials by 8.7% and real estate by 4.7%. Therefore, the MVW Index has less sector concentration risk than the S&P/ASX 200.
Chart 2: MVW and S&P/ASX 200 Index sector breakdown as at 30 April 2026
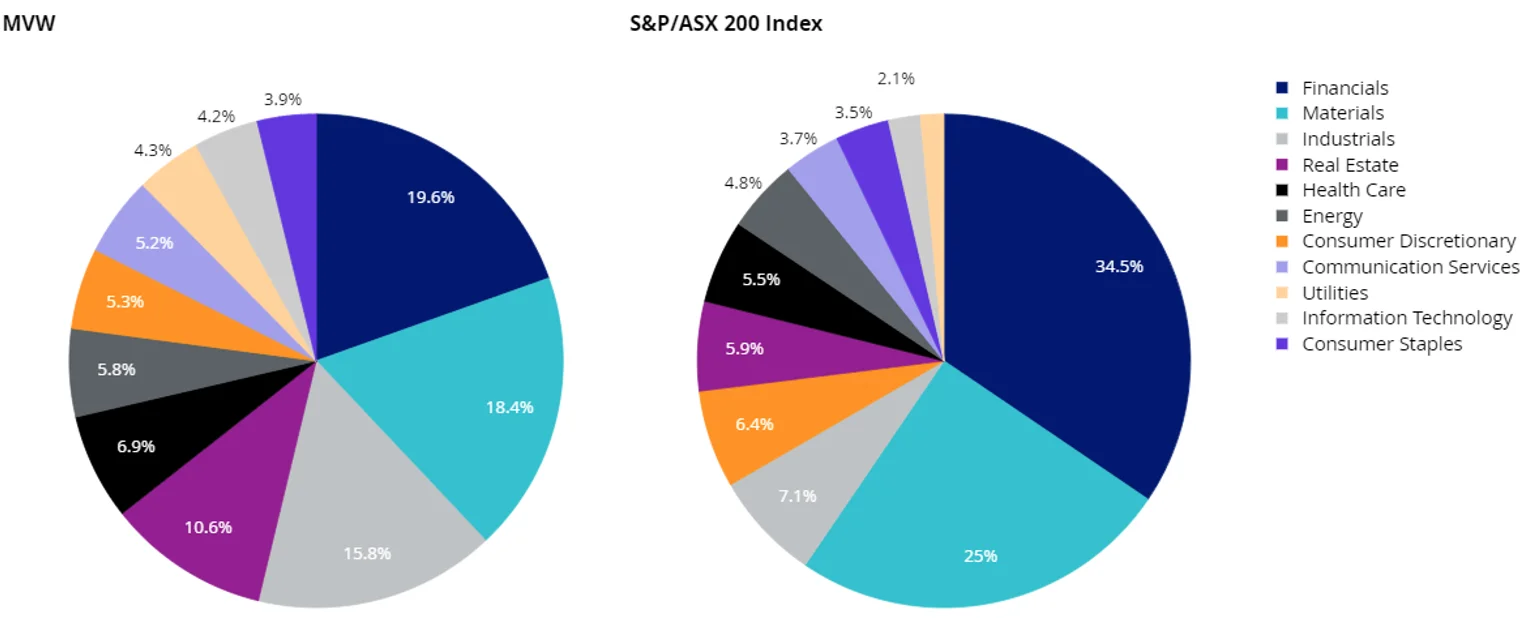
Source: Factset. Sector weightings may change in the future.
MVW vs S&P/ASX 200 Index - Top 10 holdings
Below you can see the top 10 companies. The differences are stark – to see all the holdings in MVW and their weightings, click here. In the S&P/ASX 200, 49% of the portfolio is represented by the top 10. In other words, 190 other companies are squeezed into the remaining 51% of the portfolio. The opposite of diversification.
Table 1&2: Top 10 holdings MVW and Top 10 S&P/ASX 200
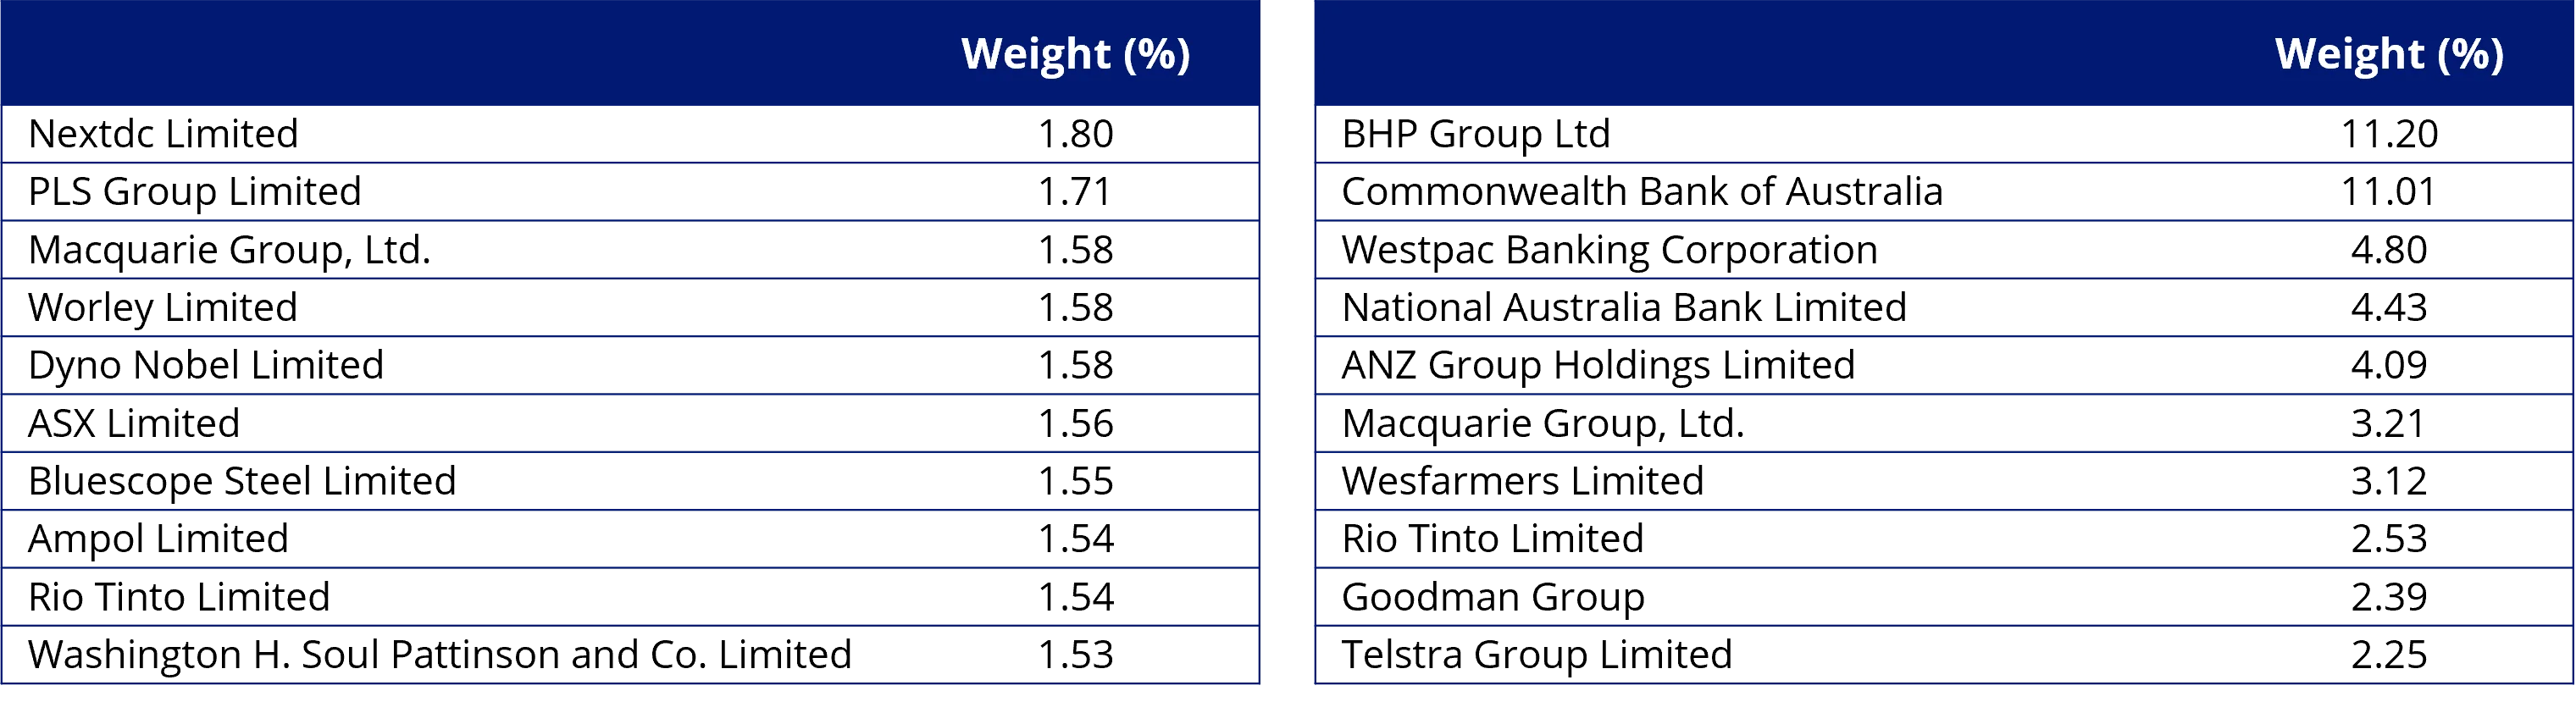
Source: FactSet, VanEck, S&P, MarketVector, as at 11 May 2026.
The reason MVW’s holdings are not equal above is that it only rebalances back to equal weight each quarter. The next rebalance is in June.
Many advisers and their investors are already using MVW as their core Australian equity allocation. Because of its easily understood approach, it is a position around which high-conviction ideas may be added. For example, you can increase your BHP exposure by buying it directly as a satellite exposure or add a resources ETF if you prefer a bigger exposure to that sector.
MVW vs S&P/ASX 200 - Performance
Equal-weight investing has served Australian investors well. Since its inception on ASX in 2014, MVW has outperformed the S&P/ASX 200 Index. What this also means is that over that time, MVW has outperformed ETFs tracking that index. Noting that past performance is by no means indicative of future performance.
Chart 3: Cumulative performance since MVW inception date to 12 May 2026
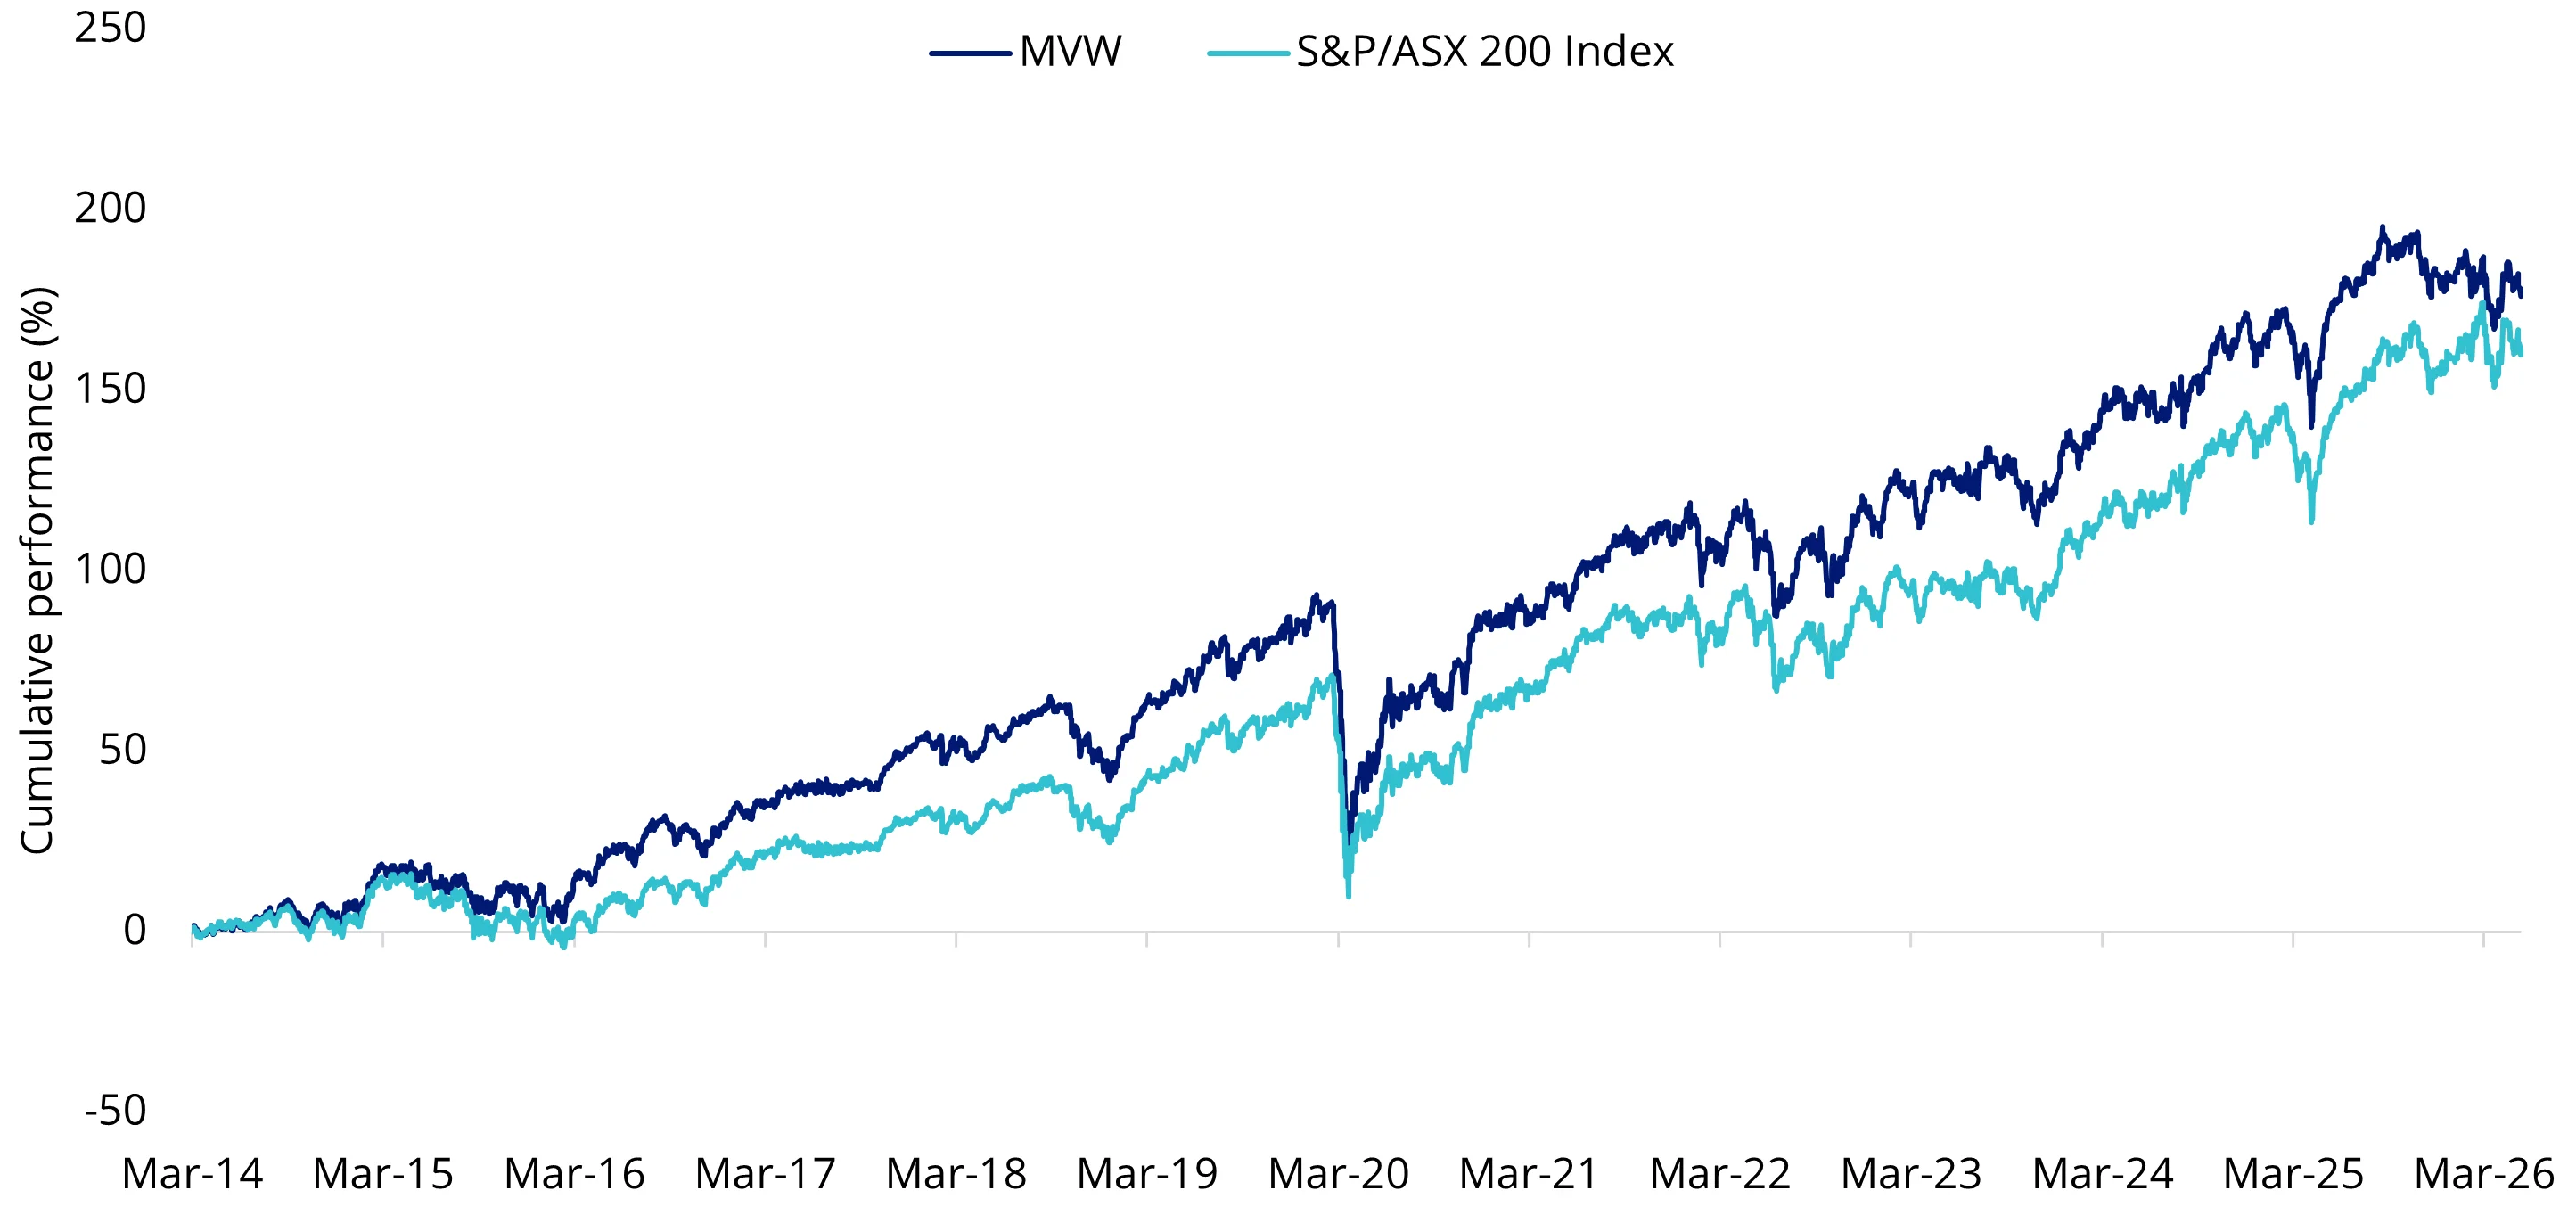
Table 3: Trailing performance to 12 May 2026
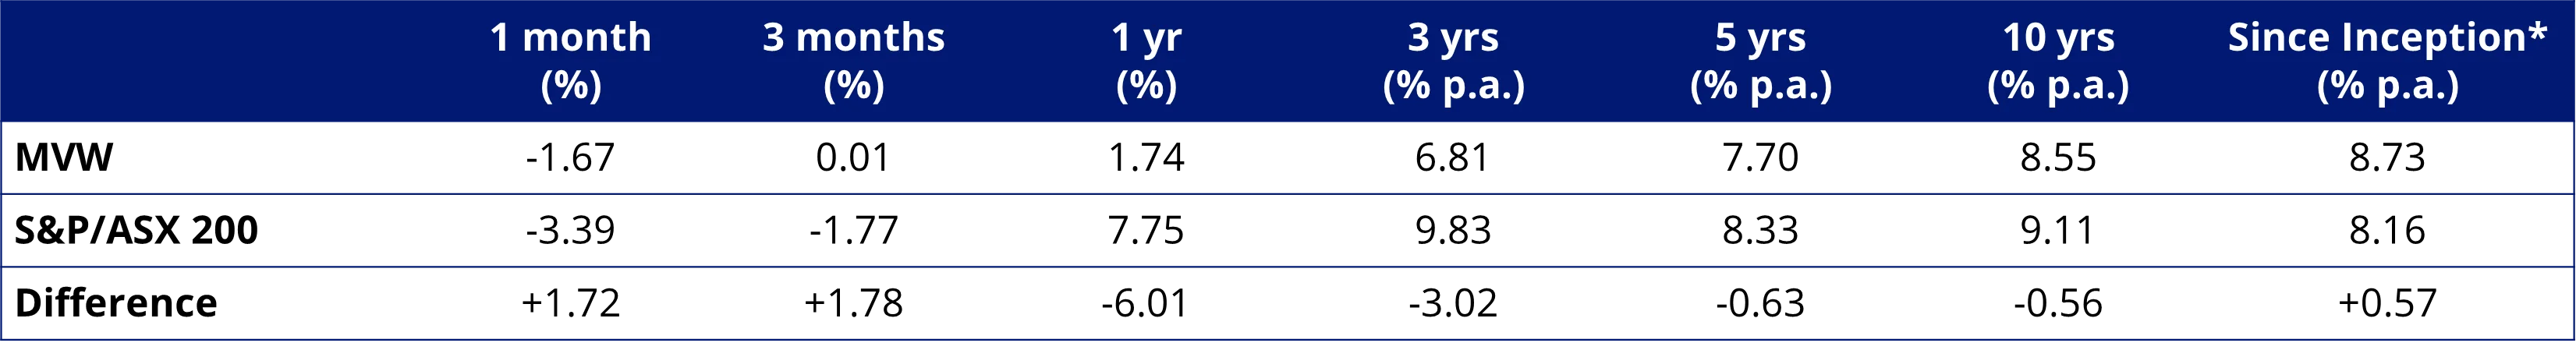
* MVW Inception date is 4 March 2014 a copy of the factsheet is here.
Chart 3 and Table 1 source: Morningstar Direct, VanEck. The chart and table above show past performance of MVW and of the S&P/ASX 200. You cannot invest directly in an index. Results are calculated to the last business day of the month and assume immediate reinvestment of distributions. MVW results are net of management fees and other costs incurred in the fund, but before brokerage fees and bid/ask spreads incurred when investors buy/sell on the ASX. Returns for periods longer than one year are annualised. Past performance is not a reliable indicator of future performance. The S&P/ASX 200 Index is shown for comparison purposes as it is the widely recognised benchmark used to measure the performance of the broad Australian equities market. It includes the 200 largest ASX-listed companies, weighted by market capitalisation. MVW’s index measures the performance of the largest and most liquid ASX-listed companies, weighted equally at rebalance. MVW’s index has fewer companies and different industry allocations than the S&P/ASX 200. Click here for more details.
Key risks
An investment in our Australian equal weight ETF carries risks associated with: financial markets generally, individual company management, industry sectors, fund operations and tracking an index. See the VanEck Australian Equal Weight ETF PDS and TMD for more details.
MVW is likely to be appropriate for a consumer who is seeking capital growth and a regular income distribution, is intending to use the product as a core, minor or satellite allocation within a portfolio, has an investment timeframe of at least 5 years, and has a high risk/return profile.


Published: 15 May 2026
Any views expressed are opinions of the author at the time of writing and is not a recommendation to act.
VanEck Investments Limited (ACN 146 596 116 AFSL 416755) (VanEck) is the issuer and responsible entity of all VanEck exchange traded funds (Funds) trading on the ASX. This information is general in nature and not personal advice, it does not take into account any person’s financial objectives, situation or needs. The product disclosure statement (PDS) and the target market determination (TMD) for all Funds are available at vaneck.com.au. You should consider whether or not an investment in any Fund is appropriate for you. Investments in a Fund involve risks associated with financial markets. These risks vary depending on a Fund’s investment objective. Refer to the applicable PDS and TMD for more details on risks. Investment returns and capital are not guaranteed.
MVIS Australia Equal Weight Index (‘MVIS Index’) is the exclusive property of MarketVector Indexes GmbH ('MarketVector')based in Frankfurt, Germany (‘MVIS’). MVIS is a related entity of VanEck. MVIS makes no representation regarding the advisability of investing in the Fund. MVIS has contracted with Solactive AG to maintain and calculate the MVIS Index. Solactive uses its best efforts to ensure that the MVIS Index is calculated correctly. Irrespective of its obligations towards MVIS, Solactive has no obligation to point out errors in the MVIS Index to third parties.