The reopening: Mach 2
As the Australian economy emerges from the 2021 lockdowns, we expect a similar experience to the emergence from the 2020 lockdowns. Growth is likely to come from companies that are nimble and can pivot to the new normal. There are also tailwinds supporting equal weight investing.
There are tailwinds supporting equal weight investing as we sail into 2022, including the reopening of the economy. As the Australian economy emerges from the 2021 lockdowns, we expect a similar experience to the emergence from the 2020 lockdowns. Growth is likely to come from companies that are nimble and can pivot to the new normal.
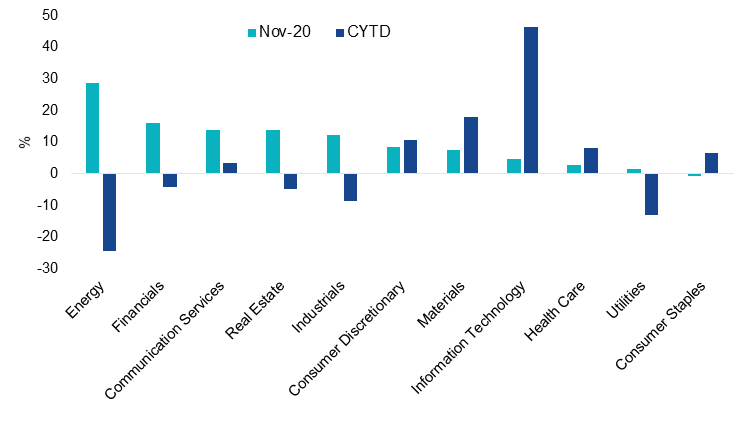
Just prior to Christmas last year, the cogs in the Australian economy were starting to gather momentum and this period coincided with equity markets returns in which value as a style, outperformed growth. For example, energy (as represented by the S&P/ASX 200 Energy Index) shot up 28.45% in November 2020. Both academic and empirical research demonstrates equal weighting’s value tilt.
Australia reopens (again)
The Australian share market faces a tricky period as the Australian economy emerges, for a second time, from COVID-19 induced lock-downs. The best performing stocks will be those that can maintain and grow earnings. Some companies will enjoy robust earnings, but some will be overexposed to slower earnings growth. If we look at the attempted reopening in 2020, we think value stocks may stage a comeback into the end of the year.
Chart 1: S&P/ASX Sector returns in 2020 and during the November 2020 reopening
Source: FactSet. Energy is S&P/ASX 200 Energy Index, Financials is S&P/ASX 200 Financials Index, Communications is S&P/ASX 200 Telecommunications Index, Real Estate is S&P/ASX 200 AREIT Index, Industrials is S&P/ASX 200 Industrials Index, Information Technology is S&P/ASX 200 Information Technology Index, Consumer discretionary is S&P/ASX 200 Consumer Discretionary Index, Materials is S&P/ASX 200 Materials Index, Information Technology is S&P/ASX 200 Information Technology Index, Health care is S&P/ASX200 Heath care Index, Utilities is S&P/ASX 200 Utilities Index, Consumer Staples is S&P/ASX 200 Consumer Staples Index. Past performance is not a reliable indicator of future performance.
You can see in the above that for the first 11 months of 2020, energy was the worst performing sector, but when the economy reopened, it staged a remarkable rally. The same is true of industrials, financials and real estate. Conversely, growth sectors such as consumer discretionary were laggards in November 2020 despite being among the best performers that year.
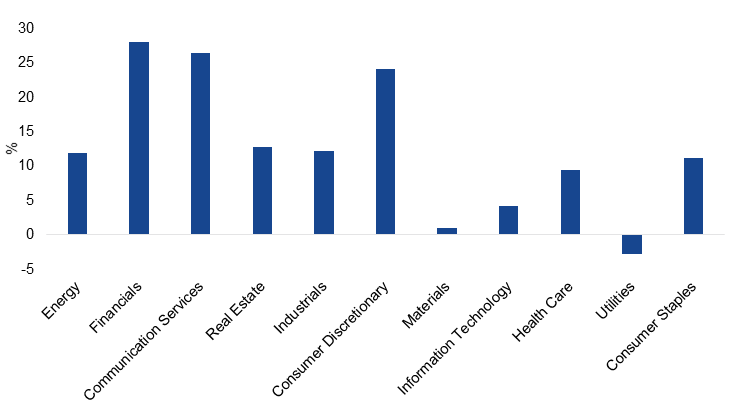
You can see in the chart below ‘value’ sectors have generally underperformed and some growth sectors such as consumer discretionary outperformed as much of the country was forced into lockdown once more. Some laggards could bounce back as the economy reopens just as it did last time. For Australian equity investors, we believe a core strategy should be allocated across all the parts that make up the economy, in a reflation rotation scenario this would include cyclicals such as energy and materials.
Chart 2: S&P/ASX Sector returns so far in 2021

Source: FactSet to 30 September 2021. Energy is S&P/ASX 200 Energy Index, Financials is S&P/ASX 200 Financials Index, Communications is S&P/ASX 200 Telecommunications Index, Real Estate is S&P/ASX 200 A-REIT Index, Industrials is S&P/ASX 200 Industrials Index, Information Technology is S&P/ASX 200 Information Technology Index, Consumer discretionary is S&P/ASX 200 Consumer Discretionary Index, Materials is S&P/ASX 200 Materials Index, Information Technology is S&P/ASX 200 Information Technology Index, Health care is S&P/ASX200 Heath care Index, Utilities is S&P/ASX 200 Utilities Index, Consumer Staples is S&P/ASX 200 Consumer Staples Index. Past performance is not a reliable indicator of future performance.
Remember too that the COVID-19 shut downs have forced the Australian Government and the RBA to undertake unprecedented levels of stimulus that has contributed to strong equity returns over the past 18 months. With this in mind, we think mergers and acquisitions (M&A) will likely be part of the recovery process in equities given the low interest rate environment. In the past M&A activity has traditionally benefited the large-, mid- and smaller- caps, not the mega caps, as these prospective takeover targets typically have more room from growth. Additionally these companies are more nimble and able to adapt more quickly to changing conditions.
An equal weight Australian equities strategy is well positioned to take advantage of the above. It has better diversification, with greater exposure to more sectors on the ASX, which is dominated by financials and it has more large- and mid-caps.
Discover the Australian Equal Weight ETF (ASX code: MVW).
Published: 21 October 2021


