Fixed Income Update - 2021 year in review
2021 was a difficult year for fixed income investors. Find out what happened and the outlook for 2022.
2021 was a difficult year for fixed income investors. Australian and Global aggregate bond indices returned -2.87% and -1.53% respectively (chart 1). This was the worst calendar year performance for Australian bonds since 1994. The decline was largely driven by two periods of heavy selling in government debt. In Q1 investors dumped longer-term government bonds in the so-called “reflation trade” as they bet that the recovery from the pandemic would usher in a period of sustained growth and inflation. Then, in Q3, yields took a hammering as central banks signaled they were preparing to respond to high levels of “persistent inflation” with interest rate rises . Australian and US 10 Year government bond yield increased by 0.70% and 0.60% respectively (chart 2). Longer-term yields cooled in Q4, a sign that investors believe anticipated interest rate rises globally will be short lived, potentially derailing the economic recovery.
Chart 1 - Calendar year bond returns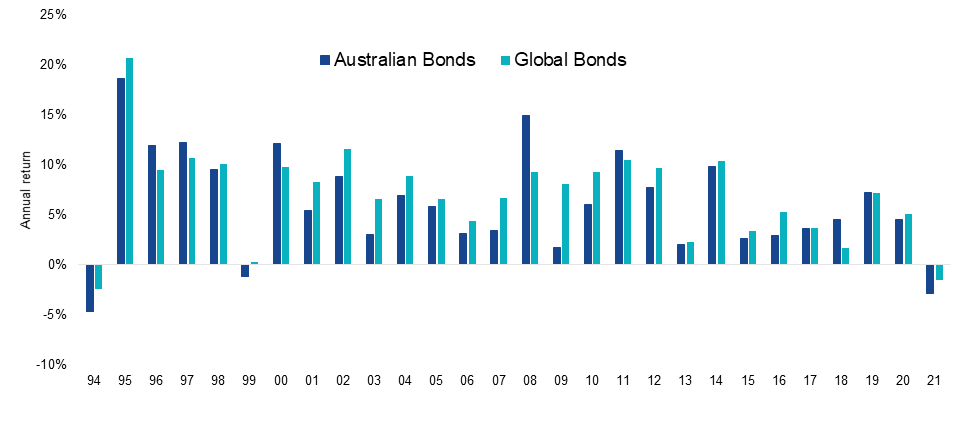
Source: Bloomberg. Australian Bonds as Bloomberg Ausbond Composite 0+ Yr Index, Global Bonds as Bloomberg Global-Aggregate Index hedged to AUD.
Chart 2 – 2021 Australian and US 10 Year government bond yields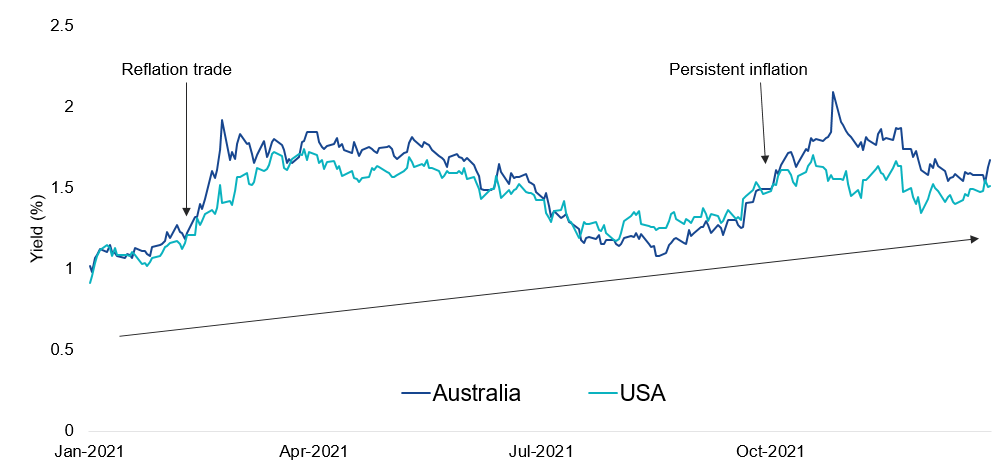
Source: Bloomberg.
Credit spreads widened uniformly across sectors in Australia returning to pre-covid 2019 levels (chart 3) as the Reserve Bank of Australia (RBA) moved away from accommodative monetary policy measures. The RBA commenced bond tapering and closed the Term Funding Facility (TFF) to new drawdowns on 30 June 2021 reducing the borrowing costs and credit risk of ADIs. US investment grade and high yield credit spreads remain unchanged, in line with pre-covid 2019 levels (chart 4).
Chart 3 – 2021 Australian corporate bond credit spreads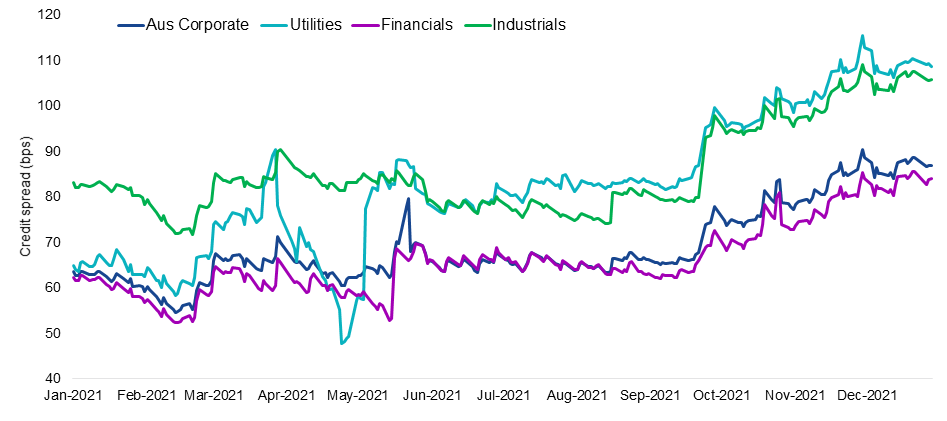
Source: Bloomberg. Bloomberg Ausbond Credit 0+Yr Sector indices.
Chart 4 – 2021 Global bond credit spreads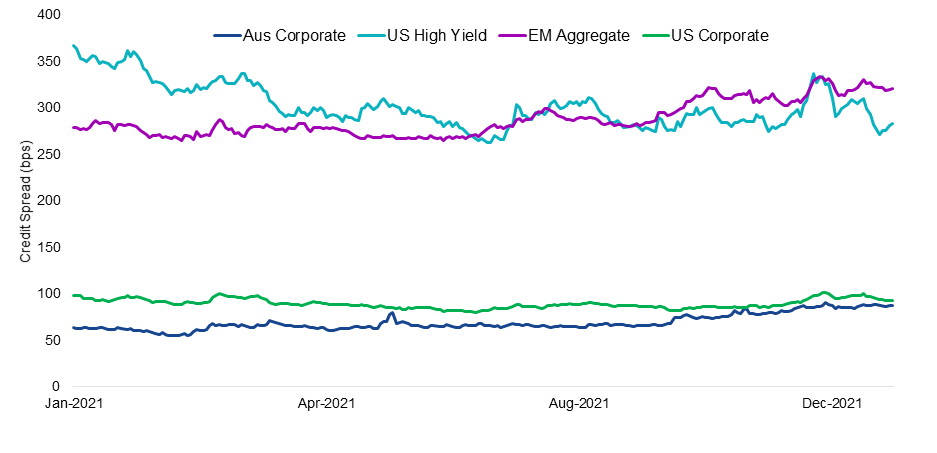
Source: Bloomberg. Aus Corporate as Bloomberg Ausbond Credit 0+Yr index, US Corporate as Bloomberg US Corporate Index. US High Yield as Bloomberg US High Yield Index. EM Aggregate as Bloomberg EM USD Aggregate Index.
Chart 5 – Global credit spreads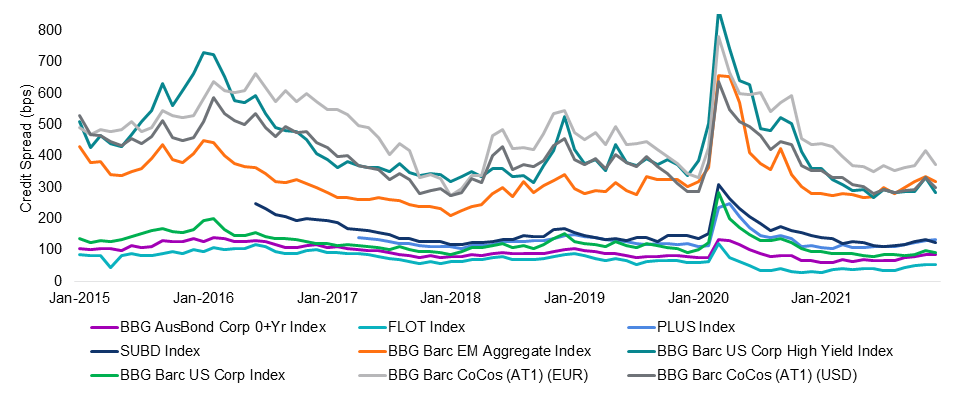
Source: Bloomberg.
2022 outlook
A number of developed markets including the UK and New Zealand have commenced monetary policy tightening to curb inflation. Markets have priced in three interest rate rises from the Fed and four from the Bank of England next year, along with a reduction in the European Central Bank’s asset purchases. These measures are likely to put upward pressure on government bond yields with private equity asset manager Blackstone predicting the US 10 Year government bond yield to rise to 2.75% (+1.24%) by the end of 2022. Markets expect the RBA cash rate to reach 0.8% by the end of 2023 (chart 6). Fixed rate bond investors concerned about rising interest rates should consider switching exposure to floating rate notes (FRNs). FRNs mitigate duration risk as their coupon (interest) payments are variable as opposed to fixed which offsets the effect of rising interest rates on valuations. Australian FRN returns were positive in 2021 despite rising government bond yields (chart 7).
Chart 6 – 3m BBSW Futures Curve (RBA cash rate expectations)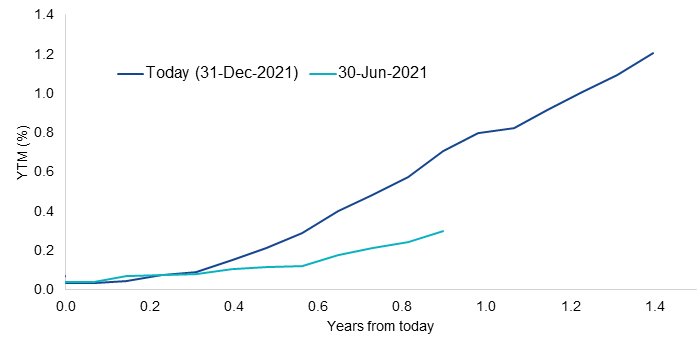
Source: Bloomberg.
Chart 7 – Fixed versus floating Australian corporate performance versus 10 year government bond yield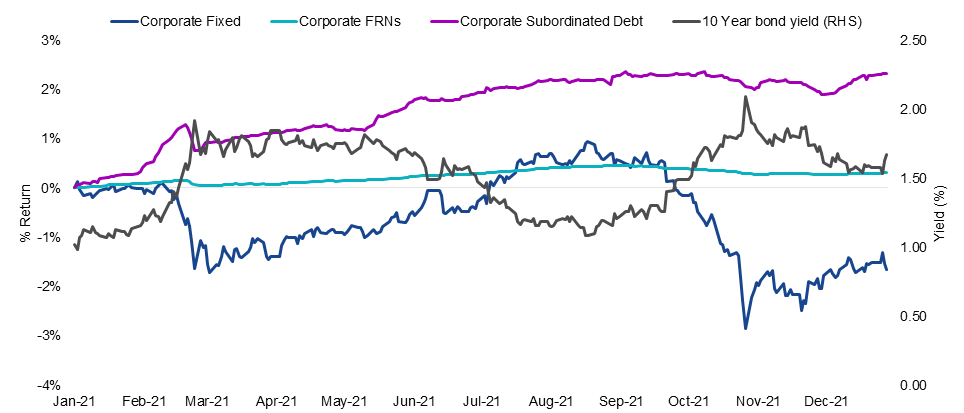
Source: Bloomberg. Corporate Fixed as Bloomberg Ausbond Credit 0Yr+ Index, Corporate FRNs as Bloomberg Ausbond Credit FRN 0Yr+ Index, Corporate Subordinated Debt as iBoxx AUD Investment Grade Subordinated Debt Index.
Credit spreads will be tested in 2022 as governments and central banks pull back stimulus. These measures including a low interest environment has helped companies achieve strong profit margins but this could be under pressure as inflationary and supply chain constraint pressures impact input and wage costs (charts 8 & 9). Strength of balance sheet is a leading indicator for credit risk.
Chart 8 – Shipping costs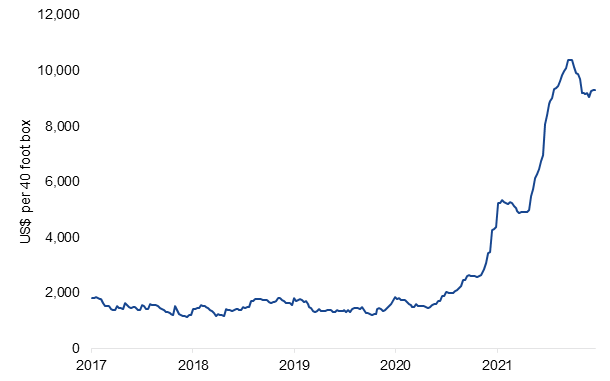
Source: Bloomberg, WCI Composite Container Freight Benchmark Rate per 40 Foot Box.
Chart 9 – US wage growth versus unemployment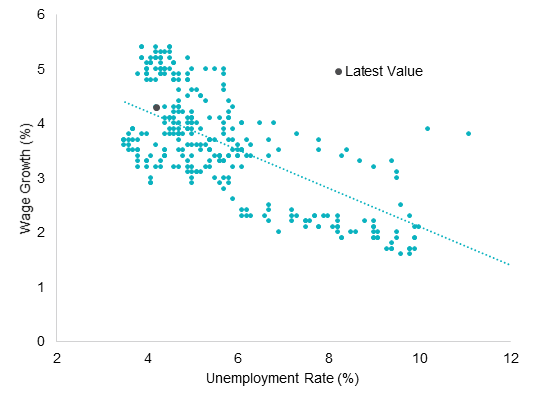
Source: Bloomberg. Atlanta Fed Wage Growth Tracker, US Bureau of Labor Statistics
Access floating rate notes
VanEck offers two floating rate income ETFs listed on the ASX across different investment risk/return profiles:


Published: 06 January 2022