A second chance to go for gold


Many an investor wishes they had bought gold when it was trading at under US$2,000 an ounce (/oz) in 2022 and 2023. Now, it’s over US$4,000/oz. And while that might sound impressive, that 4,000 figure obscures the fact that in January this year, the gold price peaked at about US$5,595/oz.
Over the past five years, the yellow metal has outperformed a range of major asset classes, including REITs, the S&P 500 and even bitcoin.
Chart 1: 5 year cumulative return of major asset classes
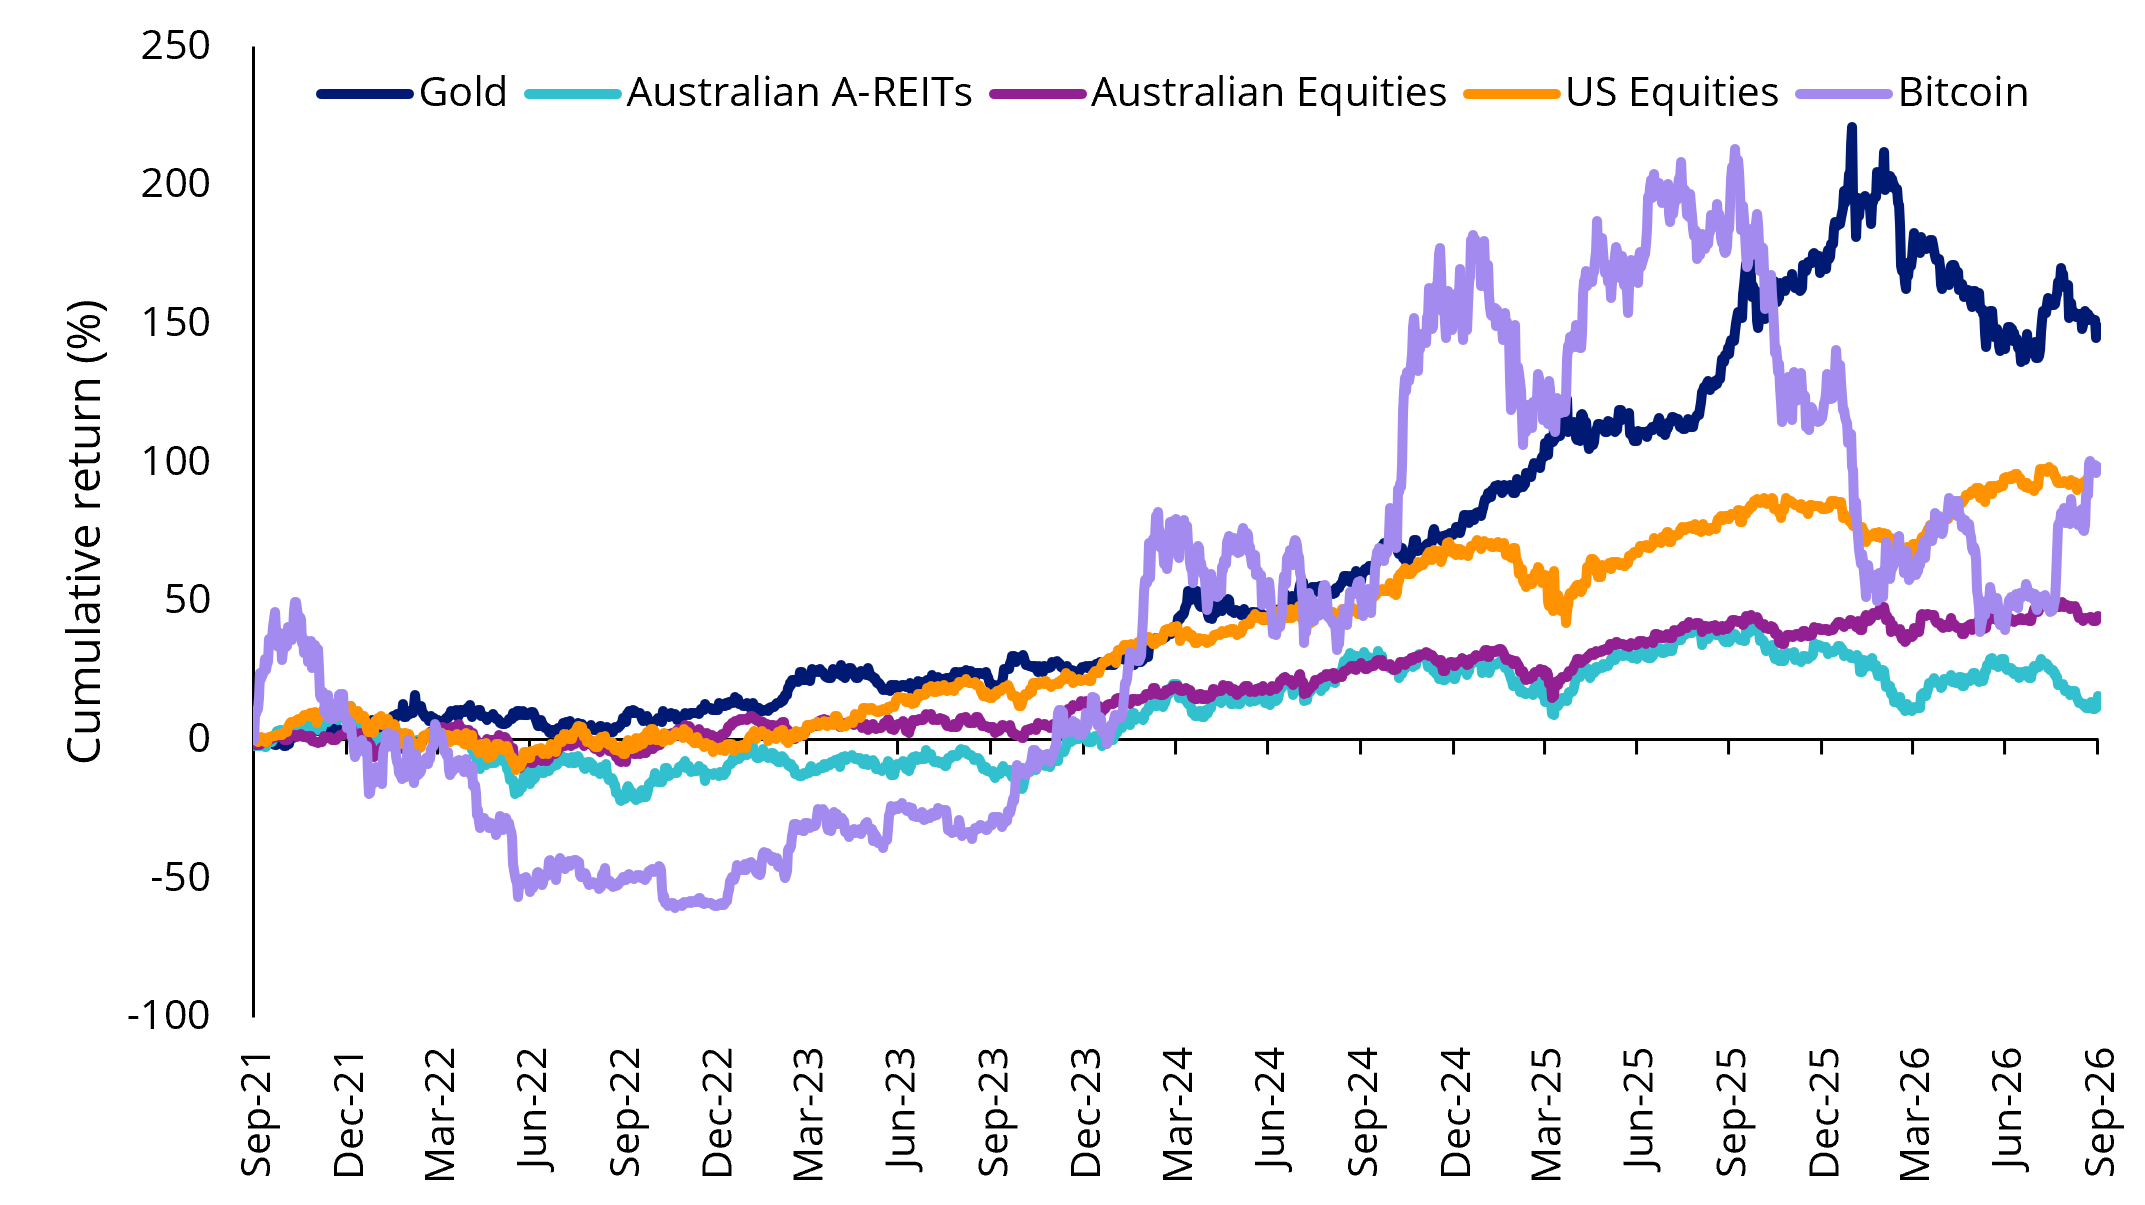
Source: Morningstar direct: 5 years to 30 September 2026. Gold is LBMA Gold Price PM, Australian A-REITs is S&P/ASX 200 A-REIT Index, Australian equities is S&P/ASX 200 Index, US Equities is S&P 500 Index, Bitcoin is MarketVector Bitcoin Benchmark AUD Rate. You cannot invest in an index. Past performance is not indicative of future performance.
But for those wishing they had bought in earlier, they may be about to receive a second chance. Gold’s price is approaching a point where buyers returned earlier in the year, potentially presenting an opportunity to establish or add to an allocation, given the longer-term investment case is still intact.
Chart 2: Spot gold closing price vs key technical indicators
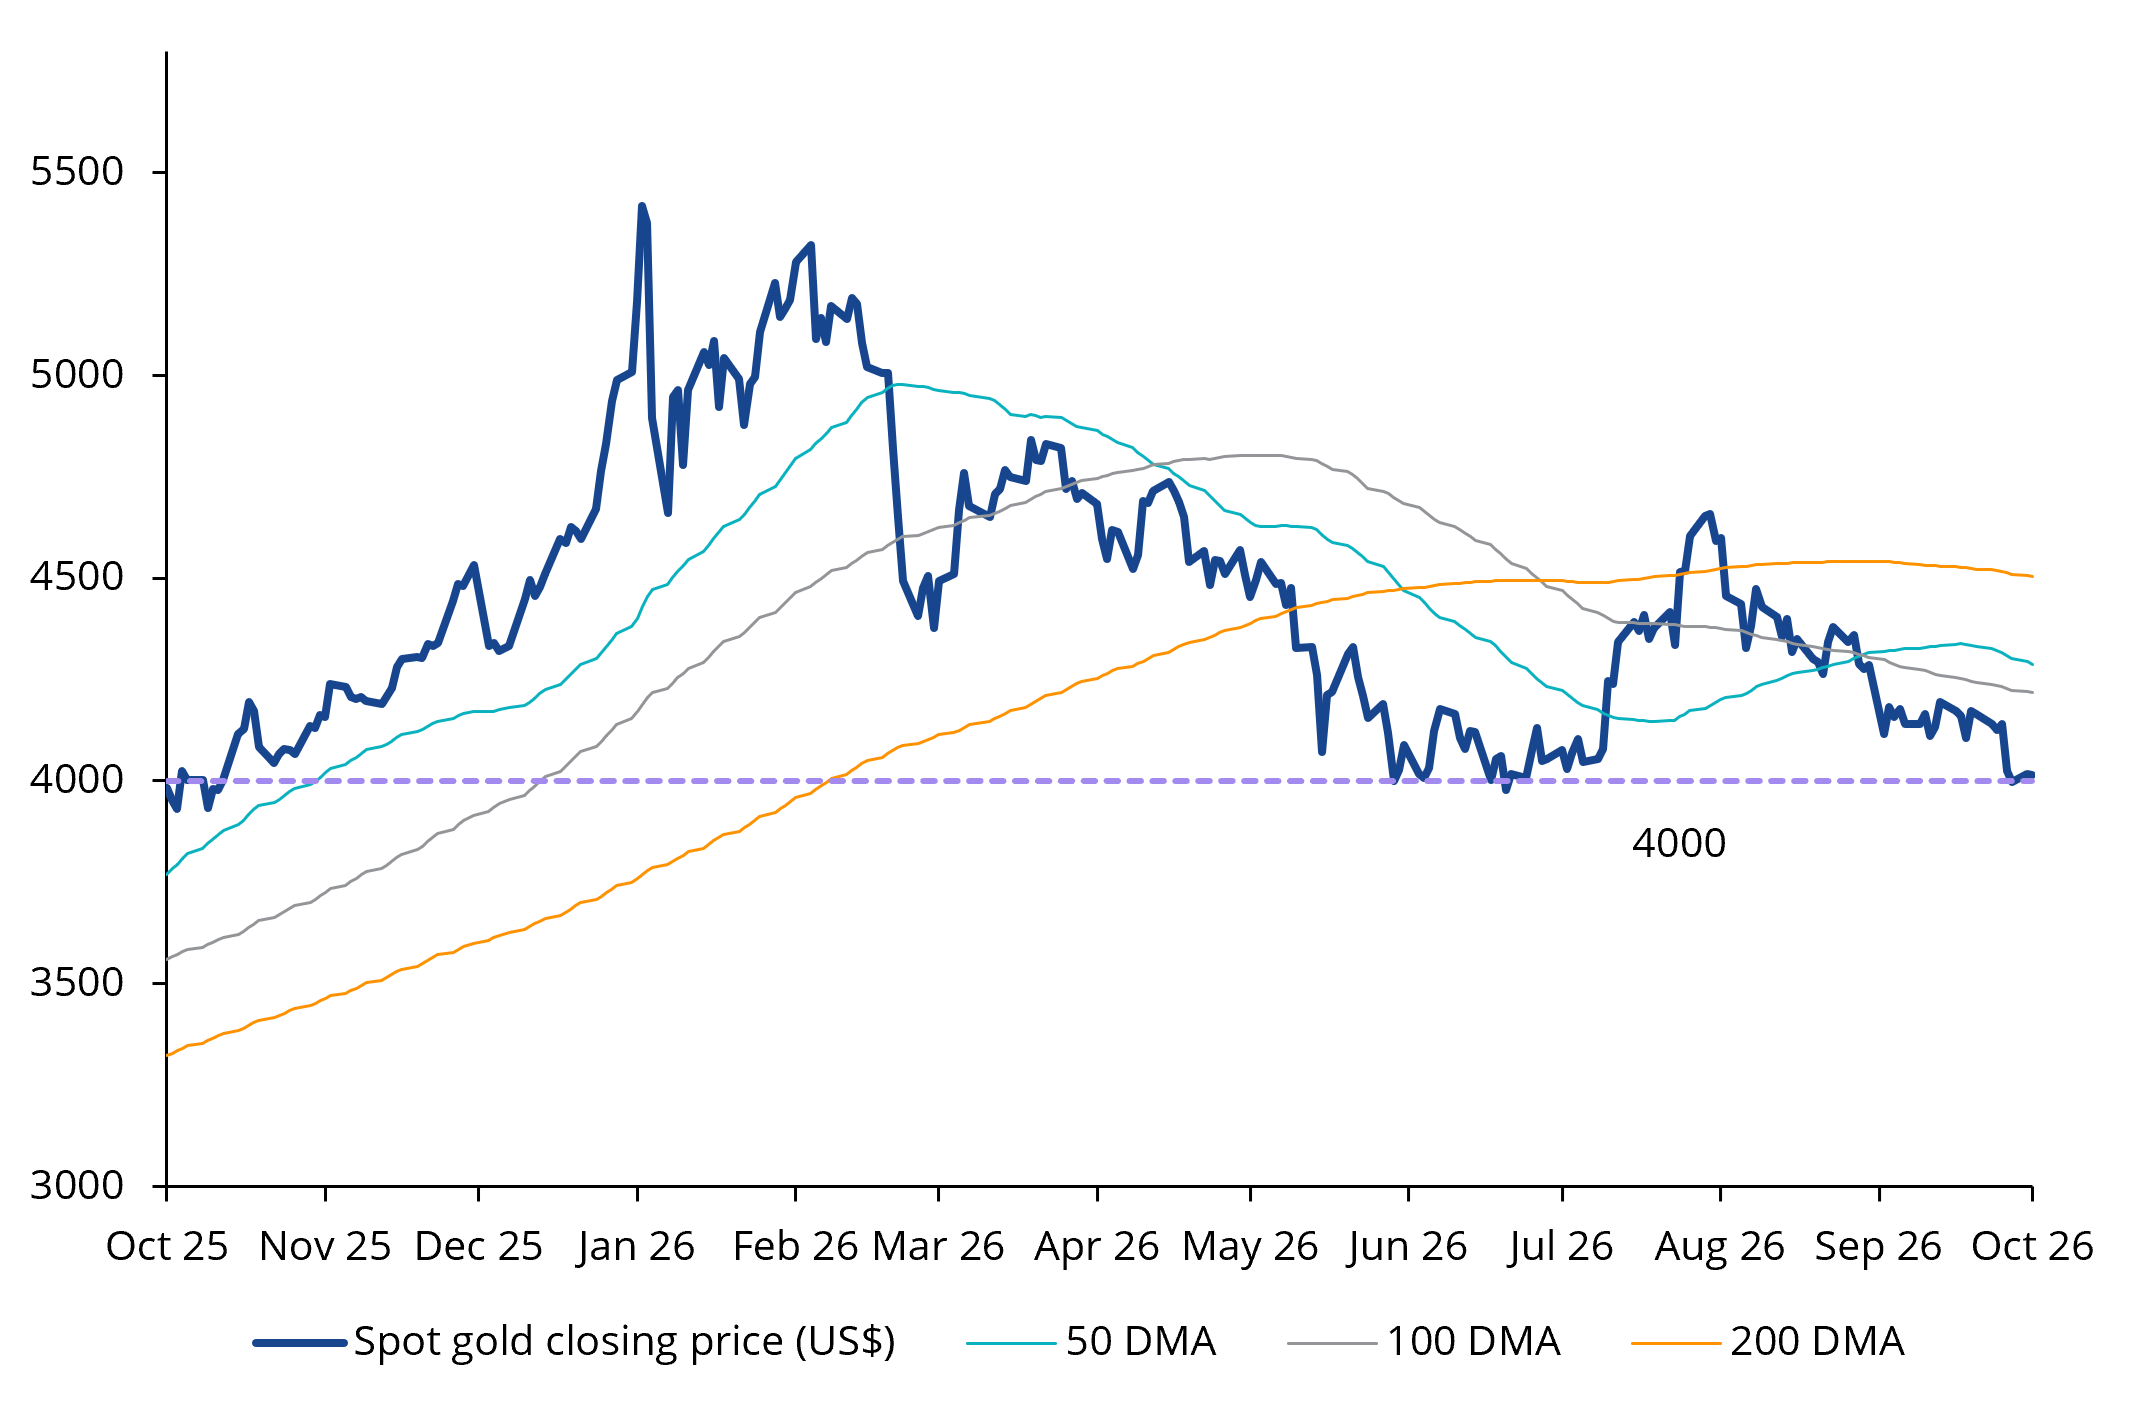
Source: Bloomberg, as at 26 October 2026. DMA is simple day moving average. Daily data used. Past performance is not indicative of future performance.
The next chart shows the Relative Strength Index, an indicator measuring the strength of recent price rises and falls. A reading above 70 is traditionally seen as overbought, suggesting the price may have risen too far too quickly. A reading below 30 is seen as oversold, suggesting it may have fallen too far too quickly. As the chart shows, when the RSI hit 30 back in June and March, the gold price staged a multi-week rally afterward.
Chart 3: Relative strength index
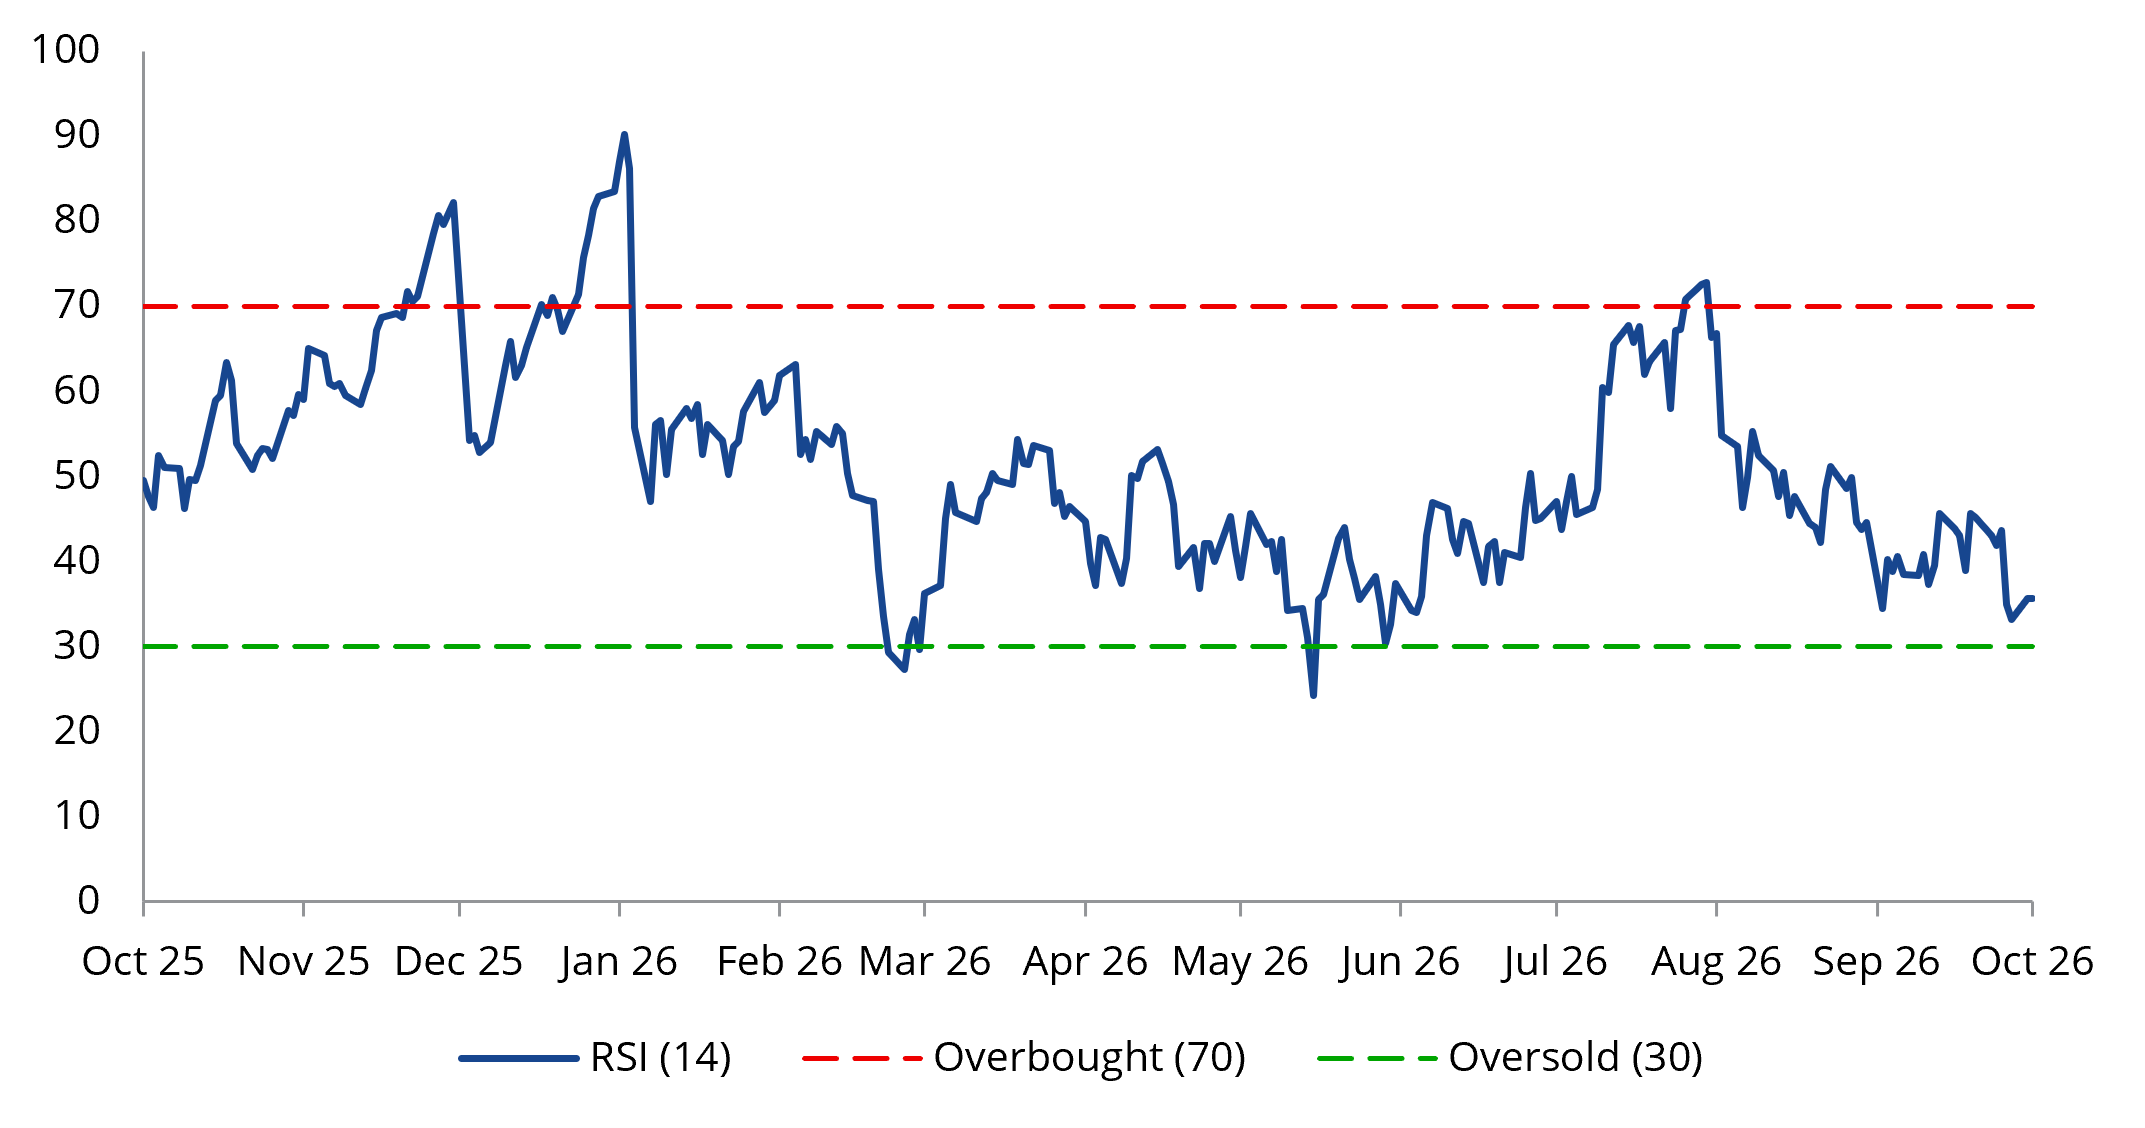
Source: Bloomberg, as at 26 October 2026. RSI is Relative Strength Index. Daily data used. Past performance is not indicative of future performance.
A single technical indicator does not tell much. However, a collection of indicators may suggest the gold bullion price is due for a rebound, especially if investors believe the reasons to own gold have not fundamentally changed.
Why gold prices have slumped
Higher inflation has raised expectations of rate hikes from developed market central banks. Some of them, including the RBA and the Federal Reserve, have already increased rates.
Those hikes have increased real yields. Geopolitical uncertainty has resulted in relative US dollar strength. Together, a strong US dollar and high real yields are traditional headwinds for the gold price. Crude oil has risen more than 90% year to date, while gold has fallen more than 28% from its January peak.
But the investment case for gold otherwise remains largely intact. Central banks have continued to accumulate gold at an unprecedented pace. As at the end of August 2026, data from the World Gold Council suggested central banks have purchased a total of 170 tonnes of gold so far this year.
Reserve managers have reasons to own gold that extend beyond the next interest rate decision. Gold is scarce, cannot be created through a policy decision and is independent of any single country. These qualities matter to institutions seeking to diversify reserves in a world where developed economies carry high and growing public debt. The US surpassing US$40 trillion in national debt earlier this year is a prime example.
Gold held in ETFs has increased since mid-July despite the fall in prices, suggesting investors continue to see a place for the metal in their portfolios through the pullback.
Chart 4: Gold in ETF holdings rise as bullion prices retreat
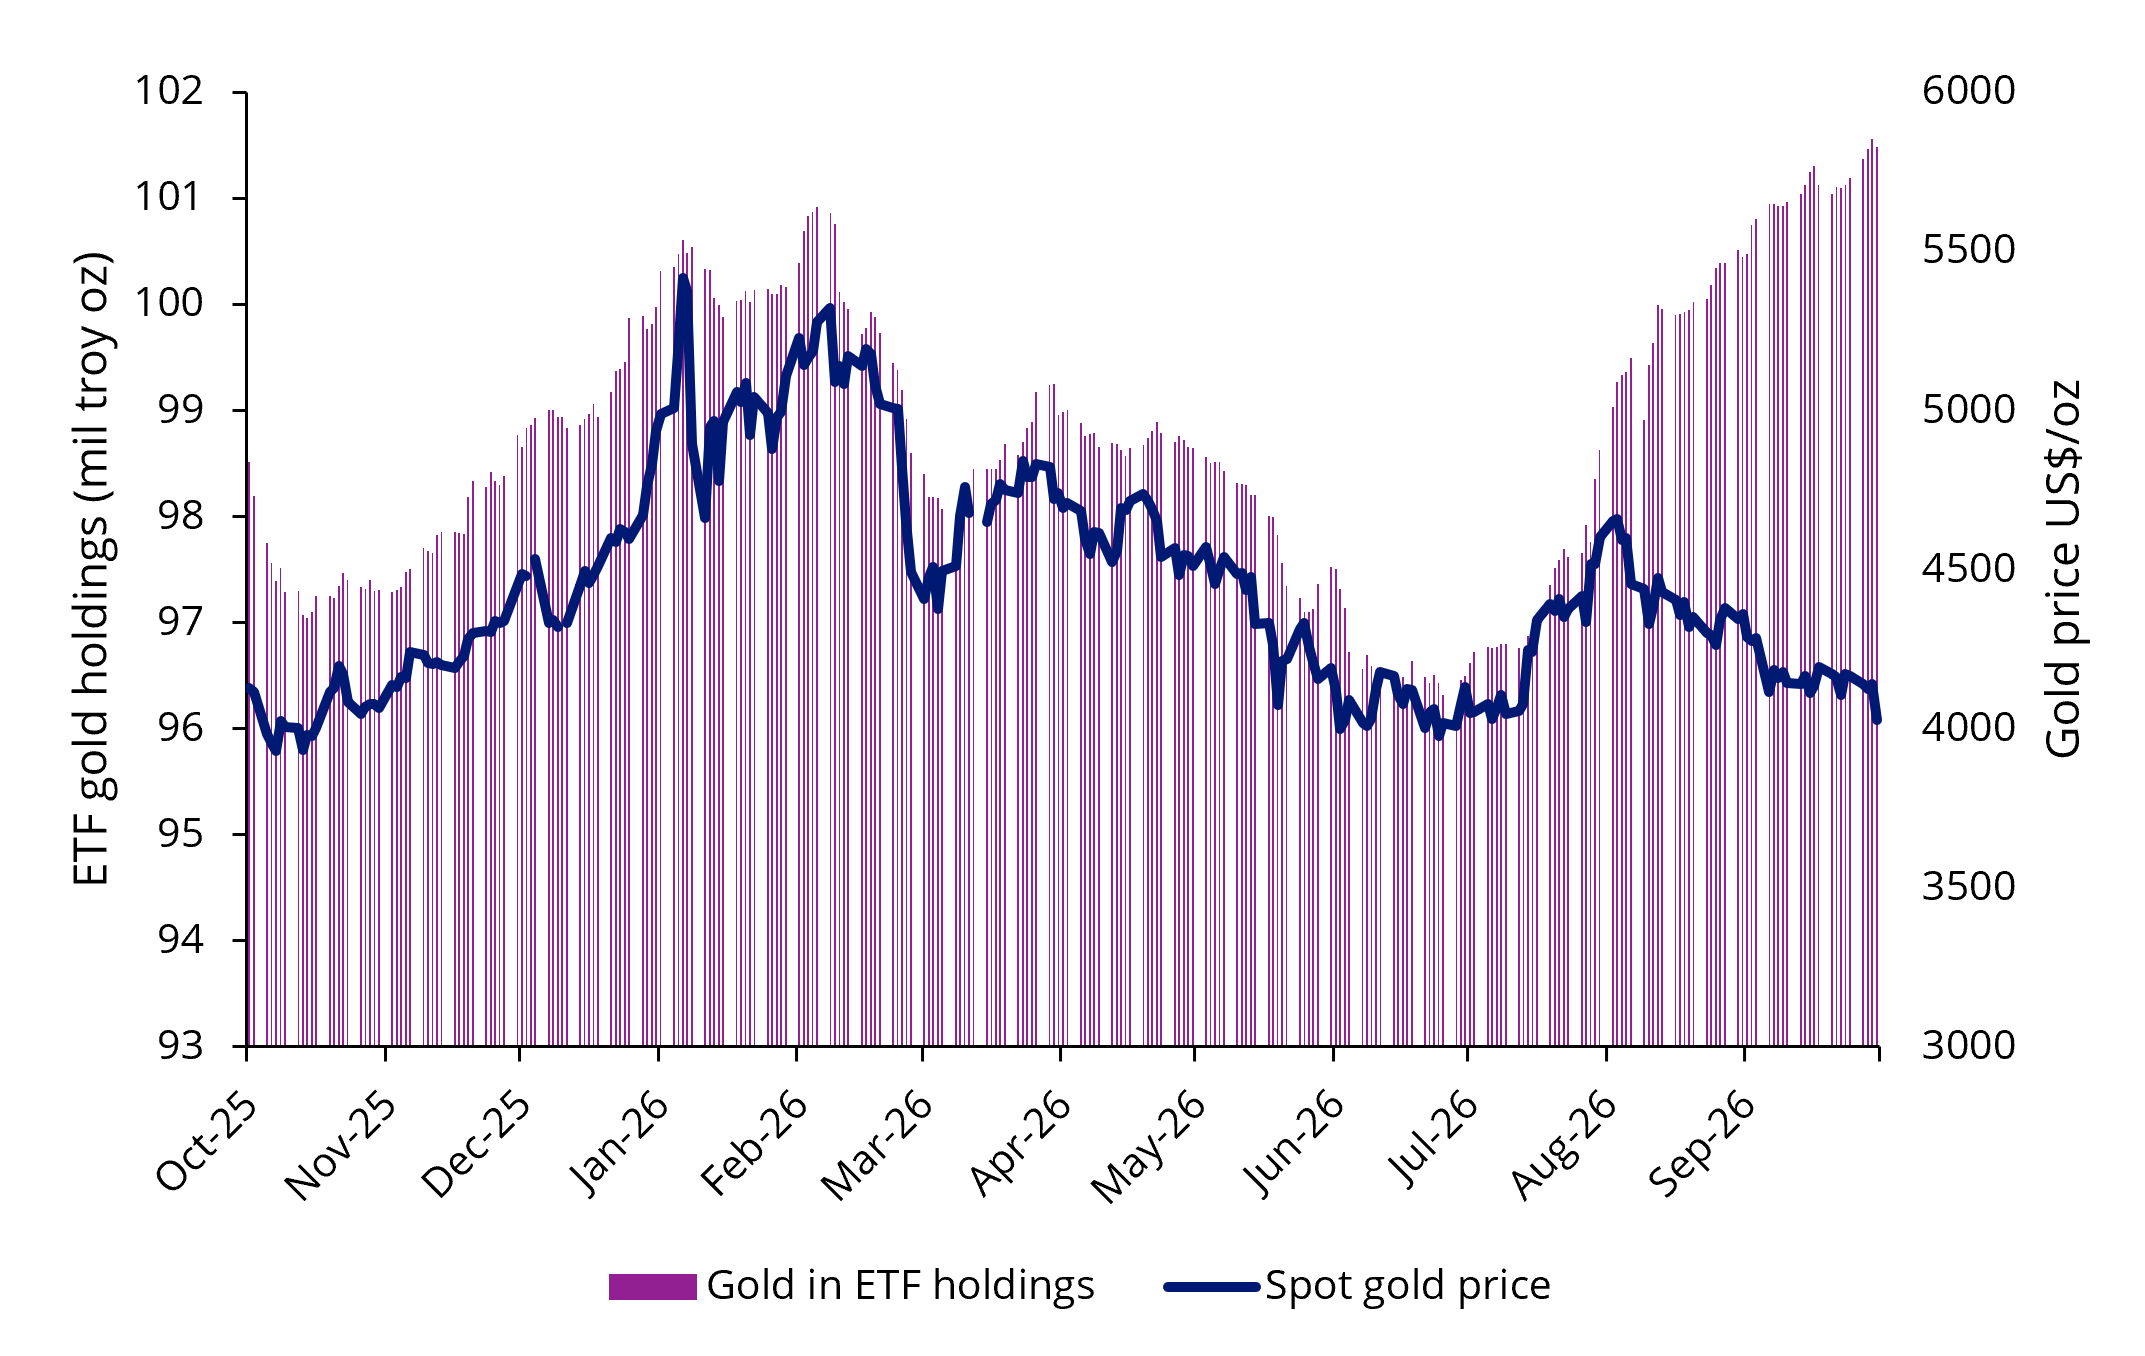
Source: Bloomberg, as at 26 October 2026. Gold ETFs listed on exchanges around the world. Past performance is not indicative of future performance.
The weekly figures show how sustained that buying has been. ETF holdings of gold increased for 13 consecutive weeks through mid-October, adding nearly 5 million ounces in that time. While this metric alone does not establish a floor under the gold price, it shows that demand for an allocation has endured through the pullback.
Chart 5: 13 weeks of additions to gold ETF holdings through to mid-October
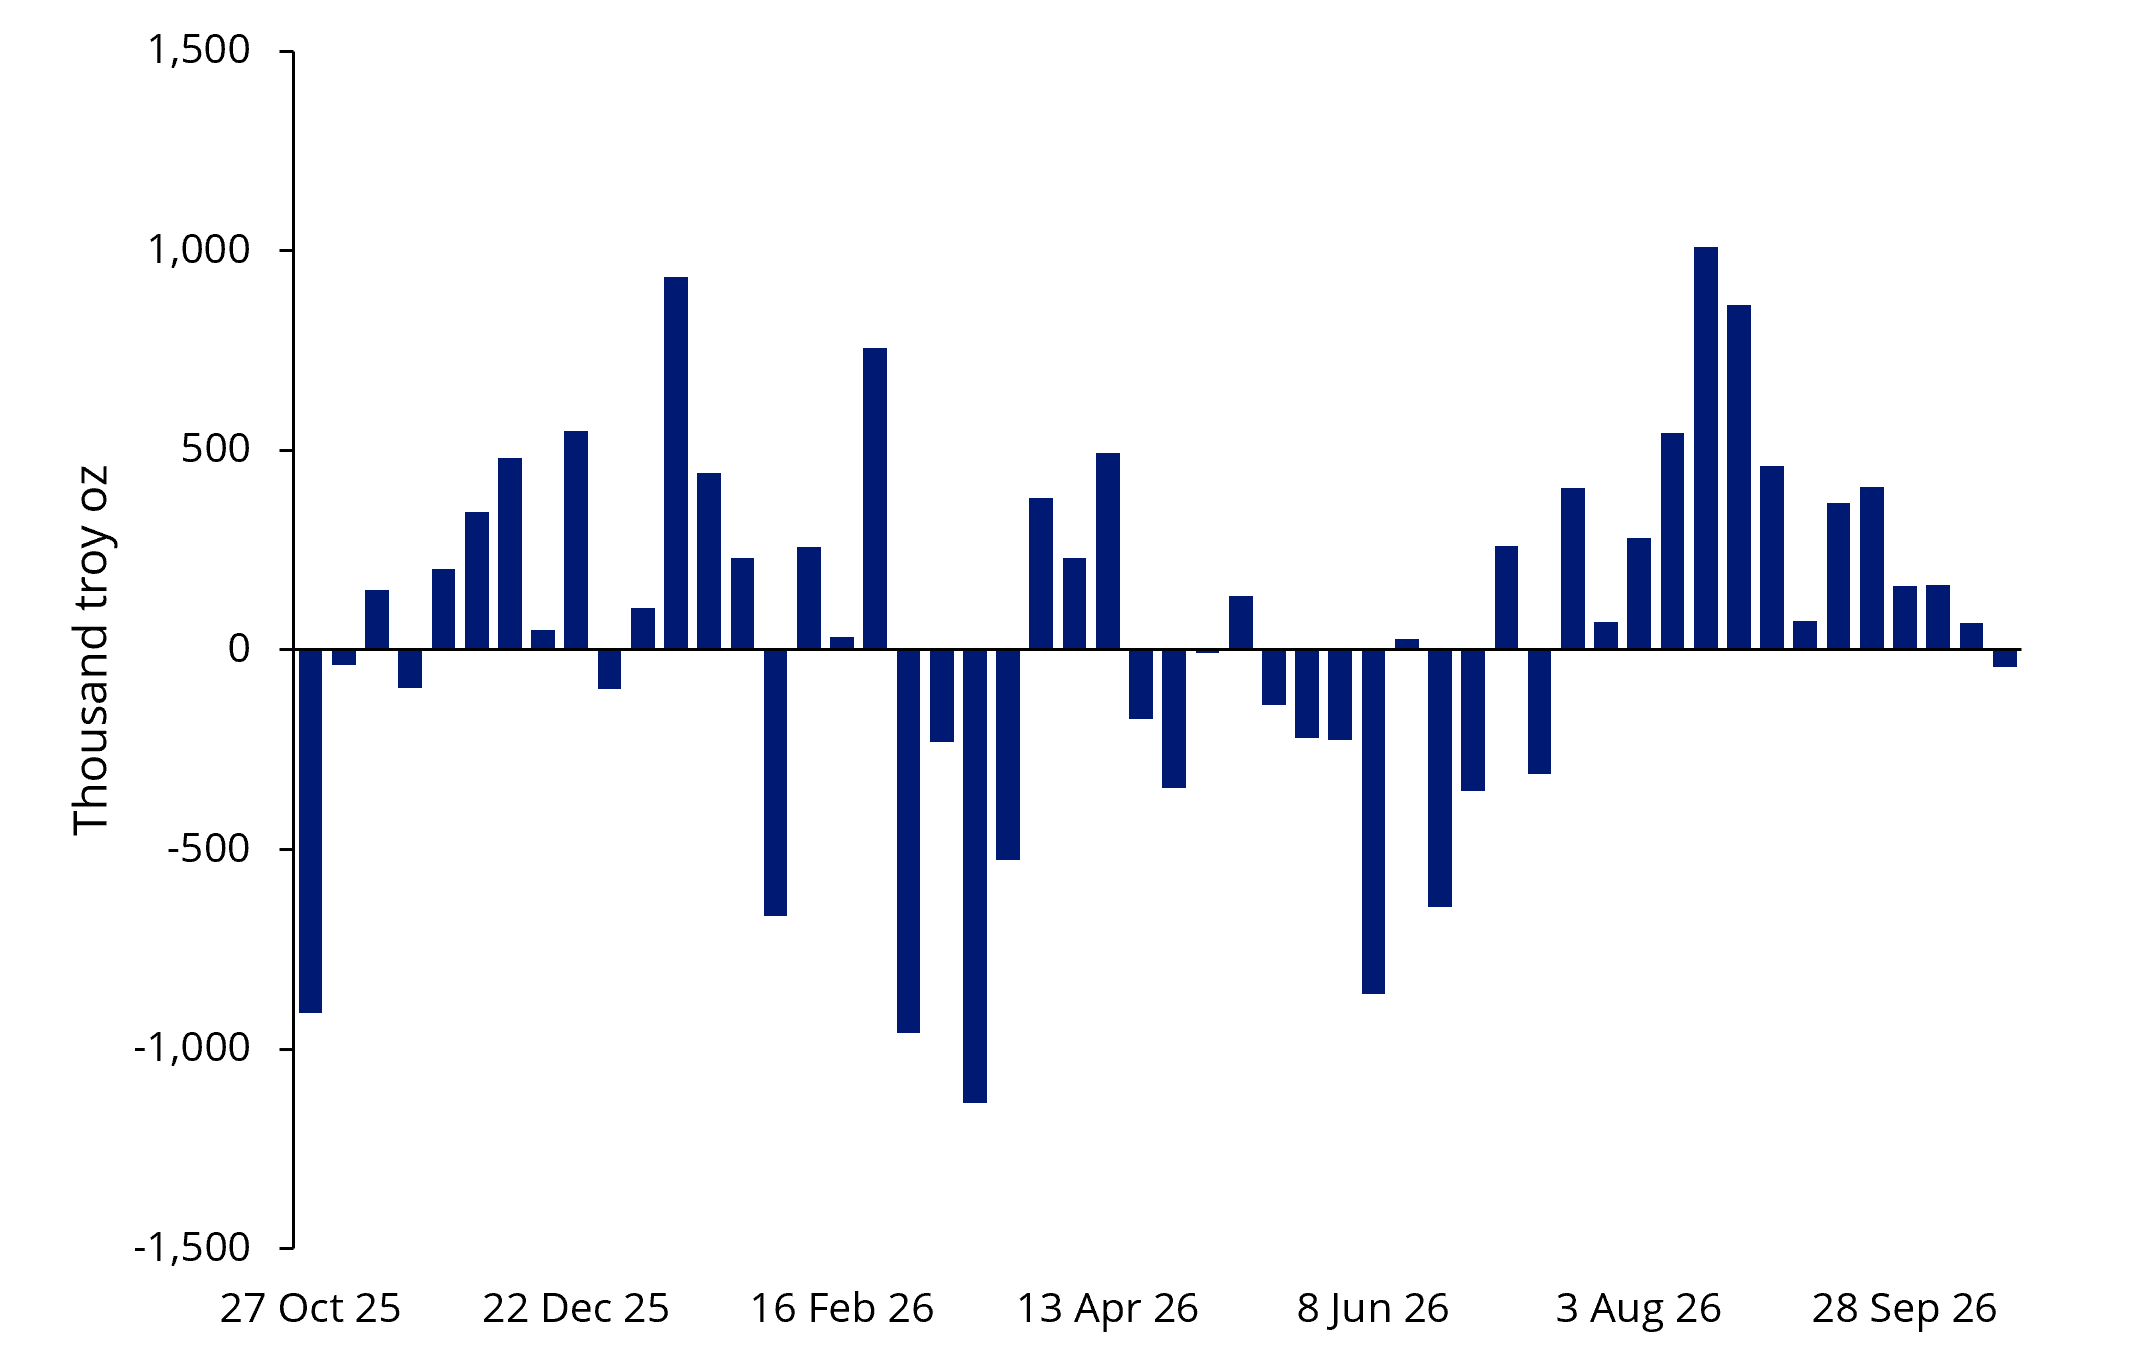
Source: Bloomberg, as at 26 October 2026.
An opportunity to reconsider the allocation
For individual investors, gold’s appeal also rests on how it behaves alongside other investments.
Over the ten years to August 2026, gold had a negative correlation with Australian and international equities, measured in Australian dollars, and a low correlation with Australian and global bonds.
For investors seeking bullion exposure, the VanEck Gold Bullion ETF (NUGG) provides access to physical gold without the practical work of arranging storage and insurance. Its value remains exposed to movements in gold prices and currencies, among other risks.
Gold miners offer another way to participate if a recovery eventuates. A rising gold price can increase their revenue without an equivalent rise in production costs, allowing profits to grow faster than bullion. They also offer the potential for investors to earn dividends and capital growth.
And yet the chart below shows that the ratio of an index of gold miners to the gold price remains below its long term average. This suggests scope for further gains if investors become more willing to pay for the sector’s earnings and cash flow.
Chart 6: Gold miners’ discount to bullion has narrowed, but remains
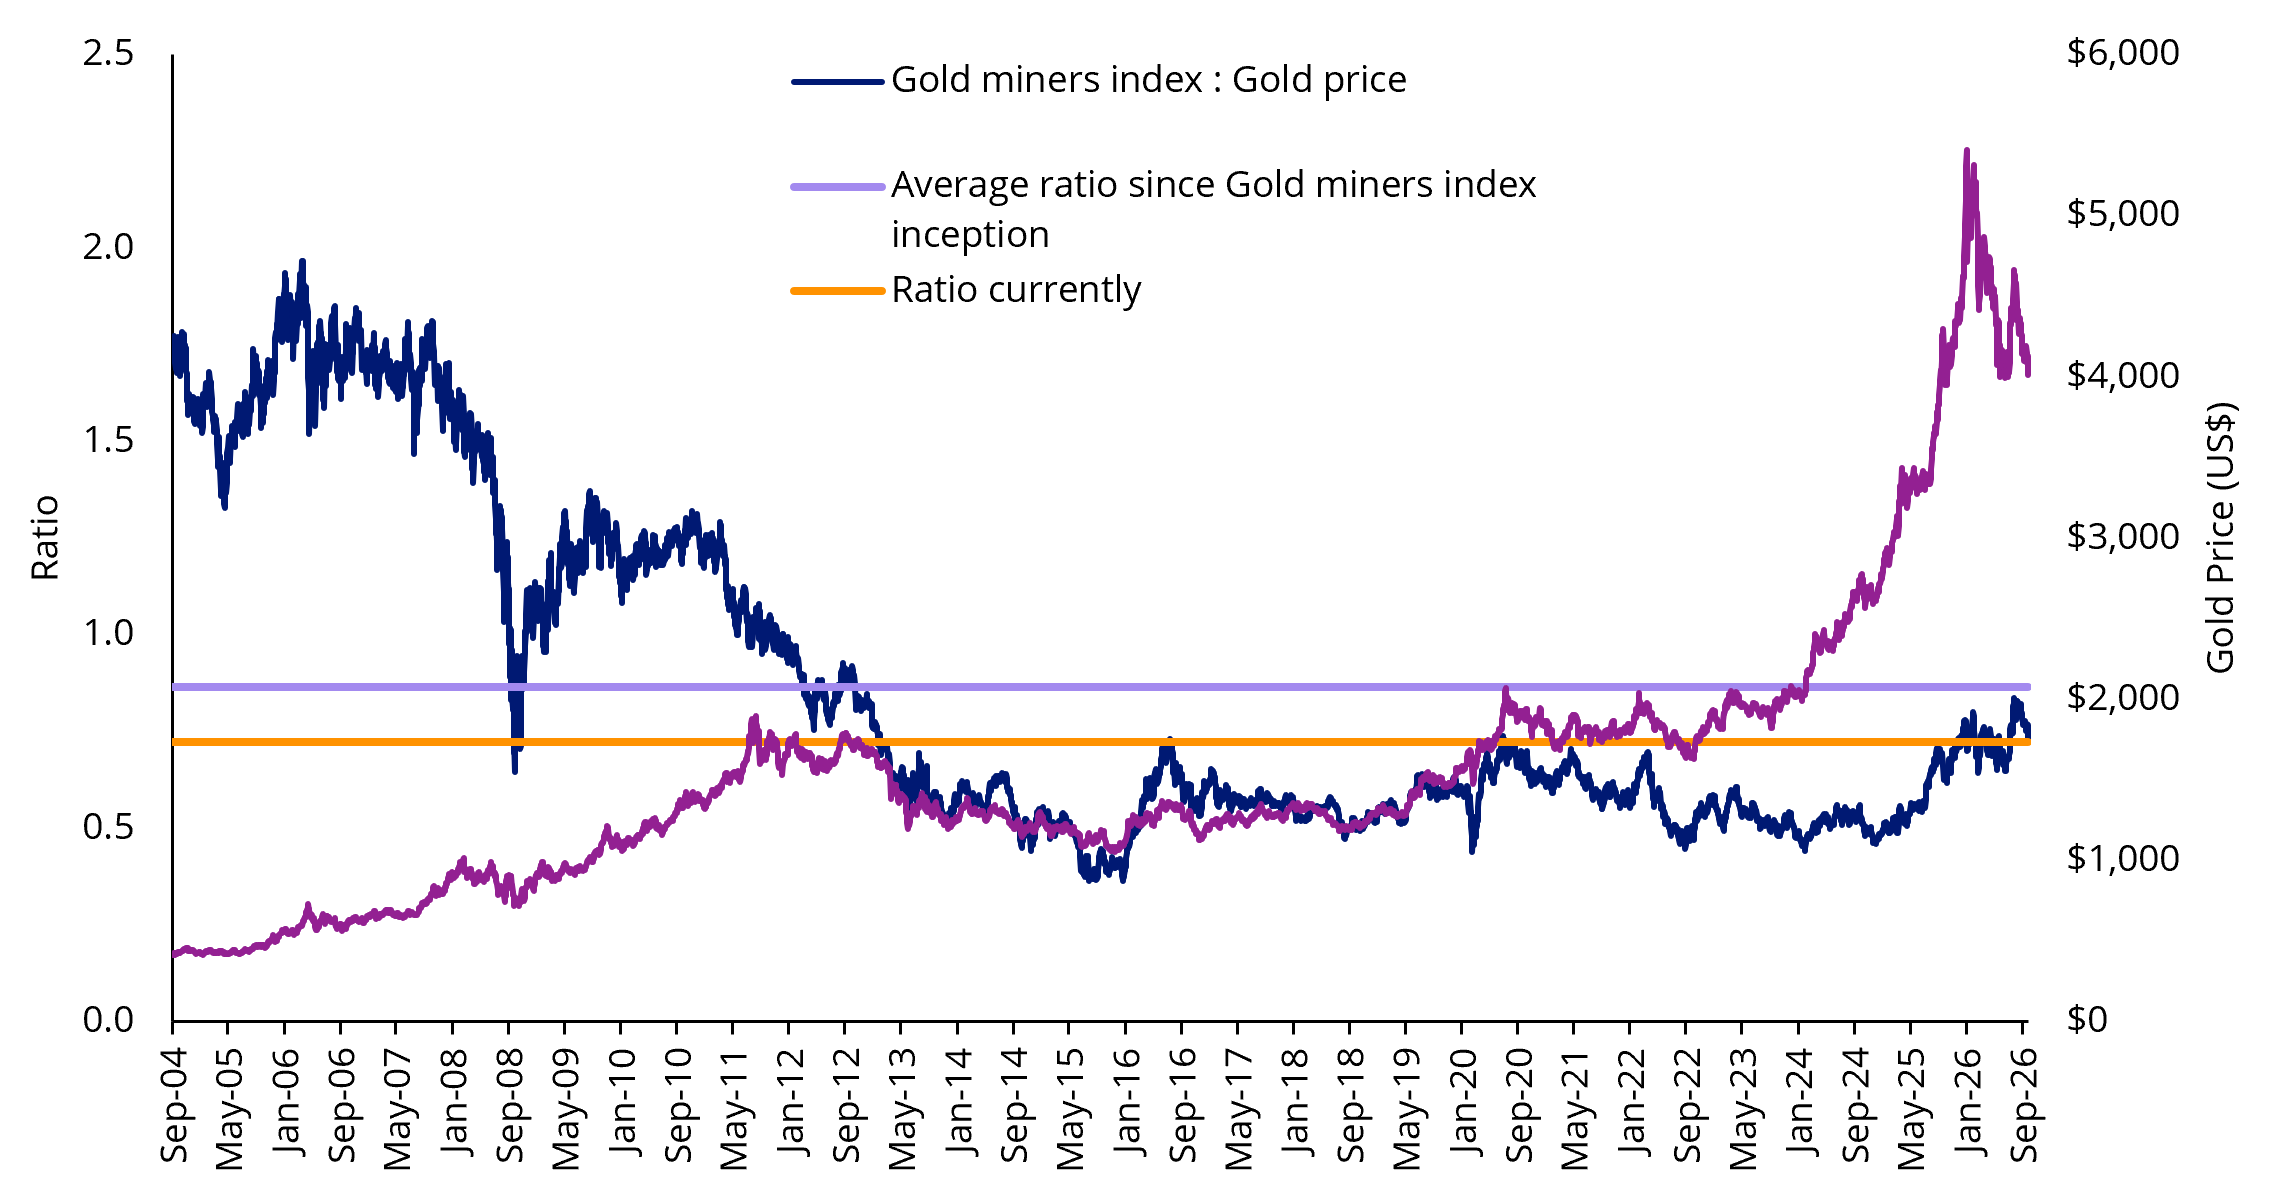
Source: Bloomberg, VanEck. As at 26 October 2026. GDX index is the NYSE Arca Gold Miners Index. Gold Price is LBMA PM Gold Price. GDX index inception is 29 September 2024. Past performance is not indicative of future performance. You cannot invest directly in an index.
There is substance behind those cash flows. During the current cycle, gold prices have risen faster than mining costs, supporting a sustained increase in margins. Producers have also focused on cost discipline and operational improvements, leaving more cash available to invest in future production and return to shareholders.
Chart 7: Profit margins vs gold price
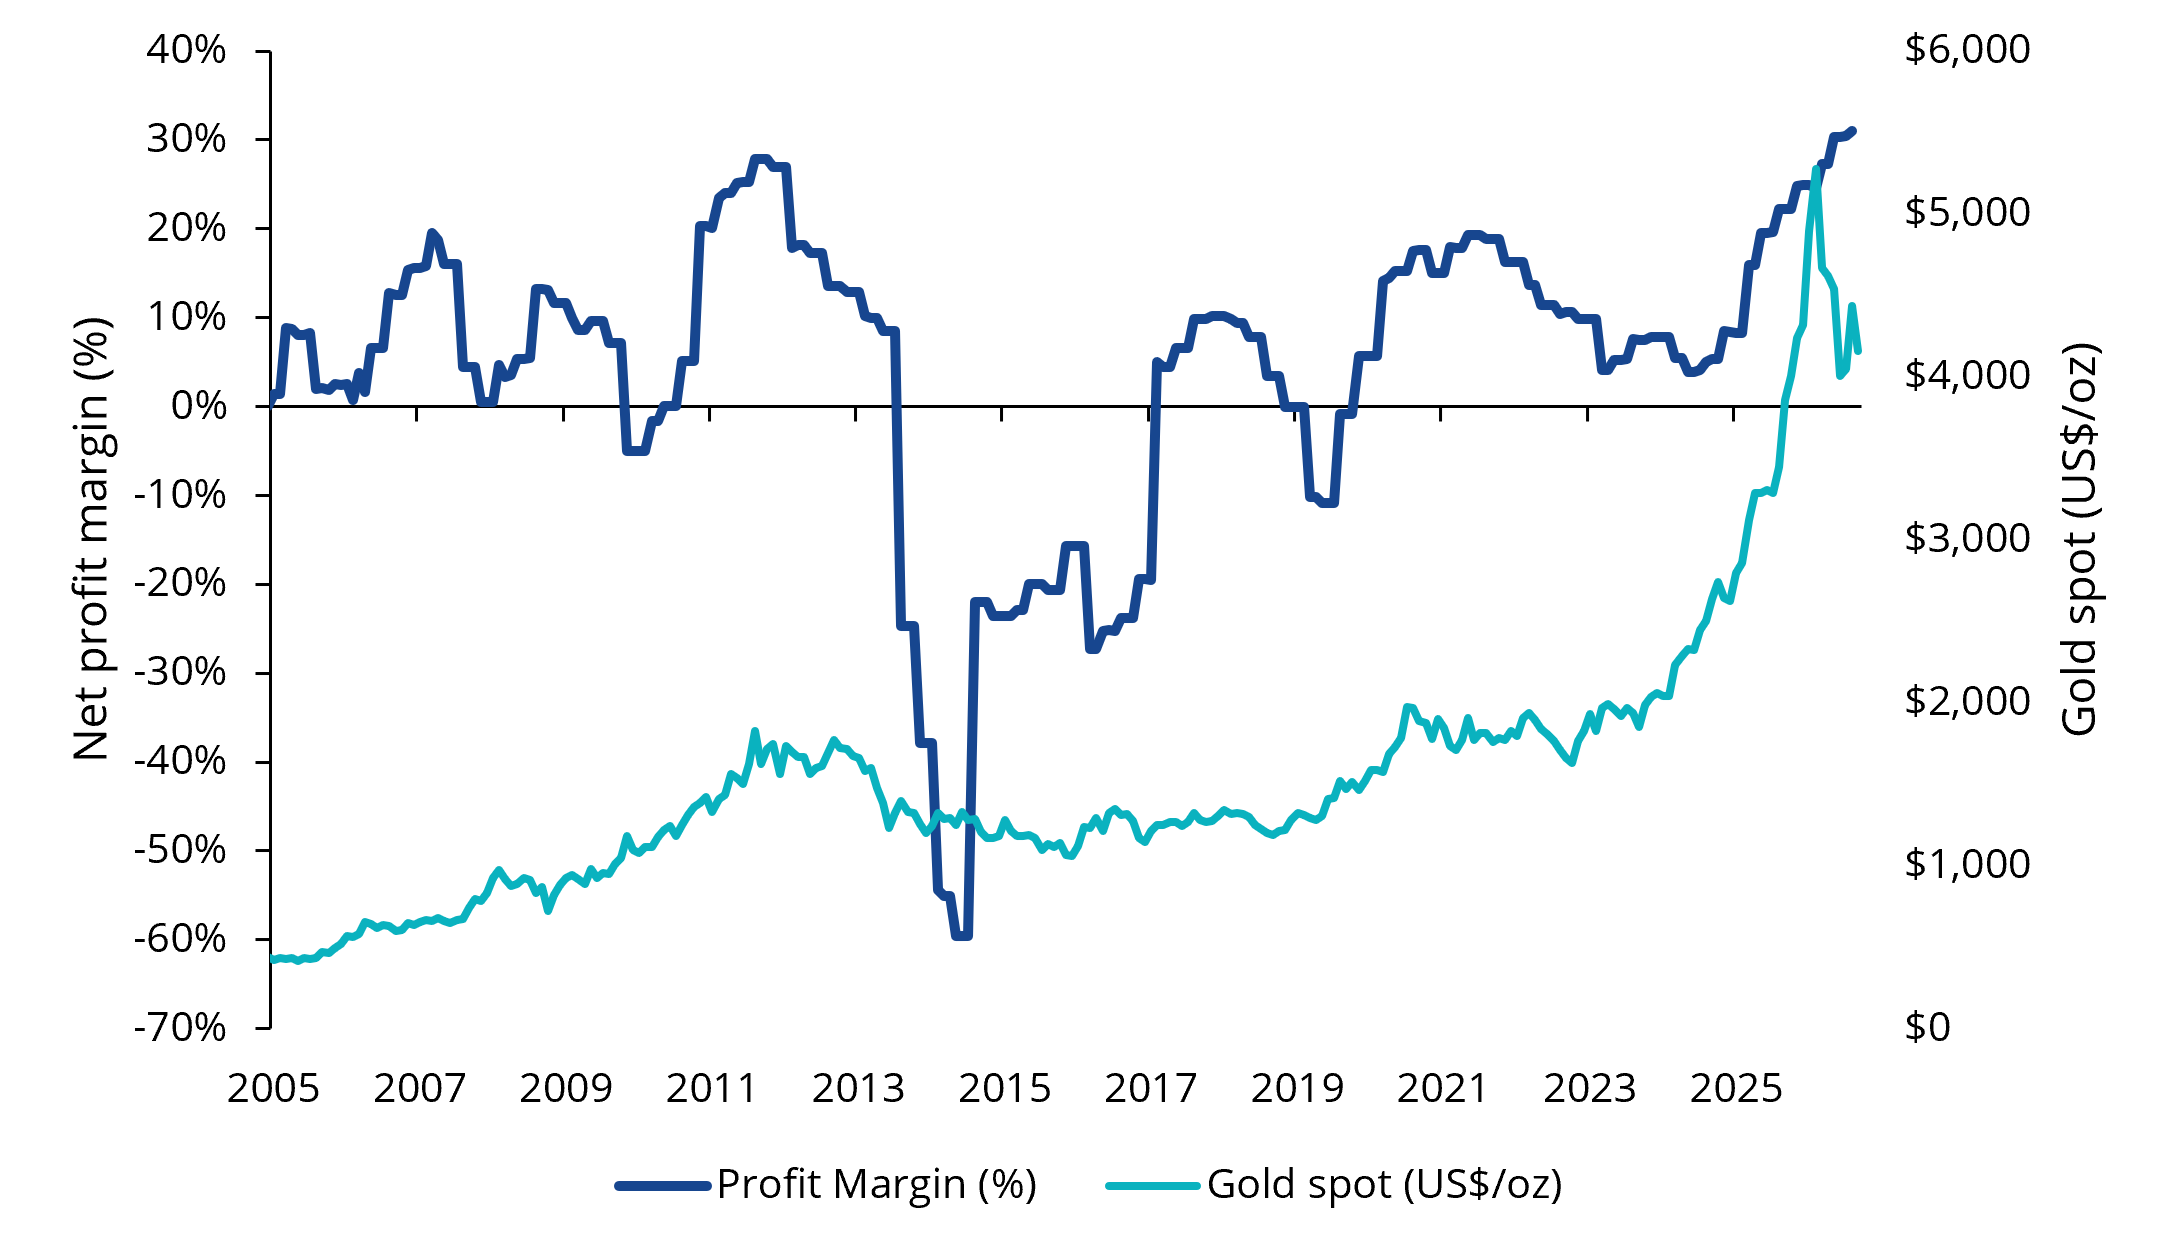
Source: Bloomberg, VanEck. As at 26 October 2026. GDX index is the NYSE Arca Gold Miners Index. Gold Price is LBMA PM Gold Price. GDX index inception is 29 September 2024. Past performance is not indicative of future performance. You cannot invest directly in an index.
Dividend payments and share buybacks are becoming more common, including among smaller producers.
The VanEck Gold Miners ETF (GDX) provides access to a diversified portfolio of global gold mining companies through one trade on the ASX, offering investors exposure to the businesses producing the metal alongside its potential price recovery.
GDX has traded in Australia since June 2015 and is Australia’s largest gold miners ETF by funds under management. The US-listed version of GDX launched in May 2006 and is the world’s largest and most heavily traded gold mining ETF.
Investors who felt they had missed gold’s rally now have a lower price at which to consider its place in their portfolios. We think the pullback deserves attention because the reasons to own gold extend well beyond its previous high. The opportunity is to put those reasons to work at a more attractive entry price.
Key risks of NUGG and GDX:
An investment in NUGG or GDX carries investment risk. These risks vary depending on the fund and may include gold pricing risk, currency risk, custody risk, Australian sourced gold bullion risk, ASX trading time differences, financial markets generally, individual company management, industry sectors, country or sector concentration, political, regulatory and tax risks, fund operations and tracking an index. See the PDSs and TMD for details on risks.
GDX is likely to be appropriate for a consumer who is seeking capital growth, is intending to use the product as a satellite allocation within a portfolio, has an investment timeframe of at least 5 years, and has a very high risk/return profile.
NUGG is likely to be appropriate for a consumer who is seeking capital growth, is intending to use the product as a minor or satellite allocation within a portfolio, has no investment timeframe, and has a high or very high risk/return profile.


Published: 30 October 2026
Any views expressed are opinions of the author at the time of writing and is not a recommendation to act.
VanEck Investments Limited (ACN 146 596 116 AFSL 416755) (VanEck) is the issuer and responsible entity of all VanEck exchange traded funds (Funds) trading on the ASX. This information is general in nature and not personal advice, it does not take into account any person’s financial objectives, situation or needs. You should consider whether or not an investment in any Fund is appropriate for you. Investments in a Fund involve risks associated with financial markets. These risks vary depending on a Fund’s investment objective. Refer to the applicable product disclosure statement (PDS) and target market determination (TMD) available at vaneck.com.au for more details. Investment returns and capital are not guaranteed.