What gold miners may want for the rest of 2026


Gold’s volatility has weighed on mining stocks this year, even as producers enjoy historically wide margins and growing net cash. A steadier gold price could put the focus back on the businesses.
Key takeaways:
- Gold miners outperformed during the rally and recent sideways market but fell harder during the sell-off.
- Strong margins and balance sheets underpin the investment case despite share price volatility.
- A steadier gold price could bring business fundamentals into focus; costs and execution remain key risks.
Gold fell US$282.79, or 6.80%, to close October at US$3,874.62 an ounce. The gold mining stocks, as represented by the NYSE Arca Gold Miners Index, fell 12.85% over the same period.
Despite the lower close, gold averaged US$4,107 an ounce in October and has averaged about US$4,500 so far in 2026. This is a healthy level for producers, whose reserves and project economics are built on price assumptions well below it.
The biggest change of 2026 has been the ride. Annualised realised volatility in gold is around 29% in 2026, nearly double the average of about 15% over the prior five years (2021–2025).
How gold mining stocks responded to gold prices
Gold mining stocks have shown greater sensitivity to gold’s moves in both directions this year but have held up during the recent sideways period.
Gold has had three phases this year: a sharp rally into late January, a sell-off that deepened after the war in Iran began and a sideways market which has seen the gold price sit around US$4,000 an ounce since the summer. The question investors ask us most is how sensitive mining stocks really are to changes in the gold price. This year's answer has some nuance, and we think it points back to the strength of the businesses behind the stocks.
The following chart shows how the share prices of miners outpaced gold during the rally, lagged bullion in both legs of the selloff, and outperformed again once gold stopped falling.
Chart 1: Gold miners vs gold: Returns by period during 2026
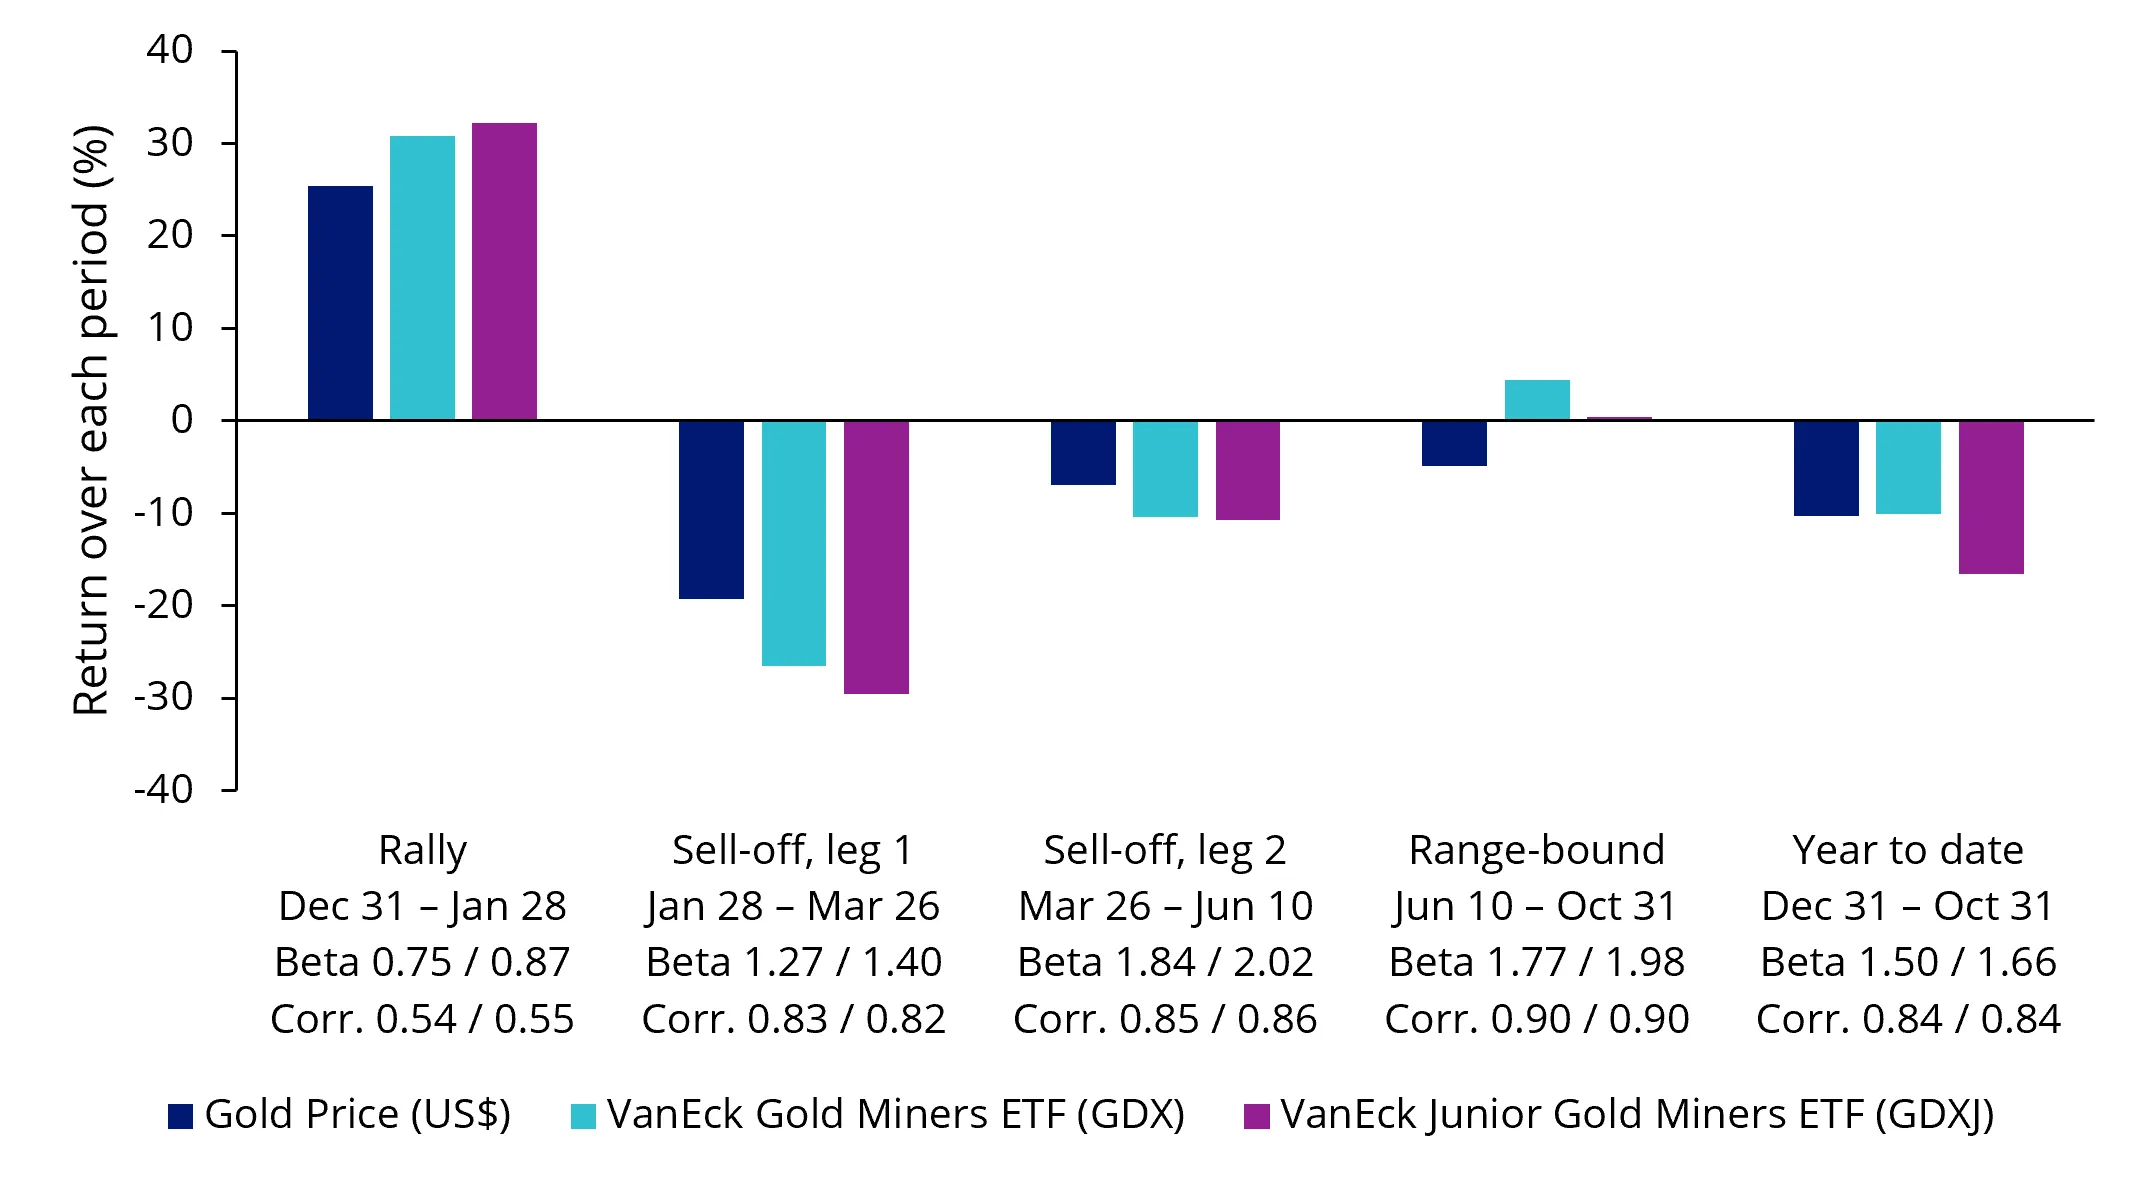
Source: Bloomberg. Gold is XAU spot (price return); GDX and GDXJ are total return. Beta and correlation are measured against gold (XAU) over each period and shown as GDX / GDXJ. Period returns, December 31, 2025 – October 31, 2026. Past performance is not indicative of future results.
The beta measures how sensitive mining stock returns were to daily changes in the gold price over each period. A beta of 1 means that the fund would move in line with the gold price on average. Greater than 1 means the fund may amplify swings in the gold price while less than 1 means the fund would indicate smaller price swings relative to bullion.
This year, the correlation of both GDX and GDXJ with gold was 0.84, and in each of the last three periods it was between 0.82 and 0.90. Put another way, gold price movements explain about 70% of the day-to-day moves in the miners, with the rest coming from equity markets and company-specific news.
Gold miners across four market scenarios
Earlier this year, we outlined three gold scenarios for miners: rising prices, range-bound action and a pullback. We did not include a steep sell-off among our original scenarios, despite gold’s spectacular rise earlier in the year. What happened is worth reviewing.
-
Rising gold (Dec 31 – Jan 28): Miners outperformed as the scenario expected, though by a modest margin for such a sharp move in bullion.
- Steep sell-off (Jan 28 – Jun 10, in two legs): This was not the pullback scenario we originally considered. It was a deeper selloff and it was too much for miners to absorb. Share prices fell further than gold, and the resilience we expected from strong margins did not show up in share prices.
- Range-bound (Jun 10 – Oct 31): Even as gold drifted lower, equities still rose, consistent with the re-rating scenario we described.
- Pullback (year to date, Dec 31 – Oct 31): Overall, 2026 is looking much like the third scenario we had in mind. Larger producers have been more resilient while smaller-cap companies have lagged. This is not surprising, as they don’t enjoy many of the senior and mid-tier producers' advantages (liquidity, diversified sources of revenue, economies of scale and funding security). Their recovery after a sharp sell-off can also take longer.
Chart 2: Gold spot ($/oz) at the start and end of each period
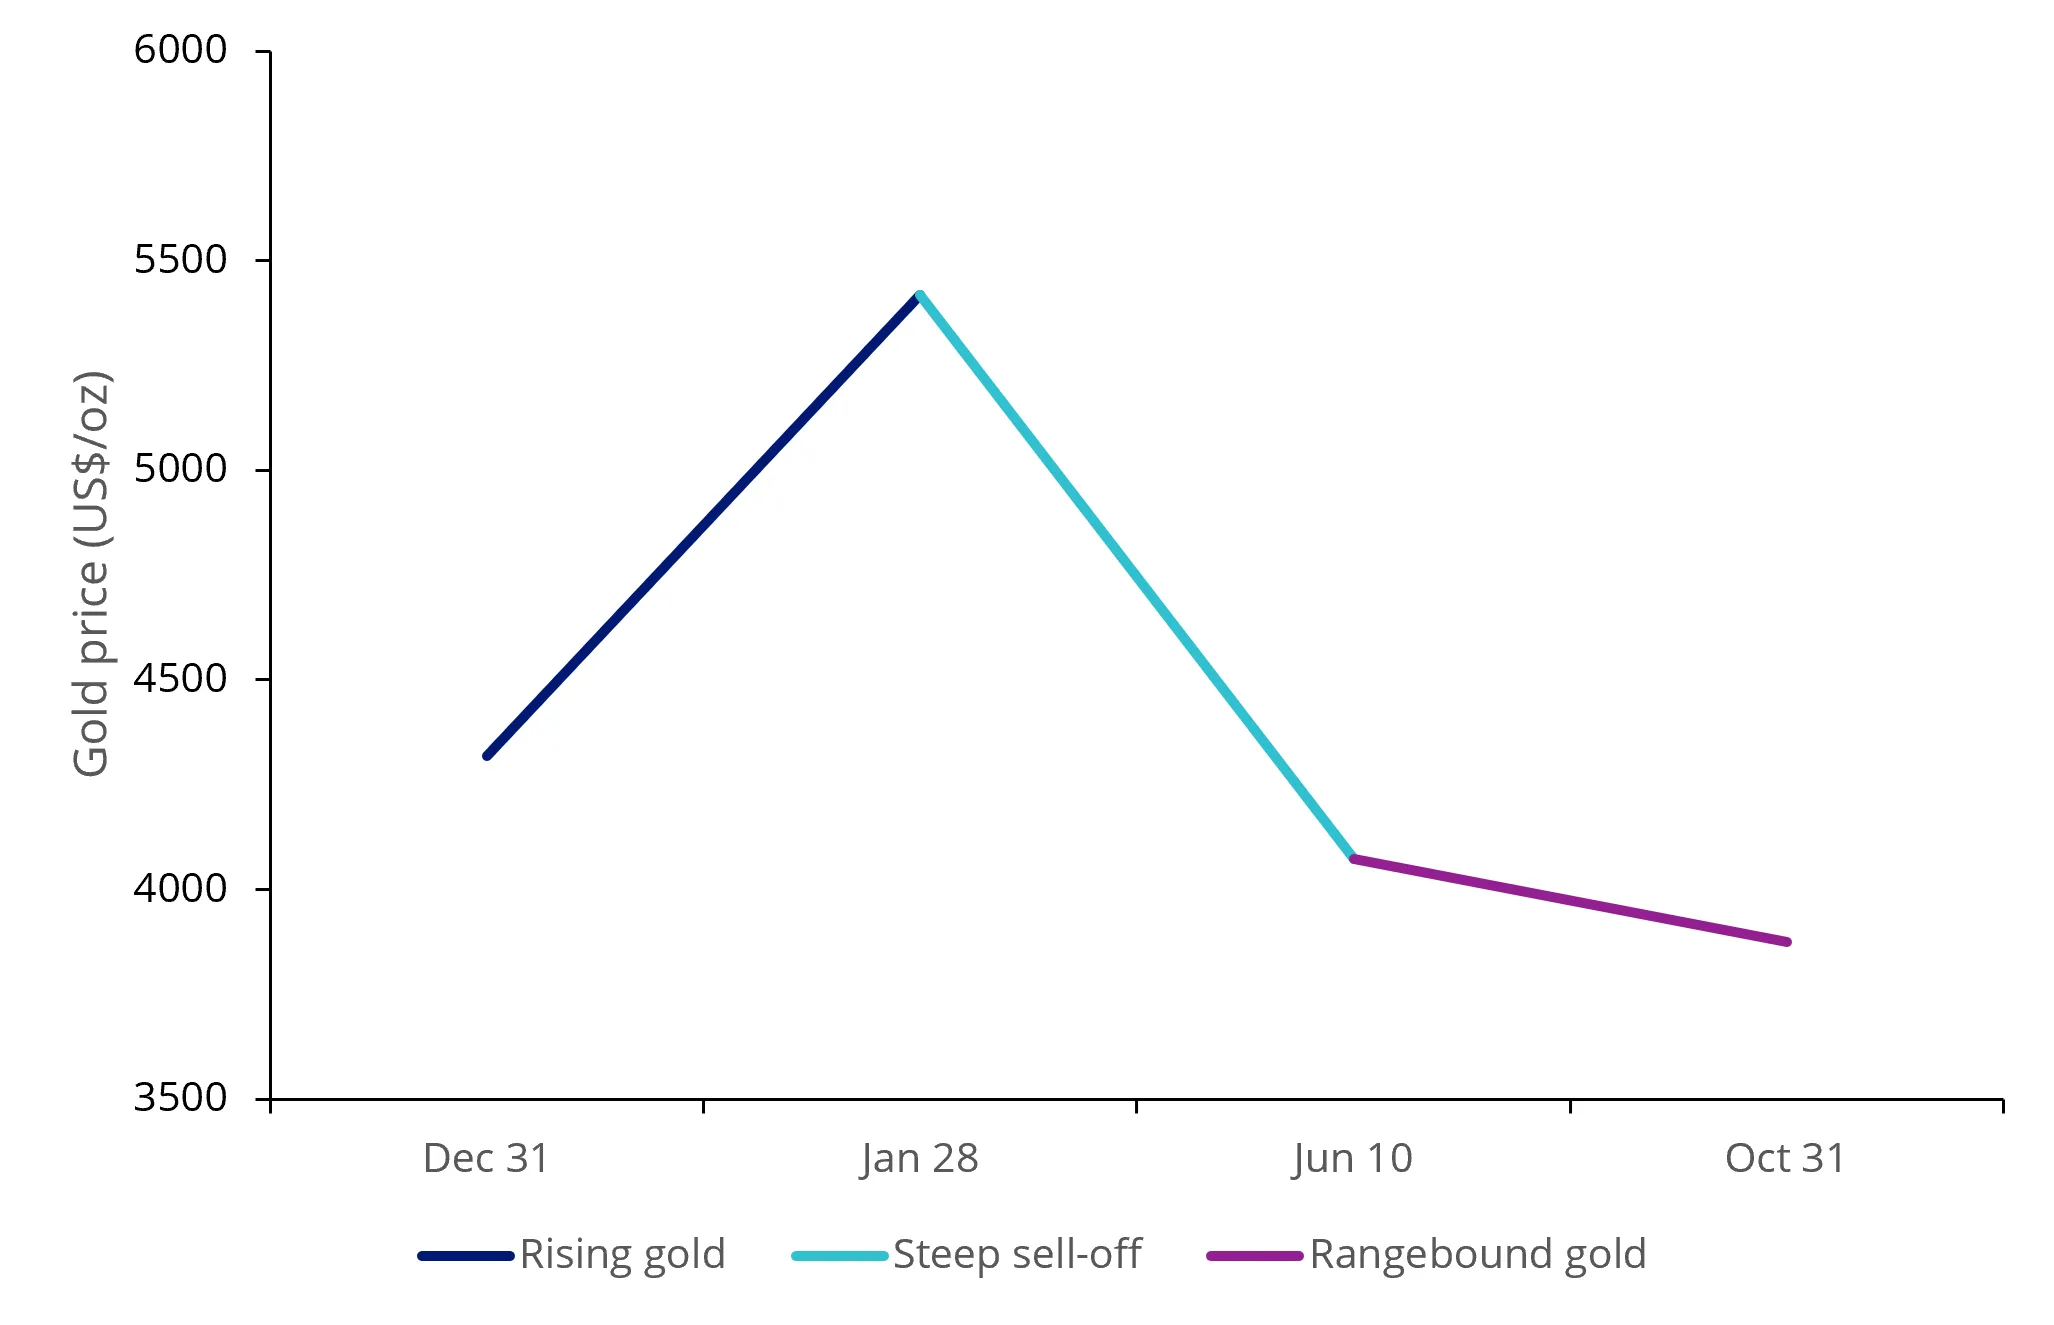
Source: VanEck and Bloomberg. Data as of 10/31/2026. Note: Return ratios compare mining stock returns with gold returns over each period. For example, a ratio of 1.2x means mining stocks rose or fell 1.2 times as much as gold. Beta measures sensitivity to daily gold returns, while correlation measures how closely daily returns move together. These measures describe different aspects of the relationship and may vary by period.
The asymmetry is worth noting. When gold surged in January, miners captured only about 1.2x to 1.3x of the move.
This is not uncommon in the earlier stages of a rally: investors doubt the higher price will last and do not fully price it into the stocks.
When gold reversed, miners fell about 1.4x to 1.5x as much. In addition, the first leg of the sell-off, which included the start of the war in Iran, featured a broad-based sell-off across global equity markets, and we believe that added to the selling pressure on gold stocks.
A market that is slow to give credit on the way up and quick to take it away on the way down can leave the stocks below what the fundamentals support. The range-bound period, when miners rose while gold drifted lower, looks like some of that gap closing.
The business behind the share price
While miners' share prices have followed gold on the way down, we believe their businesses have not weakened.
- Wide margins: Gold has risen faster than mining costs, leaving industry margins historically strong. Gold has averaged about US$4,500 an ounce so far in 2026, more than US$1,000 above the 2025 average of US$3,445. Industry-wide all-in sustaining costs are estimated to have risen by about US$300 an ounce over the same period.
- Strong balance sheets: Net cash positions continue to grow at many producers, as record free cash flow lets them pay down debt.
- Sustainable shareholder returns: Strong cash generation gives many producers flexibility to support dividends and buybacks, and some smaller companies have introduced their own capital return programs.
- Growth re-enters the conversation: After years of underinvestment, companies can step up exploration, advance organic projects and consider M&A. Replacing depleted ounces remains a challenge, especially for the largest producers, but cash generation is translating into more attractive growth prospects for the sector.
Growth spending and the valuation gap
The market’s reaction to capital plans offers another example of what we see as a valuation disconnect. However, when a gold producer announces a large project or updates project CapEx estimates, the shares often fall. Project capital estimates can rise as studies are updated, scopes change or costs increase.
Some investors may remember the previous gold bull cycle too, when capital discipline slipped. Today, however, producers are more restrained, and they can generally fund projects from operating cash flow without issuing debt or equity or putting on disproportionate gold price hedges. In addition, they set reserves, resources and project economics at gold prices that are well below spot. For projects evaluated at lower gold prices, a moderate pullback from US$4,000 may still leave expected returns above the required hurdle.
While we understand the scepticism, we believe the market's punishment of capital plans is generally excessive relative to the funding risk. We believe these fundamentals could support share prices over time, even as short-term moves remain closely tied to gold. The risks worth watching are cost inflation, operational performance and project execution.
After a year like this one, what gold stocks may need most is for gold to go quiet at these levels for a while. A calmer metal would give the companies the breathing room to show what they have built, with strong margins, net cash balances and credible growth plans without a market distracted by swings of 20% or more in the price of gold.
We believe that when investors can focus more on the underlying business and less on the next move in the metal, the stocks may have a chance to reflect these strong fundamentals.


Published: 19 November 2026
Any views expressed are opinions of the author at the time of writing and is not a recommendation to act.
VanEck Investments Limited (ACN 146 596 116 AFSL 416755) (VanEck) is the issuer and responsible entity of all VanEck exchange traded funds (Funds) trading on the ASX. This information is general in nature and not personal advice, it does not take into account any person’s financial objectives, situation or needs. You should consider whether or not an investment in any Fund is appropriate for you. Investments in a Fund involve risks associated with financial markets. These risks vary depending on a Fund’s investment objective. Refer to the applicable product disclosure statement (PDS) and target market determination (TMD) available at vaneck.com.au for more details. Investment returns and capital are not guaranteed.