When a cheaper ETF costs you more


With FY2026 tax statements out to investors, we thought it would be worthwhile considering “after tax” returns and how they relate to currency-hedged global infrastructure and property funds.
We have spoken before about the importance of changes made in 2010 under the Taxation of Financial Arrangements (TOFA) here and here.
If you’ve ever had the experience of receiving a huge distribution from an Australian dollar-hedged fund at 30 June or you’re in a fund investing in so-called ‘income assets’ and it’s not paying a distribution, there’s a good chance your fund manager has not modernised to take advantage of these new tax rules, and it turns out it can cost you after tax performance even if you are in the lowest cost fund. Many of us pay for tax expertise at tax time, we think the 2025/26 financial year provides a textbook reason for why paying a few basis points more can result in better investment outcomes.
To do this, let’s look at VanEck’s Global Infrastructure (AUD Hedged) ETF (IFRA) and our International Property (AUD Hedged) ETF (REIT). Income is not incidental to these asset classes. Historically, it has represented around 40–50% of total return over time. Therefore, how that income is delivered, and the tax that travels with it, matters a great deal to the end investor. Two structural tools govern that experience in a currency hedged strategy:
- AMIT (which stands for Attribution Managed Investment Trust rules), which can be used to allow for the smoothing of distribution, leading to income to be attributed on a fairer basis across the year; and
- the TOFA hedging election. A part of TOFA, if utilised, smooths the tax from gains on the currency-hedging instruments by accumulating the gains and losses and only bringing them to account as the underlying assets are sold, rather than pushing realised hedging gains into a single year's taxable distribution.
IFRA and REIT apply both and have done so over their long track record. This is reflected in their distribution, income and growth breakdowns which you can see here: IFRA and REIT. The nearest market equivalents do not apply TOFA (as disclosed in the fund manager’s PDS which states the TOFA hedge election, which it utilises for other AUD hedged products, is not extended to its Global Infrastructure (AUD Hedged) ETF or its International Property (AUD Hedged) ETF).
Until this year that was only a disclosure point. The FY2025/2026 tax statements now show what it means in practice relative to IFRA and REIT, and how it can impact an investor’s performance.
The numbers speak for themselves
The nearest Global Infrastructure (AUD Hedged) ETF declared a full-year distribution of 182 cents per unit (cpu) against foreign income reported of 302 cpu. This equates to 165% of the distribution and roughly a 10% yield on a $31.92 NAV.
Quarterly distribution amount
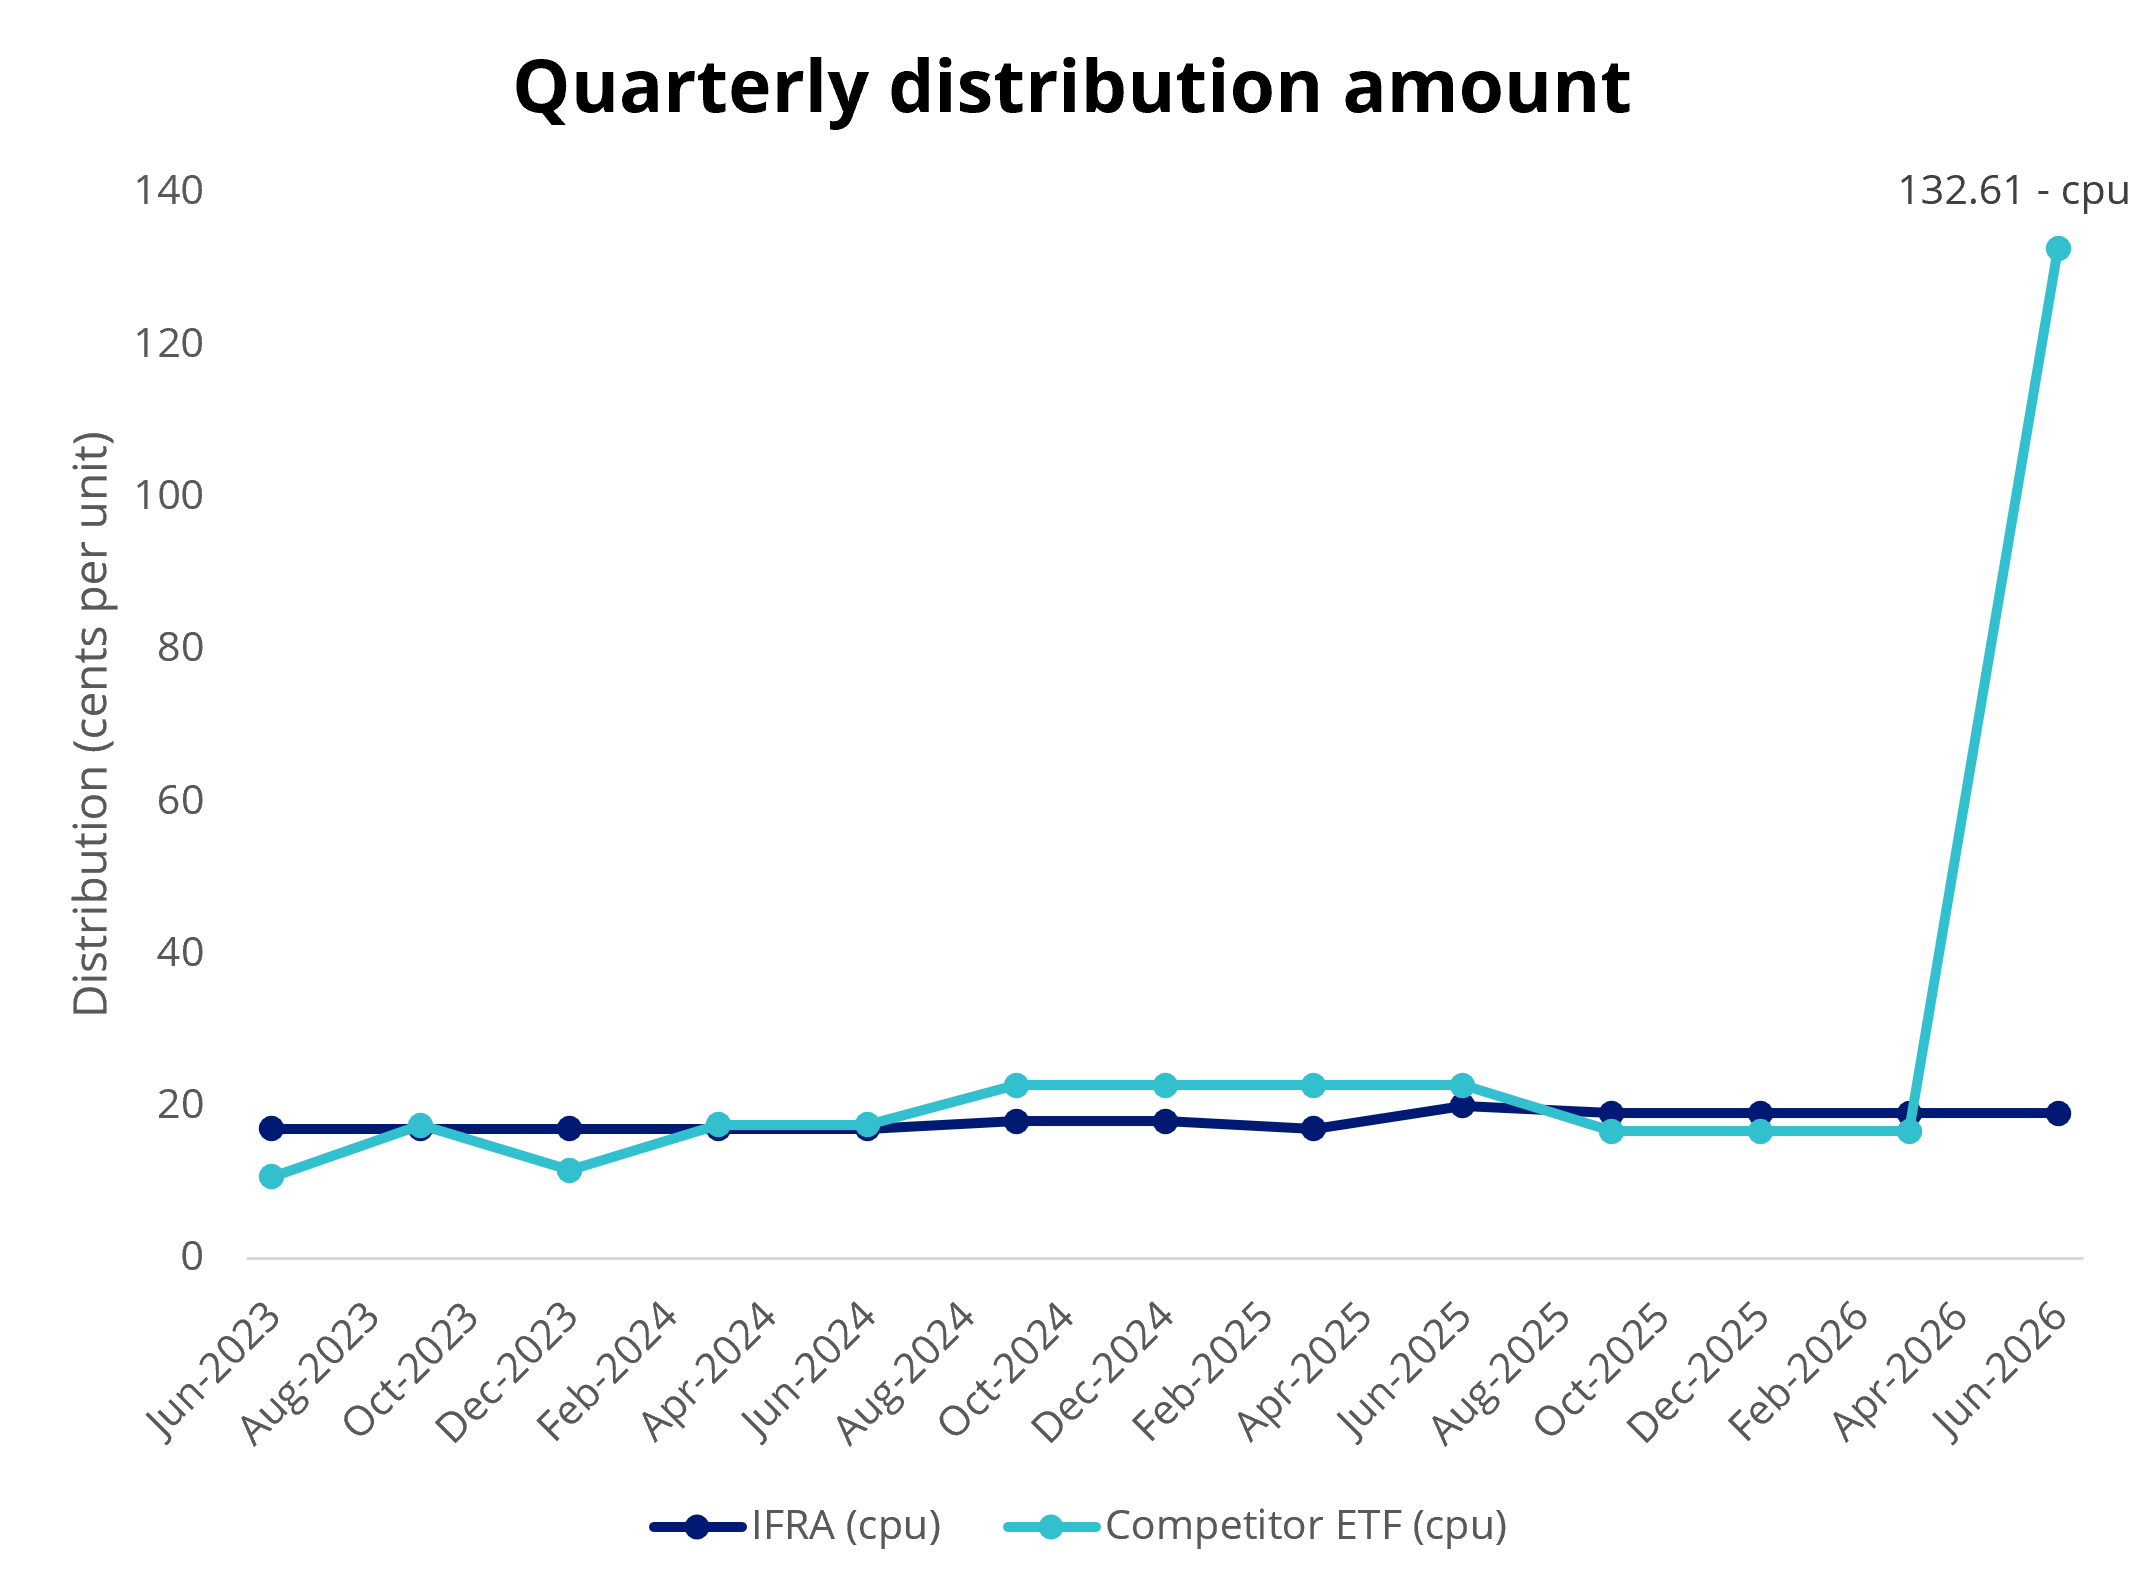
Source: VanEck, competitor’s website as at 31 July 2026. Distribution payment history is not a guarantee of future distributions payable.
In the case of its International Property (AUD Hedged) ETF, a full-year distribution of 143 cpu was declared against foreign income of 286 cpu. This represents 200% of the distribution, and again roughly a 10% yield on a $29.30 NAV.
Quarterly distribution amount
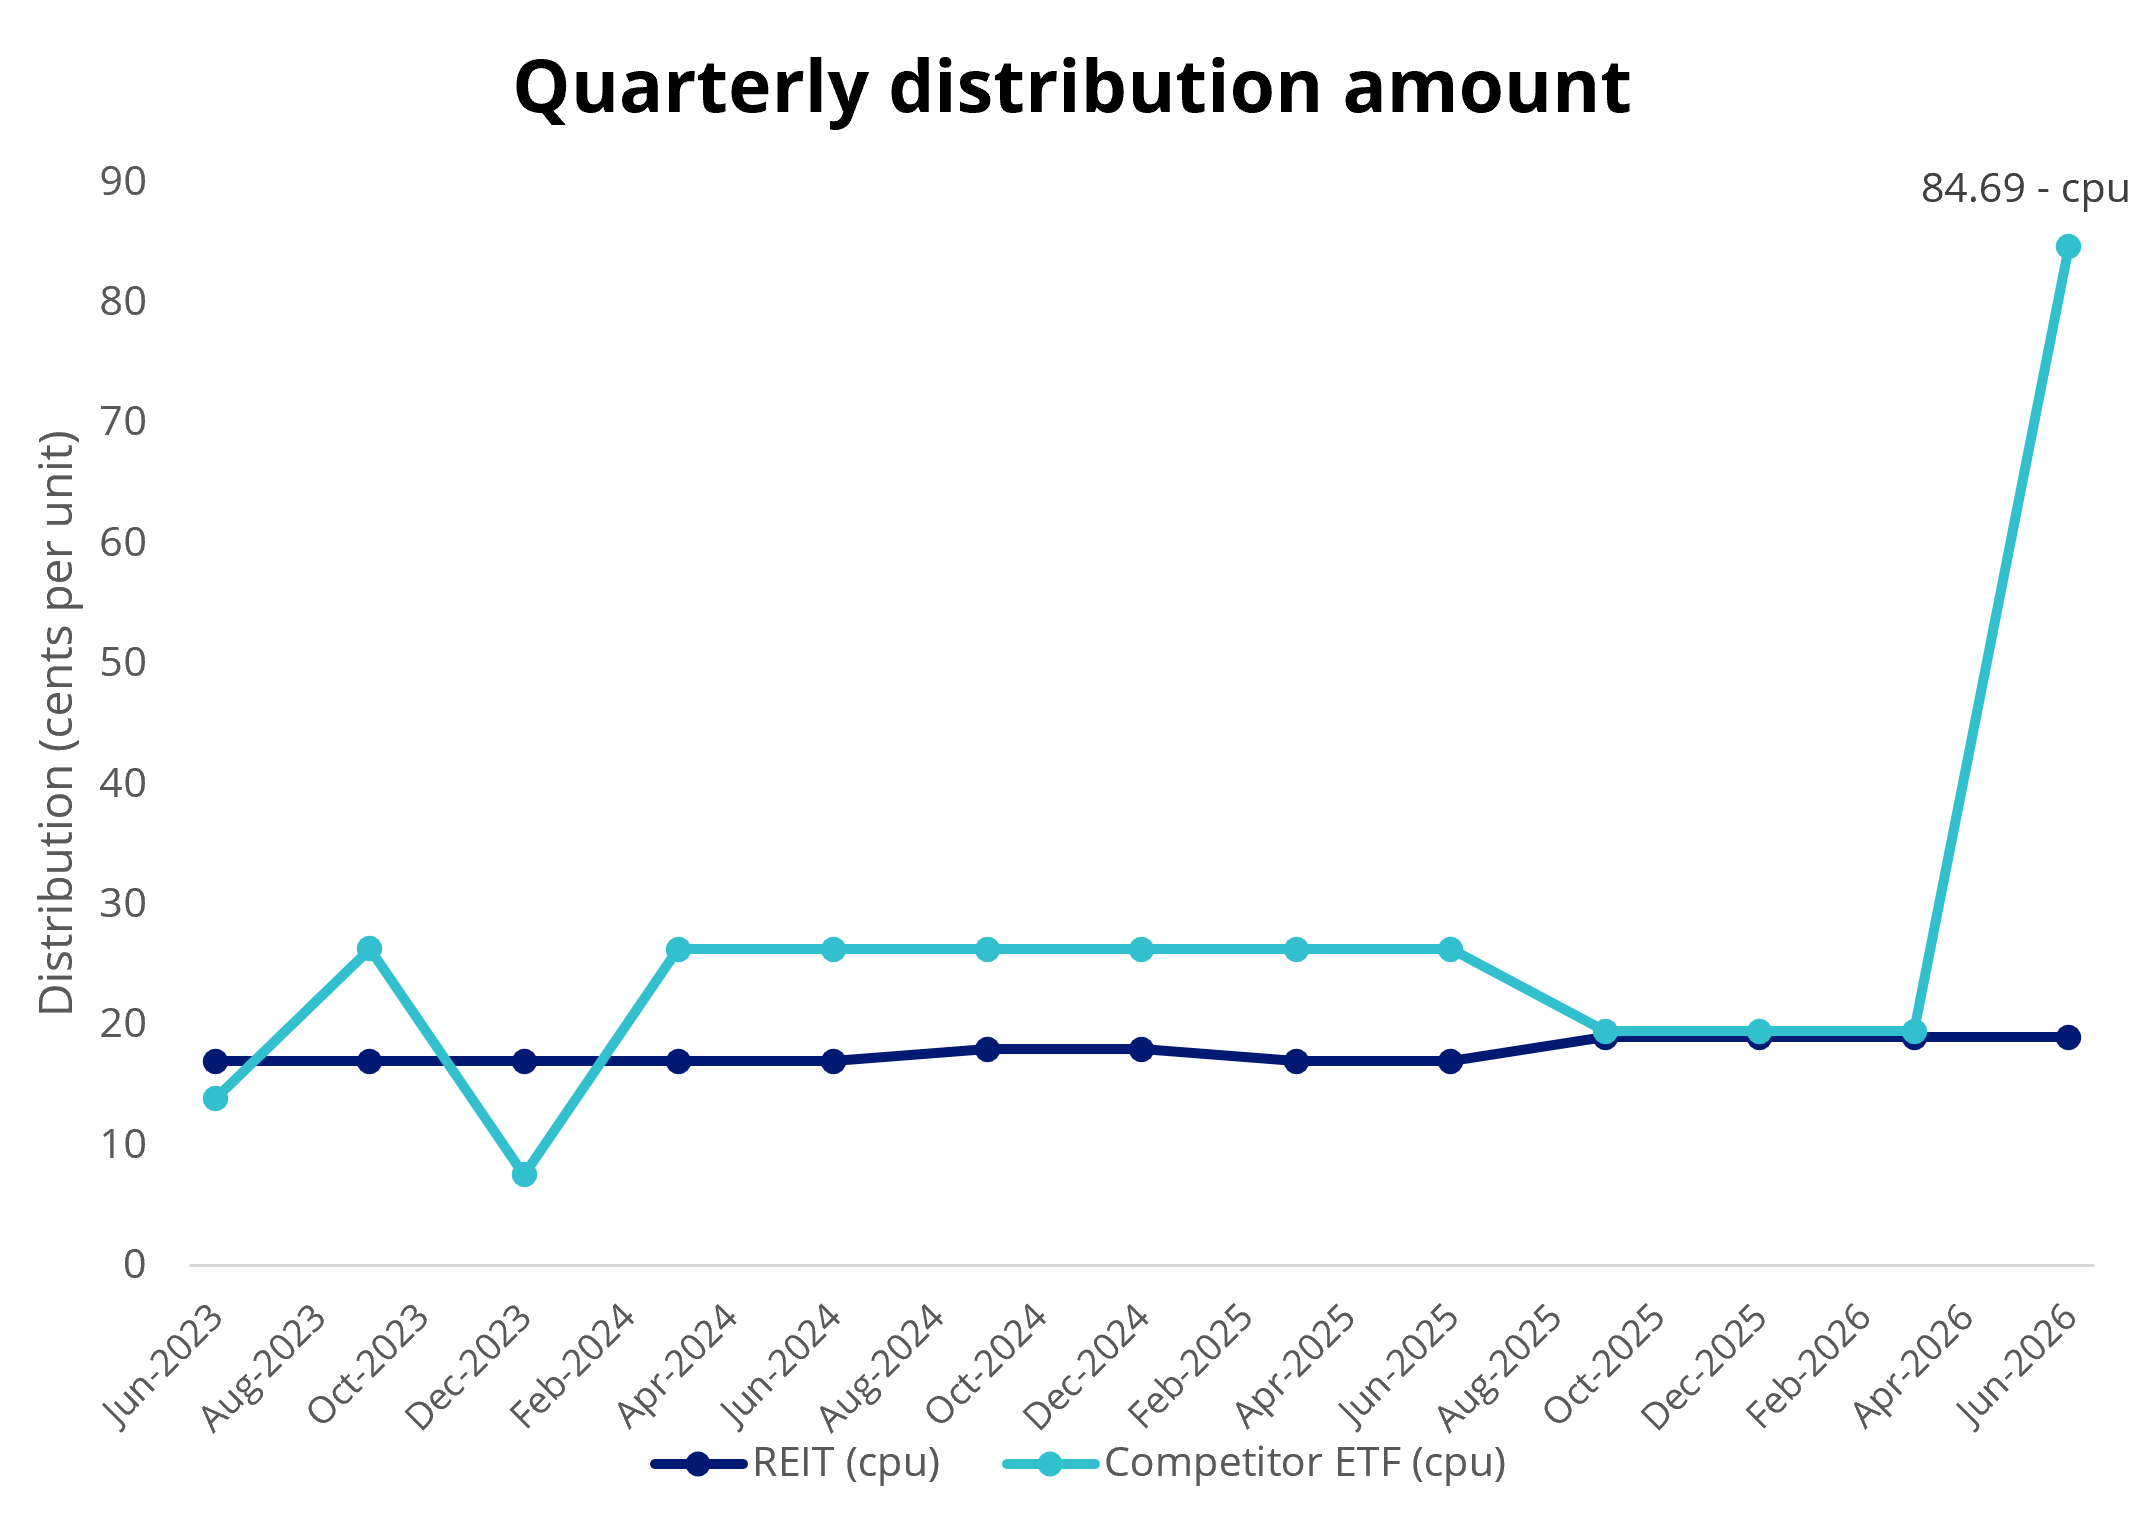
Source: VanEck, competitor’s website as at 31 July 2026. Distribution payment history is not a guarantee of future distributions payable.
That extra-large dividend sounds appealing on paper, but it is also not realistic. Global infrastructure and property investments simply do not yield 10% in dividend income in a quarter.
Currency hedges generated large profits this past financial year – a phenomenon which we also observed in our own funds. This means the most credible explanation is that most of that reported "foreign income" is the realised profit on rolling those hedges.
The distribution pattern tells the same story for the competitor funds: smoothed three quarters and then paid a large fourth-quarter lump (roughly 133 cpu and 85 cpu respectively at 30 June), alongside sizeable cost-base adjustments which are the hallmarks of absorbing a tax hit that TOFA is designed to prevent.
The impact on after-tax returns
The difference shows up in the after-tax returns. At the highest marginal tax rate of 47%, the competitor's Global Infrastructure ETF delivered an after-tax return of 12.62% for FY2025/26, compared to 15.18% for IFRA. That's a gap of 2.56 percentage points, on funds that delivered almost identical pre-tax returns of 17.58% and 17.34% respectively. Even at a 15% tax rate, think superannuation funds, the gap persists: 16.46% versus 16.91%.
The story is similar for two comparable international property ETFs. On a pre-tax basis, the two funds were again nearly neck and neck: 14.99% for the competitor's International Property ETF versus 15.01% for REIT. But after tax, the picture changes. At a 47% marginal rate, the competitor's fund returned just 10.48% compared to REIT's 13.03%. That’s a gap of more than 2.5 percentage points. For superannuation investors on a 15% tax rate, the margin is smaller but still meaningful: 14.03% versus 14.80%.
The drag in both scenarios isn't coming from fees or stock selection. It's coming from tax, and specifically from the decision not to apply TOFA.
In addition to lumpy returns, a manager that has not elected to implement TOFA, has the potential to deliver worse after-tax outcomes.
Applying TOFA is difficult: it requires audited hedge-accounting, an ATO-auditable trail, tax and portfolio teams working in lockstep and bespoke systems. That is why few managers choose to even take it on. But it is exactly the kind of expertise we think investors should consider because sometimes, a fund’s lower fees come with a sizeable catch.
For those investors in hedged funds, both IFRA and REIT benefit from low 0.20% p.a. management fees and it comes with the tax expertise required to implement TOFA and AMIT.
With one trade in these two ETFs, investors can gain access to:
| IFRA | REIT | |
| Portfolio | 136 of the world's largest infrastructure securities | 300+ of the world's largest listed real estate companies |
| Income | Quarterly | Quarterly |
| Management Fee | 0.20% p.a.* | 0.20% p.a.* |
| Access | One trade on the ASX | One trade on the ASX |
* Other costs may apply. Refer to the PDS for more details.
Key risks
An investment in our global infrastructure and international property ETFs carry risks associated with: ASX trading time differences, financial markets generally, individual company management, industry sectors, foreign currency, currency hedging, country or sector concentration, political, regulatory and tax risks, fund operations, liquidity and tracking an index. See the relevant PDS and TMD for more details.
IFRA and REIT are likely to be appropriate for a consumer who is seeking capital growth and a regular income distribution, is intending to use the product as a minor or satellite allocation within a portfolio, has an investment timeframe of at least 5 years, and has a high to very high risk/return profile.


Published: 21 August 2026
Any views expressed are opinions of the author at the time of writing and is not a recommendation to act.
VanEck Investments Limited (ACN 146 596 116 AFSL 416755) (VanEck) is the issuer and responsible entity of all VanEck exchange traded funds (Funds) trading on the ASX. This information is general in nature and not personal advice, it does not take into account any person’s financial objectives, situation or needs. You should consider whether or not an investment in any Fund is appropriate for you. Investments in a Fund involve risks associated with financial markets. These risks vary depending on a Fund’s investment objective. Refer to the applicable product disclosure statement (PDS) and target market determination (TMD) available at vaneck.com.au for more details. Investment returns and capital are not guaranteed.
