Quality at a fair price is back in favour


Warren Buffett, the world’s most famous investor, was known for his patience. He also popularised the concept of an economic moat, a company’s ability to maintain its competitive advantages and defend its long-term profitability. Economic moats are the philosophy behind the VanEck Morningstar Wide Moat ETF (MOAT).
So far this month, MOAT is outperforming the S&P 500 by 4.47% and over the past month, it has an 11.33% lead over the benchmark. The recent run also means MOAT is now ahead of the index on every period up to 1 year (as at 11 November 2026, past performance is not indicative of future performance).
Below we explain the current portfolio positioning that has driven recent results and why the combination of souring AI sentiment and enduring earnings growth may help MOAT in the coming period.
Wide moat investing starts with competitive advantageAs an investor, Buffett popularised both the ideas of investing in high quality companies as well as finding firms with an economic ‘moat’. That is, firms with an ability to maintain their competitive advantages and defend their long-term profitability. This is the foundational philosophy behind MOAT.
MOAT’s quality-anchored principles have been tested in the last few years as investors piled into a select few technology stocks linked to the AI megatrend.
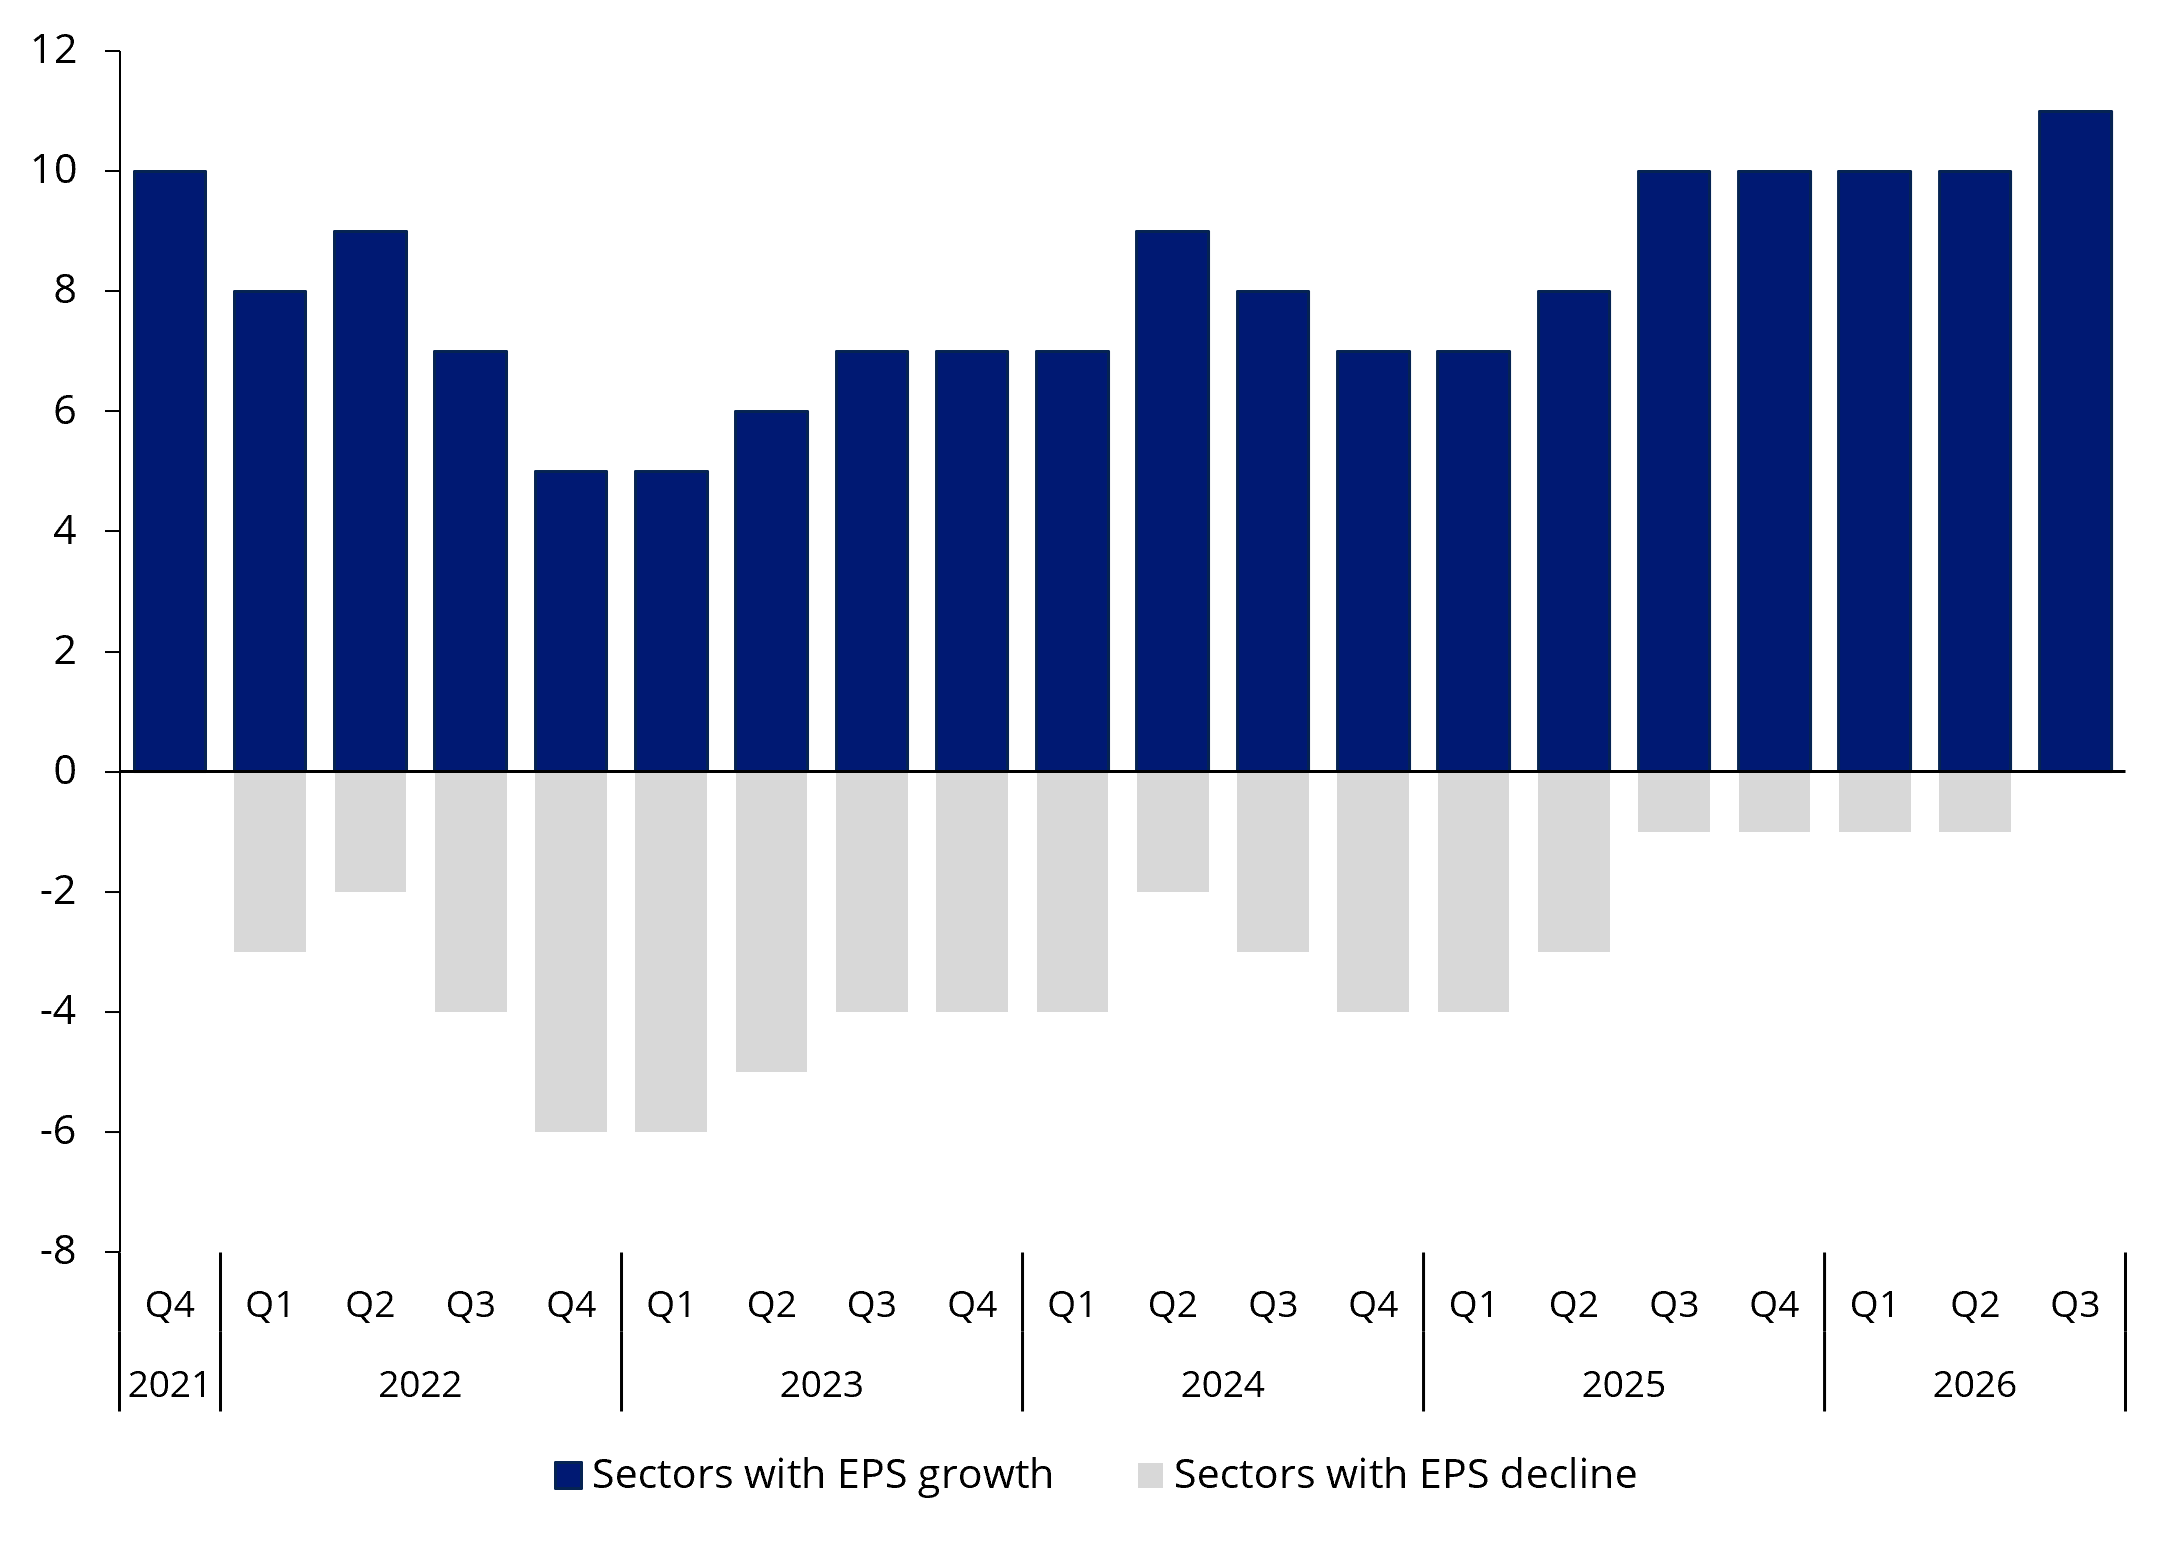
US earnings growth extends beyond big techAs of 3 November 2026, 64% of the S&P 500 have reported earnings, with average year-over-year growth of 28%. Every sector is now reporting positive earnings growth for the first time since 2021.
Chart 1: Number of S&P 500 sectors with earnings growth vs decline
Source: Bloomberg Intelligence, VanEck as at 3 November 2026
Historically, that would have led to a rise in share prices. But rising CapEx bills, especially among AI-linked names, have meant share prices have barely budged.
In the wake of the US midterm election results, the Magnificent Seven lost over US$1 billion in market capitalisation. Falls have since continued for many of these names, including Nvidia (NASDAQ: NVDA), which is now down nearly 30% from its early October high.
Note that does not mean these companies have become bad businesses. Many of them are still considered to have a wide moat. It is their share prices that were attracting the most concern, reaching heights for which the margin for error was thin. Last month, MOAT outperformed the S&P 500 by over 11% in part due to holding underweight positions in these companies.
US stock selection beyond the biggest namesInvesting is not just about what you don’t own. It’s also about what you do own, and how much of it.
The relative overweights to wide moat companies Estée Lauder and GE HealthCare have contributed to relative returns over the last one, three and six months.
Estée Lauder (NYSE: EL)’s Q1 2027 report showed adjusted earnings per share of $0.72, comfortably beating analyst estimates of $0.51. It also beat on net sales and reported single-digit sales growth. But management’s upgrade to the fiscal 2027 outlook was what got investors most excited. A willingness among affluent consumers and younger shoppers to spend on prestige beauty products allowed management to increase its projections for full year sales and EPS growth.
GE Healthcare (NASDAQ: GEHC) beat on the top and bottom line in its quarterly result as well. And like Estée Lauder, it was able to raise its full year guidance for organic revenue growth and EPS. The conglomerate also has a large order backlog: US$23.7 billion and counting. Large order backlogs can provide visibility over future revenue and indicate strong product demand.
Wide moat companies at reasonable pricesGE Healthcare and Estée Lauder are just two examples of why inclusion in MOAT is different to a broad US equity market tracking fund.
In addition to being identified by Morningstar analysts as having structural advantages that Morningstar expects to support returns above the cost of capital for at least 20 years.
That discipline, quality at a reasonable price, plus patience is what Buffett has practised for sixty years.
As at the end of October, MOAT traded on 19.3 times forecast earnings, compared with 20 times for the S&P 500, with a similar return on equity. Its companies carried more debt, but investors were paying less for each dollar of expected earnings.
A broader US market opportunity for MOATLooking forward, the risks continue to be real for the top end of the US equity market. Regulatory pressure on big tech is building across multiple jurisdictions. The return on hyperscaler AI capital expenditure remains uncertain.
The last few months of outperformance are, we think, not an anomaly. Wide moat companies with durable competitive advantages and reasonable valuations tend to compound wealth over time. And we think it is these companies that investors will seek in the coming economic environment. We wrote about the rotation into quality stocks in our most recent Vector Insights, which you can read here.
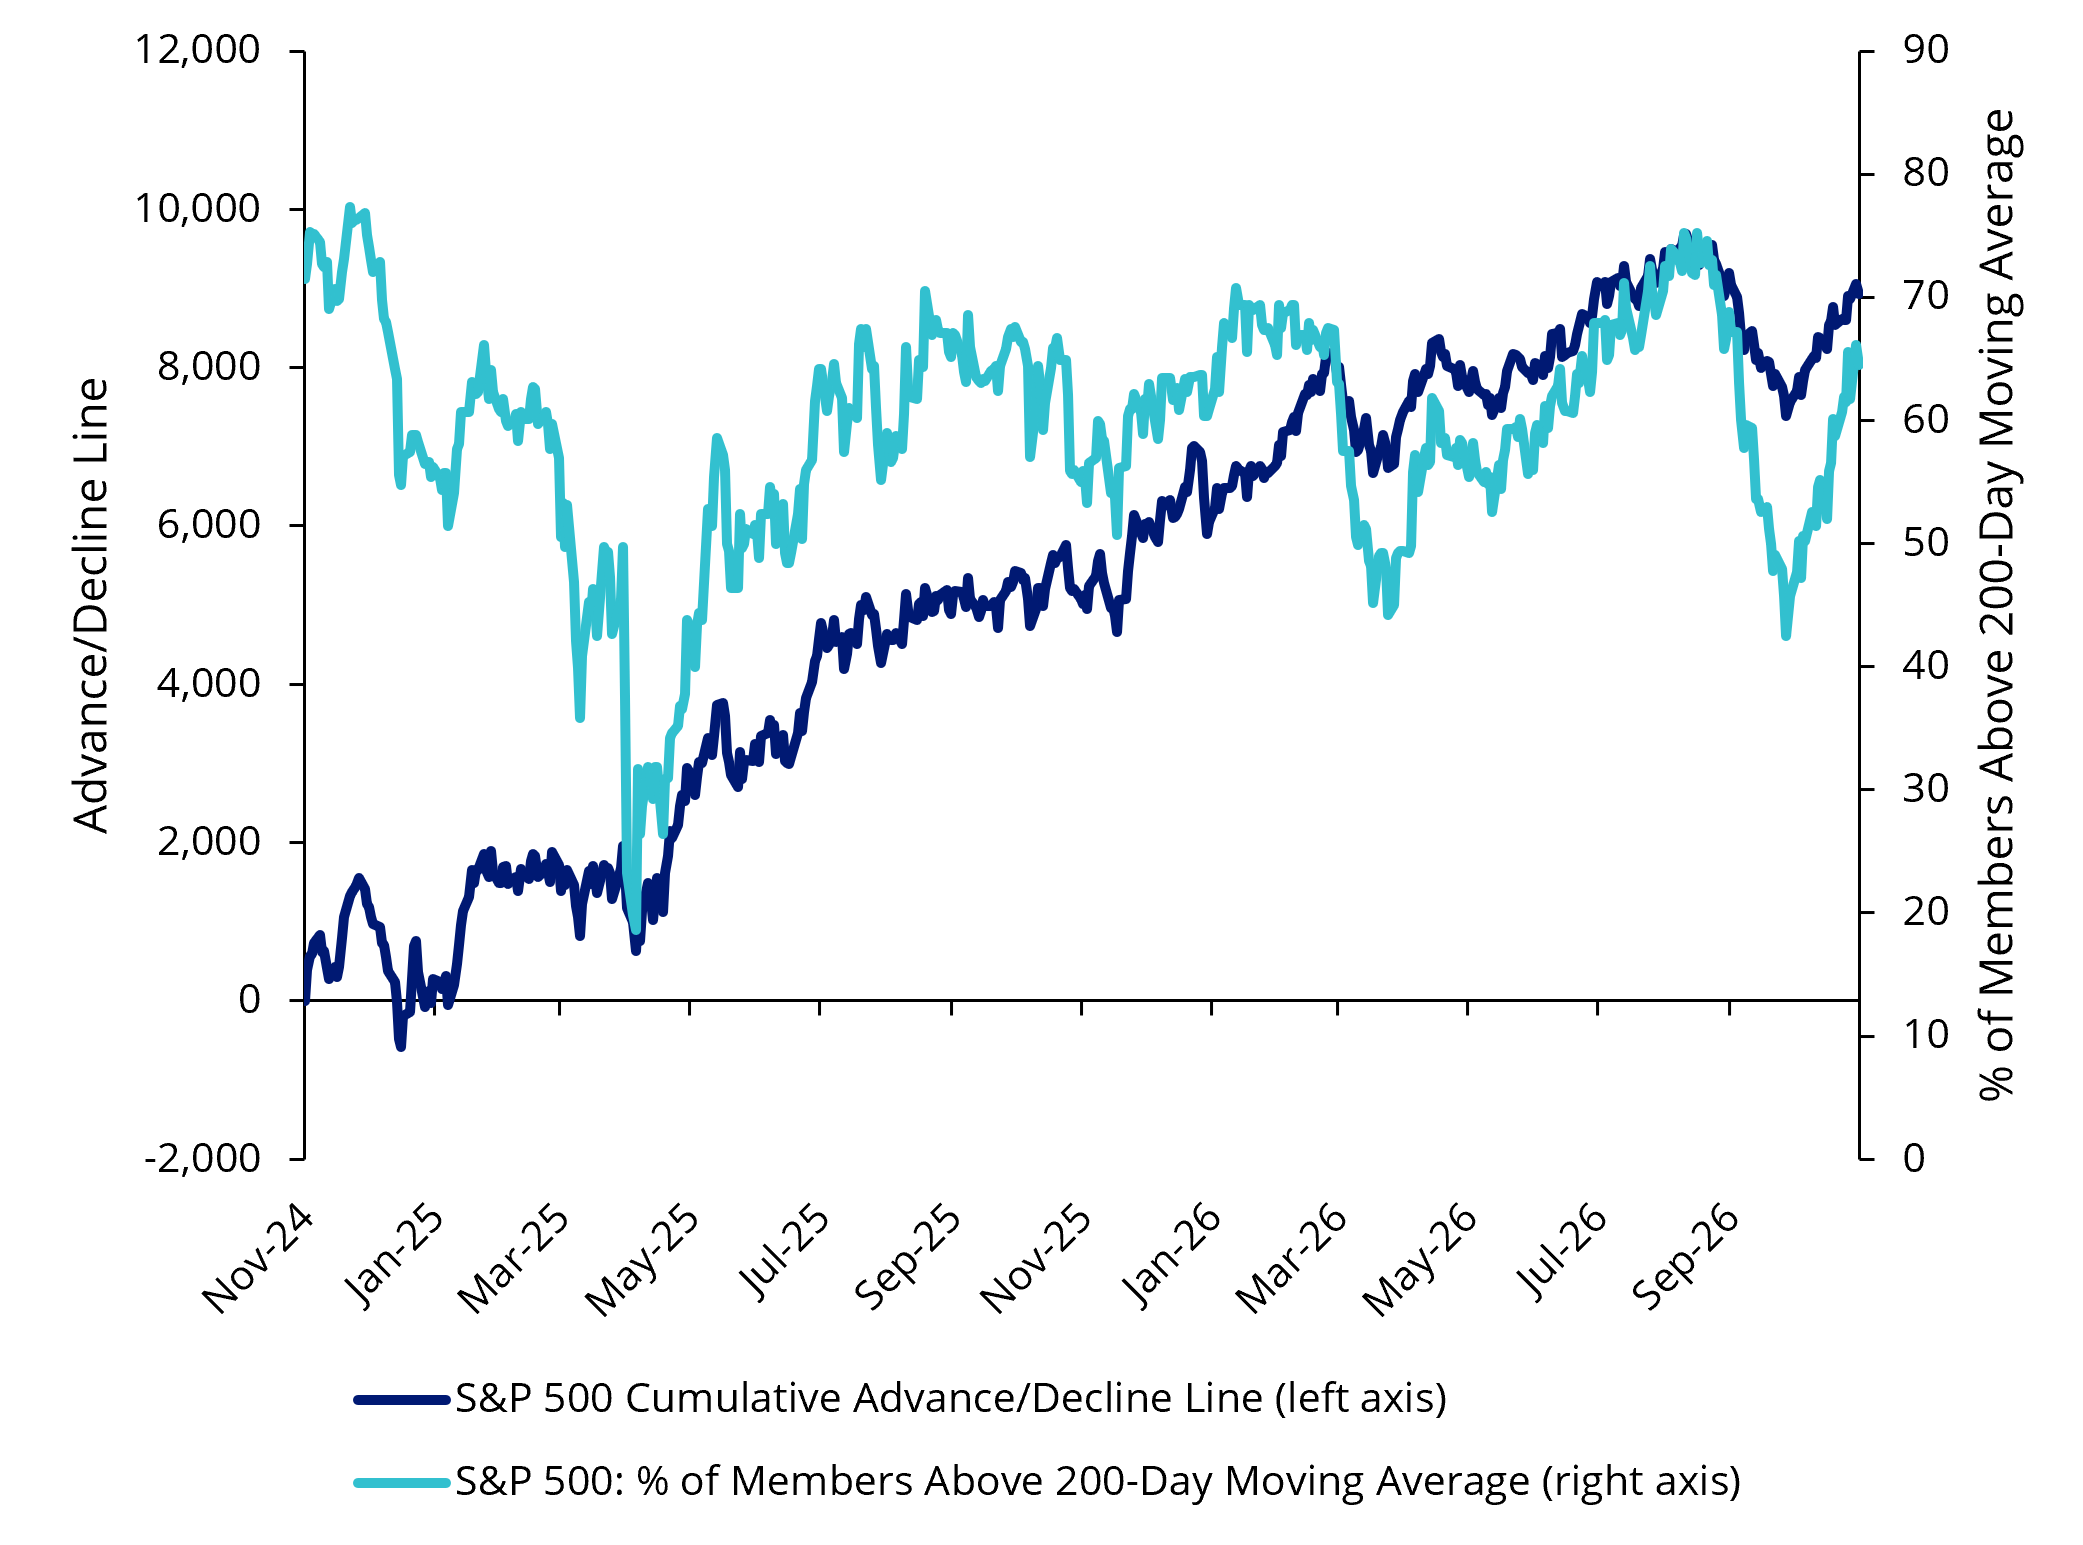
In addition, the US equity market’s gains are now broadening. The percentage of stocks that now have share prices trading above their 200-day moving average has risen to levels not seen since July. Broader participation may help extend the market’s rally.
Chart 2: S&P 500: Advance/decline line vs % of members above 200-day moving average
Source: Bloomberg, as at 4 November 2026.
For those who have been concerned about MOAT’s medium-term performance, we would argue that its three-year and five-year relative returns reflect the dominance of US mega-cap technology stocks during those periods. A small number of large companies drove much of the benchmark’s returns. As those stocks retreat, the valuation discipline that led MOAT to underweight them has helped drive its recent outperformance.
We remain fully committed to MOAT’s process, and we believe the current macro and earnings environment is validating it. Further, we expect that, over the long term, the fund will continue to have a place in Australian investors’ portfolios as a selective exposure to the US equity market.
Trailing performance to 11 November 2026 (%)
| MTD | 1 month | 3 months | 6 months | Year to date | 1 year | 3 years (p.a.) | 5 years (p.a.) | 10 years (p.a.) | Since inception (p.a.) | |
|---|---|---|---|---|---|---|---|---|---|---|
| VanEck Morningstar Wide Moat ETF | 6.72 | 9.28 | 6.42 | 21.27 | 9.39 | 11.47 | 14.25 | 11.17 | 15.25 | 14.72 |
| S&P 500 TR AUD | 1.81 | -2.02 | 0.18 | 7.98 | 7.86 | 5.81 | 17.90 | 13.27 | 16.27 | 14.89 |
| Excess return | 4.91 | 11.31 | 6.25 | 13.30 | 1.53 | 5.67 | -3.65 | -2.10 | -1.02 | -0.18 |
*ASX Inception date is 26 June 2015
Source: Morningstar Direct, VanEck. The chart and table above show the past performance of MOAT and of the S&P500 Index. You cannot invest directly in an index. Results assume immediate reinvestment of distributions. MOAT results are net of management fees and other costs incurred in the fund, but before brokerage fees and bid/ask spreads incurred when investors buy/sell on the ASX. Returns for periods longer than one year are annualised. Past performance is not indicative of future performance. The S&P 500 is shown for comparison purposes as it is the widely recognised benchmark used to measure the performance of the broad US equities market. It includes the 500 largest US listed companies, weighted by market capitalisation. MOAT’s index measures the performance of 40 to 80 US companies with a Morningstar Economic Moat Rating™ of “Wide”. MOAT’s index has fewer securities and different industry allocations than the S&P 500.
MOAT is not designed to maximise performance during periods of extreme benchmark concentration in overvalued growth. It aims to compound capital across cycles through disciplined exposure to businesses with durable competitive advantages priced at reasonable valuations. This style of investing requires the patience that Warren Buffett preached.
Key risks
An investment in our wide moat ETF carries risks associated with: ASX trading time differences, financial markets generally, individual company management, industry sectors, foreign currency, country or sector concentration, political, regulatory and tax risks, fund operations and tracking an index. See the VanEck Morningstar Wide Moat ETF PDS and TMD for more details.
MOAT is likely to be appropriate for a consumer who is seeking capital growth, is intending to use the product as a core, minor or satellite allocation within a portfolio, has an investment timeframe of at least 5 years, and has a high risk/return profile.


Published: 12 November 2026
Any views expressed are opinions of the author at the time of writing and is not a recommendation to act.
VanEck Investments Limited (ACN 146 596 116 AFSL 416755) (VanEck) is the issuer and responsible entity of all VanEck exchange traded funds (Funds) listed on the ASX. This is general advice only and does not take into account any person’s financial objectives, situation or needs. The product disclosure statement (PDS) and the target market determination (TMD) for all Funds are available at vaneck.com.au. You should consider whether or not any Fund is appropriate for you. Investments in a Fund involve risks associated with financial markets. These risks vary depending on a Fund’s investment objective. Refer to the applicable PDS and TMD for more details on risks. Investment returns and capital are not guaranteed.
The Morningstar® Wide Moat Focus Index™ and the Morningstar® Developed Markets ex-Australia Wide Moat Focus Index™ (‘the Morningstar Indices’) are created and maintained by Morningstar, Inc. Morningstar, Inc. does not sponsor, endorse, issue, sell, or promote the Funds and bears no liability with respect to the Funds or any security. Morningstar®, the Morningstar Indices and Morningstar Economic Moat™ are trademarks of Morningstar, Inc. and have been licensed for use by VanEck by Morningstar Australasia Pty Ltd (ABN 95 090 665 544, AFSL 240892).