The enemy of great is good


You would think that if the share market reported aggregate earnings growth of nearly 30%, investors would be cheering. Not so in this environment.
It’s not that investors are disappointed by the growth, rather they are considering the earnings growth, which has occurred in the past, against future spending plans.
For instance, Microsoft (NASDAQ: MSFT) generated more than US$18 billion in quarterly free cash flow and lowered its capital expenditure (CapEx) outlook by US$5 billion. Investors reacted positively. On the other hand, Amazon (NASDAQ: AMZN) reported trailing free cash outflow of US$42.4 billion for the third quarter of 2026 after its CapEx bill exceeded US$77 billion. The bill was larger than the market had anticipated, which led to a significant fall in its post-reporting share price.
The impact, we think, could be a change in factor leadership. The case is strengthening for businesses whose earnings and financial strength can support their ambitions through good times and bad. These are the investments that piqued the interest of investing legends Benjamin Graham and Warren Buffett. Today, we call them quality companies.
The good news and the bad news
As of 30 October 2026, more than 82% of the 301 S&P 500 companies that had reported have beaten analyst expectations for earnings. They are beating them by an average of 3.2%, which is higher than what the S&P/ASX 200 achieved in August.
More broadly, Q3 earnings growth for the S&P 500 sits at +29.4%. While that is much lower than the 53.4% recorded in Q2, they are still extraordinary numbers, and mega-cap tech stocks leveraged to the AI megatrend continue to bask in the sun.
But the devil is in the detail, and the liabilities side of the balance sheet is providing plenty of it. Hyperscaler capital expenditures have now surged past US$700 billion for 2026, up more than 80% year over year. This number is projected to surpass US$1 trillion by next year.
To keep up with it, firms such as Alphabet and Amazon are committing more operating cash flow to expansion. Meanwhile, Meta is planning to raise nearly US$100 billion to expand its AI infrastructure, a move that has some investors asking whether this will become the new norm for mega-tech firms that are spending more than they may be able to generate in future revenue.
In this way, the enemy of great is good, and the market is starting to signal that these results which were great are now good.
An old discipline for a demanding market
As far back as the 1930s, when Benjamin Graham would have been taking lessons from the Great Depression, he could see the long-term value of quality investing.
In his landmark 1949 book The Intelligent Investor, he argued that investors should demand “a sufficiently strong financial position and the potential that its earnings will at least be maintained over the years.”
Those principles underpin the modern quality approach. Commonly accepted attributes of a ‘quality’ company include its profitability, earnings reliability, debt levels and balance sheet strength.
For its quality indices, MSCI considers three financial characteristics:
- High return on equity;
- Stable year-on-year earnings growth; and
- Low financial leverage.
Companies that exhibit these traits can better withstand the extremes of the economic cycle.
Healthcare, technology and consumer staples are examples of sectors where quality is often found. Demand for medicines, everyday essentials and some technology services tend to persist irrespective of the economic cycle.
But sector membership alone does not establish quality. The company still needs the profitability, earnings stability and financial strength to qualify.
Table 1: QUAL, which tracks a MSCI Quality Index, is overweight to consumer staples and healthcare and underweight consumer discretionary and financials
|
|
|
MSCI World ex Australia Index (%) |
Difference (%) |
|
Communication Services |
9.80 |
7.26 |
2.54 |
|
Consumer Discretionary |
3.47 |
8.72 |
-5.25 |
|
Consumer Staples |
8.31 |
5.40 |
2.91 |
|
Energy |
0.07 |
4.59 |
-4.52 |
|
Financials |
10.94 |
15.71 |
-4.77 |
|
Health Care |
16.30 |
10.26 |
6.04 |
|
Industrials |
12.79 |
10.85 |
1.94 |
|
Information Technology |
36.37 |
30.31 |
6.06 |
|
Materials |
1.80 |
2.83 |
-1.03 |
|
Real Estate |
0.14 |
1.56 |
-1.42 |
|
Utilities |
-- |
2.51 |
-2.51 |
Source: FactSet, as at 31 October 2026.
Losing less matters
Historically, quality companies have lost less and recovered faster during periods associated with market falls and deteriorating economic conditions.
The size of a loss determines how much ground an investor must recover. For instance, a stock that falls 20% needs a 25% gain to return to its starting value while a 40% fall requires a gain of almost 67%. A 50% fall requires a subsequent 100% gain to get back to the previous high.
Using MSCI’s World ex Australia Quality Index and comparing its performance to the broad market benchmark during the the dot-com collapse, global financial crisis and COVID sell-off shows that the international quality index experienced smaller falls and regained its previous highs sooner than the broader market index.
Table 2: Quality companies historically lose less and recover faster
|
Quality Index (Maximum Drawdown) |
Benchmark (Maximum Drawdown) |
Relative recovery rate of Quality Index |
|
|
March 2000 - Dot-com bubble |
-45.02% |
-48.74% |
10 months faster |
|
October 2007 - Stock market sell off |
-21.95% |
-34.93% |
9 months faster |
|
August 2008 - Lehman Brothers filed for bankruptcy |
-14.76% |
-24.73% |
16 months faster |
|
April 2010 - European sovereign debt crisis |
-6.48% |
-13.83% |
11 months faster |
|
February 2020 - COVID-19 |
-19.62% |
-23.71% |
8 months faster |
Source: MSCI, VanEck, Morningstar Direct. Comparison of drawdown between the MSCI World ex Australia Quality Index (‘Quality Index’) versus the MSCI World ex Australia Index (‘Benchmark’). Maximum drawdown is the peak to trough decline from the start of the month specified to the recovery date, expressed as a percentage. The rate of recovery is the number of periods taken to recover from the trough to peak incline, it is shown here relative to the benchmark. The calculations for the above include the reinvestment of all dividends but do not include fees and other costs associated with an investment in QUAL. You cannot invest in an index. Past performance is not indicative of future performance of the index or QUAL.
Quality has also outperformed during periods of increased volatility. In the five most recent periods of increased volatility (including the last week of October 2026 when the S&P 500 Volatility Index, or the VIX, rose 31% in a week), quality outperformed the benchmark in each instance.
Chart 1: Relative performance of Quality vs VIX
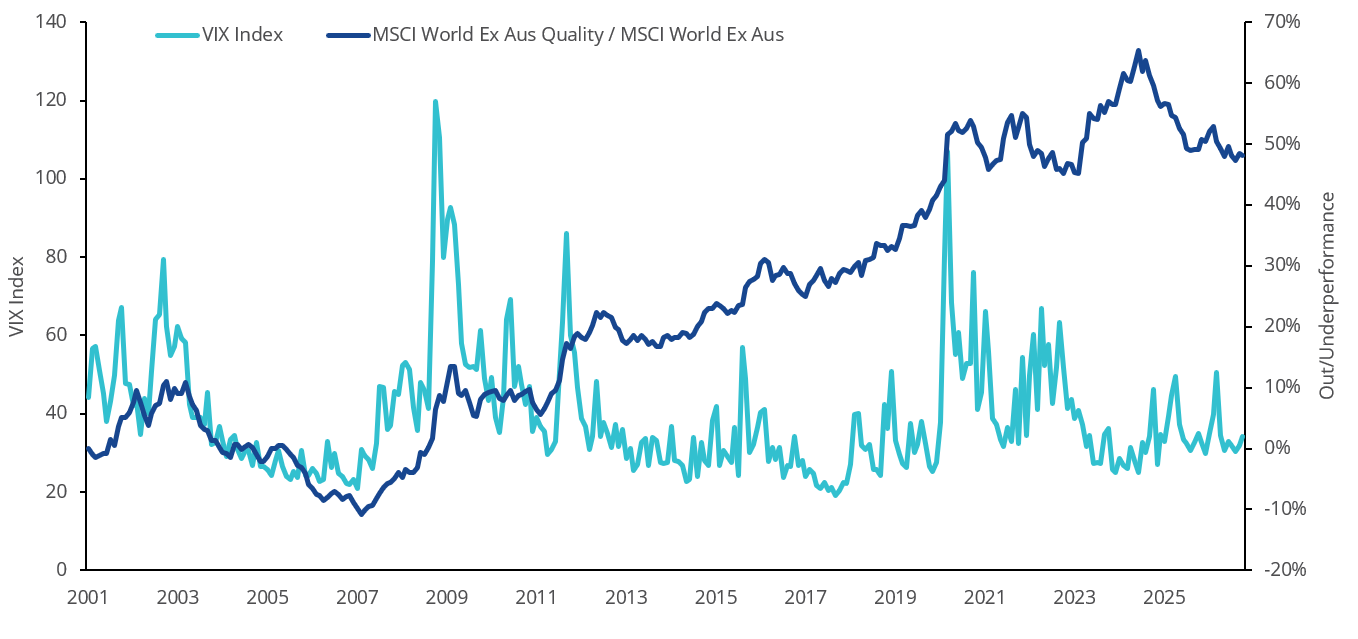
Source: MSCI Data/Calculations, Bloomberg, 29 January 1999 to 30 October 2026. Chart shows performance of MSCI World ex Australia Quality relative to MSCI World ex Australia compared to VIX Index. Results include the reinvestment of all dividends, but exclude fees and other costs associated with an investment in QUAL. You cannot invest in an index. Past performance is not indicative of future performance of the index or QUAL.
When the going gets tough, quality gets going
VanEck MSCI International Quality ETF (QUAL), which tracks the MSCI World ex Australia Quality Index, has outperformed the broader market over the past month and past three months as investors have become more wary about future spending and seek those companies exhibiting quality characteristics.
Over the long term, it has outperformed the broad global equity benchmark by 1.61% a year since its October 2014 inception, despite a global pandemic, near-zero interest rates and the inflation shock that has occurred in the wake of the heavy monetary stimulus era.
Table 3: QUAL’s performance vs the MSCI World ex Australia Index
|
1 month |
3 months |
1 year |
3 years (% p.a.) |
5 years (% p.a.) |
10 years (% p.a.) |
Since inception (% p.a.) |
|
|
QUAL |
-1.42 |
1.12 |
4.08 |
15.89 |
11.24 |
15.51 |
14.99 |
|
MSCI World Ex Australia |
-1.94 |
0.41 |
4.29 |
18.15 |
12.01 |
13.93 |
13.38 |
|
Difference |
+0.52 |
+0.71 |
-0.21 |
-2.26 |
-0.77 |
+1.58 |
+1.61 |
Source: Morningstar Direct, as at 31 October 2026. QUAL inception date is 29 October 2014. Results are calculated to the last business day of the month and assume immediate reinvestment of dividends. ETF results are net of management fees and costs, but before brokerage fees or bid/ask spreads incurred when investors buy/sell on the ASX. You cannot invest in an index. Past performance is not indicative of future performance.
The same trend can be seen in Australian quality stocks. A sluggish economy, a fifth calendar year interest rate hike from the Reserve Bank as well as a significant fall in both activity and confidence has weighed on the total return of the S&P/ASX 200.
However, the Australian market presents its own challenges. A smaller investment universe and heavy stock and sector concentration mean that selecting companies with strong financial characteristics may still leave investors exposed to substantial cyclical risks.
This is why we think quality should be mixed in with valuation discipline, low volatility and momentum to create a quality-like outcome for the Australian market. This is the model that backs the VanEck MSCI Australian Quality Plus ETF (AQTY).
An exceptional earnings announcement is in the headlines for a day but a consistent performer that delivers stable earnings, high return on equity and does it with little debt can shape its own destiny for years after the earnings release.
Quality investing asks investors to look beyond the hype and examine the business that remains. History, along with the lessons and teachings of Benjamin Graham and Warren Buffett, give investors good reasons to value those characteristics through both setbacks and recoveries.
The enemy of great may be good, but a great earnings announcement is only the beginning. Quality investors want a business that can keep delivering.
Key risks
An investment in the ETF carries risks associated with ASX trading time differences, financial markets generally, individual company management, industry sectors, foreign currency, country or sector concentration, political, regulatory and tax risks, fund operations, liquidity and tracking an index. See the PDS for details.
QUAL is likely to be appropriate for a consumer who is seeking capital growth, is intending to use the product as a major, core, minor or satellite allocation within a portfolio, has an investment timeframe of at least 5 years, and has a high risk/return profile.
AQTY is likely to be appropriate for a consumer who is seeking capital growth and a regular income distribution, is intending to use the product as a core, minor or satellite allocation within a portfolio, has an investment timeframe of at least 5 years, and has a high risk/return profile.


Published: 06 November 2026
Any views expressed are opinions of the author at the time of writing and is not a recommendation to act.
VanEck Investments Limited (ACN 146 596 116 AFSL 416755) (VanEck) is the issuer and responsible entity of all VanEck exchange traded funds (Funds) trading on the ASX. This information is general in nature and not personal advice, it does not take into account any person’s financial objectives, situation or needs. The product disclosure statement (PDS) and the target market determination (TMD) for all Funds are available at vaneck.com.au. You should consider whether or not an investment in any Fund is appropriate for you. Investments in a Fund involve risks associated with financial markets. These risks vary depending on a Fund’s investment objective. Refer to the applicable PDS and TMD for more details on risks. Investment returns and capital are not guaranteed.
Both the VanEck MSCI International Quality ETF (QUAL) and the VanEck MSCI Australian Quality Plus ETF (AQTY) are indexed to a MSCI index. Neither AQTY nor QUAL is sponsored, endorsed or promoted by MSCI, and MSCI bears no liability with respect to AQTY or QUAL or the MSCI Index. The PDS contains a more detailed description of the limited relationship MSCI has with VanEck and the Fund.