We are all a little bit biased
We’ve seen a lot of confirmation bias recently and it would be naïve to think that confirmation bias doesn’t exist in financial markets. It goes a long way to explain the failings of most portfolios.
Confirmation bias is a term used in psychology which is defined as “our all-too-natural ability to convince ourselves of whatever it is we want to believe. We attach undue emphasis to events that corroborate the outcomes we desire and downplay whatever contrary evidence arises.” (Michael Pompian, Behavioural Finance and Wealth Management, 2006). What is important to take out of the definition is that it is natural, that it is unintended. Philosophers have long noted that people have difficulty processing information in a rational, unbiased manner once they have developed an opinion about an issue.
There are many reasons why it is thought confirmation bias exists in humans. One is that it is an efficient way to process information, given we can’t possibly process everything, so we process it quickly as a mechanism to protect ourselves from harm.
Another cited reason is self-esteem. Discovering that something we believe is wrong makes us feel bad about ourselves. Therefore, we will seek information that supports our beliefs, rather than that which disproves it.
Tied to self-esteem is the need to avoid errors and wanting to be correct. Information that suggests we are wrong or that we have made a poor decision encourages us to disregard that information or to seek information from elsewhere.
There are different types of confirmation bias. It’s worth going through a couple below.
Confirmation bias example: Not seeking information to disprove (falsification)
This is demonstrated by the classic experiment known as the Wason Card Task. Participants are presented with four cards on a table and are told that each card has a letter on one side and a number on the other. Participants can see one vowel, one consonant, one odd number and one even number facing up (eg, A, B, 1, and 2). Participants are asked to test the hypothesis: “If a card has a vowel on one side, it has an even number on the other.” They are to turn over only two cards to determine whether the hypothesis is true. The correct way to prove the hypothesis is to turn over the vowel (which must reveal an even number, for the rule to be valid), and the odd number (which must NOT reveal a vowel, in order for the rule to be valid). Most people turn over the vowel but then turn over the even number even though both actions will prove the hypothesis, not disprove it. People only seek evidence to confirm the theory in question, at the expense of evidence that could prove it to be false.
Confirmation bias example: Tendency to favour positive outcomes (Pollyanna principle)
People prefer positive outcomes over negative conclusions. Therefore, we seek a higher level of evidence to discover an undesirable outcome than we need for an outcome we prefer1. In practice, if we have said something or believe something, the level of evidence required to change our minds, i.e. admit we were wrong, is higher than the evidence we need to support our belief.
Importantly, confirmation bias is not limited to any group. Research has shown that in professions such as medicine, doctors are just as likely to have confirmation biases as everyone else.
We think there is confirmation bias in financial services too.
Proponents of active managed funds will tell you that active management are best placed to limit losses in market falls, through stock selection, portfolio construction and the ability to increase cash allocation. However, according to S&P Dow Jones’s S&P Indices Versus Active (SPIVA), historical data argues otherwise.
Proponents of passive management point to SPIVA scorecards as the basis for their adherence to investing in a market capitalisation benchmark approach, despite the evidence of drawbacks of such an approach.
Often both sides have not sought out, or they downplay other information. One of these is smart beta.
Smart beta combines the best of active and passive investing: having the potential for better investment outcomes while being rules-based, transparent and cost-efficient. Smart beta is the term given to ETFs (Exchange Traded Funds) which track an index that differs from the traditional market capitalisation approach of selecting shares, bonds or other assets. That is, smart beta ETFs take a “smarter” and more considered approach to what goes into the fund other than just the size of the company.
So, what is the evidence that smart beta can help investor’s portfolios?
Overlooked information 1: Assessing active management performance versus passive overlooks new types of indices
First, let's look at the claim active managers do better in a downturn or slowdown because unlike passive managers they can avoid certain stocks and sectors. In the 12 years since SPIVA reports started they have made for poor reading for active managers, irrespective of the macroenvironment, or the volatility in markets. In 2019 when the S&P/ASX 200 returned 23.77%, only 38.48% of funds outperformed the index that year (it was less over the proceeding 3, 5, 10 and 15 years2. But a year before, in the 2018 calendar year when the S&P fell over 3%, only 13.31% of funds outperformed the benchmark3. More recently, when the market fell in 2022, only 52.44% of funds outperformed4. It seems most funds underperform, irrespective of market conditions.
Yet active funds retain a lion’s share of Australian equity fund flows.
While SPIVA furthered the passive versus active debate it has done little to shift an industry bedded to the ideology that markets are inefficient and therefore active managers should be able to add value above the benchmark index, even accounting for fees, over time.
In response, S&P Dow Jones Indices now release accompanying research, ‘Persistence of Australian Funds’, as part of its SPIVA program. What these reports show is that there is a cohort of funds in which active managers do justify their fees. It also shows however that, for investors, it is difficult to pick that active manager who will persistently outperform, because most do not.
While all this was happening, technological advances and the availability of big data combined with the general growth in the asset management markets, enabled better performance analysis. It was observed that an active manager’s returns could be attributed to the market (beta), skill and a range of what are known as smart beta factors. These factors are like the ‘styles’ active managers promote as a part of their skill set such as ‘quality’, ‘growth’ or ‘value’. Smart beta indices and ETFs made it possible for investors to invest in strategies that utilise these same factors, for a fraction of the cost that active managers have historically been charging.
The technological data has also made it possible to assess and seek information about an active manager’s skill and adherence to a style. Below we take you through the Fama French Five Factor Model and show its use assessing our smart beta VanEck MSCI International Quality ETF (QUAL) which as you would expect demonstrates the ‘quality factor.’ We are able to do this for other active managers to dissect and compare performance upon request.
Fama French Five Factor Model Formula
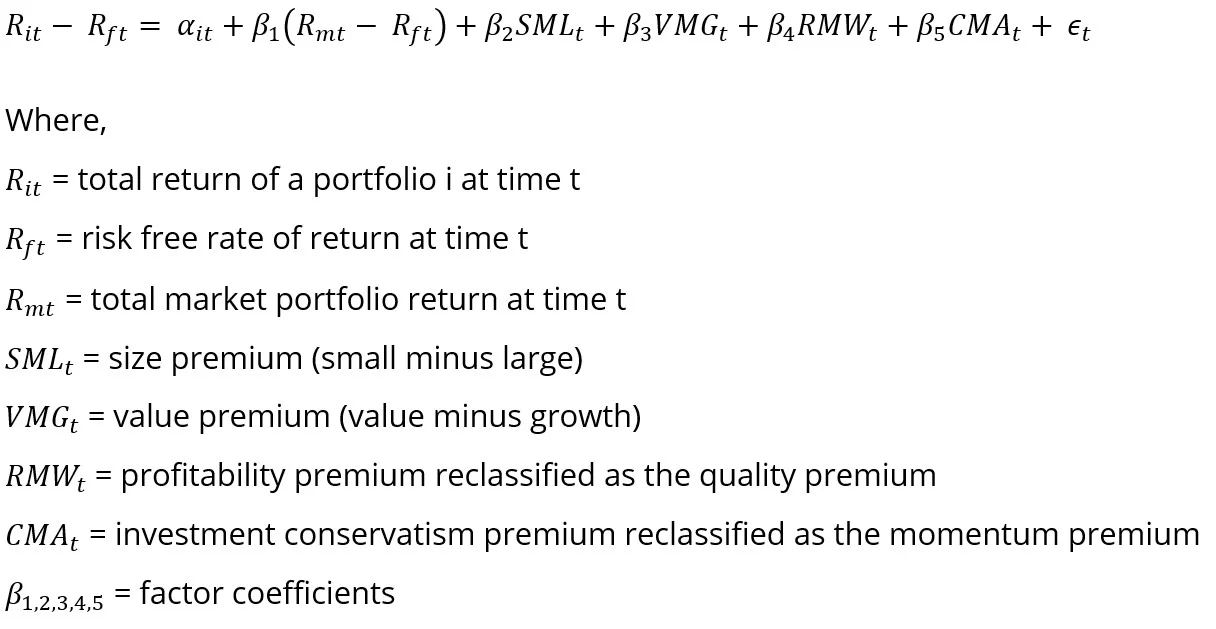 |
Don’t worry you don’t need to be a mathematician to understand the model. The model is visual. It breaks down returns over rolling 36 months. In the international equities examples in addition to the Fama French Five Factor Model we use the MSCI factor indices to explain the past returns.
Model Interpretation
The visual model is presented in five sections:
- R-squared - this is the percentage contribution to performance.
- Fund relative to benchmark return.
- Factor plus alpha.
- Factor plus alpha coefficient; and
- Factor coefficients.
Now let’s looks at QUAL and its five sections, in figure 1 below, followed by a summary of each analysis.
Figure 1: QUAL’s five-factor model
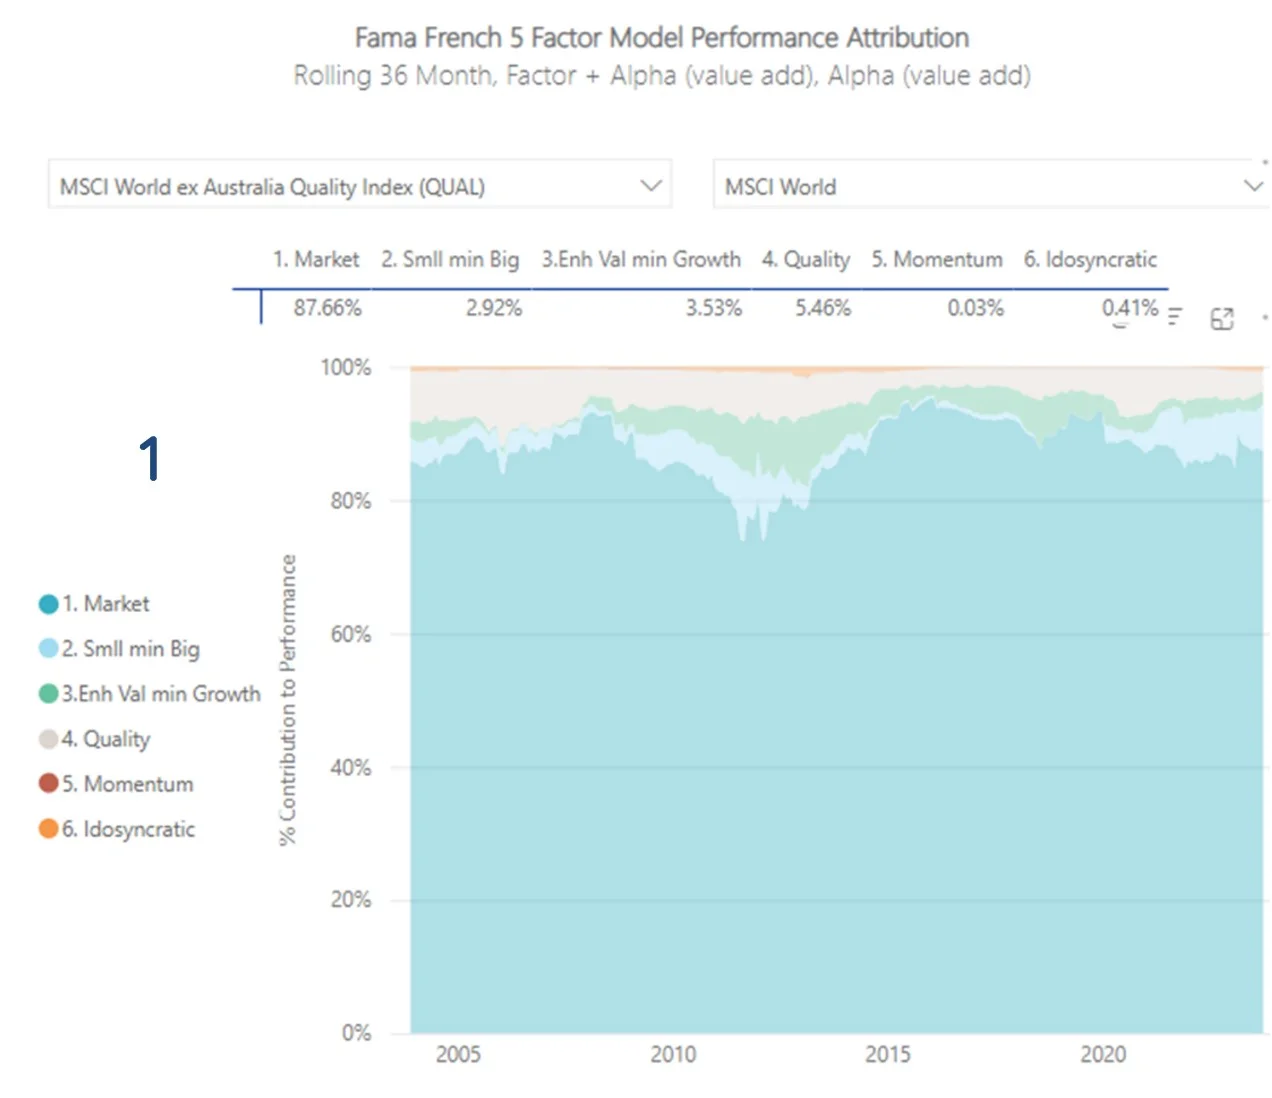
Source: VanEck, MSCI, Delta Advisory, 2000 to October 2023. Results are calculated to the last business day of the month and assume immediate reinvestment of all dividends. QUAL performance includes management fees and other costs incurred in the fund but excludes broker fees and buy/sell spreads associated with investing in QUAL. Past performance is not a reliable indicator of future performance of QUAL.
1 - R-squared – is a statistical measure that quantifies the percentage of managers’ performance attributed to the market and factor exposures. The best way to conceptualise this component is using the ‘onion layers’ analogy. Think about the above, as each factor is added. The r-squared value for that factor quantifies the additional contribution as opposed to the total percentage contribution.
Figure 2: The layers of the five-factor model:
Layer 1: The ‘market’ explains 87.7% of performance. When the market rises, so does QUAL.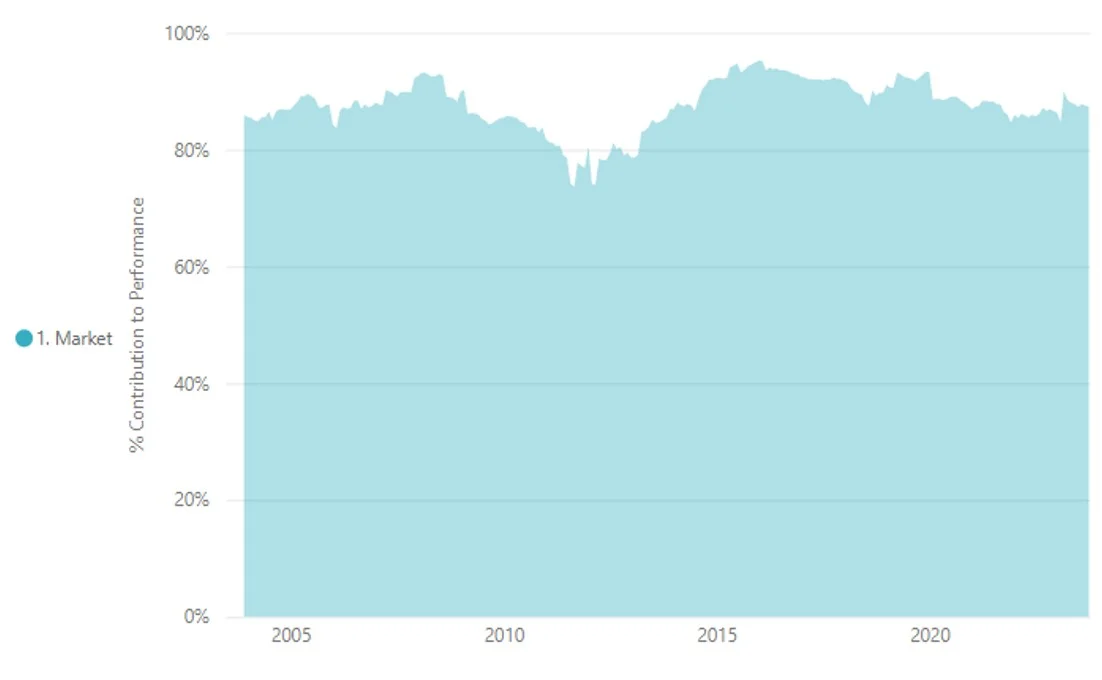
Layer 2: Size plus market beta explains 90.6% (87.7%+2.9%) of performance. QUAL does not have a significant bias to small companies.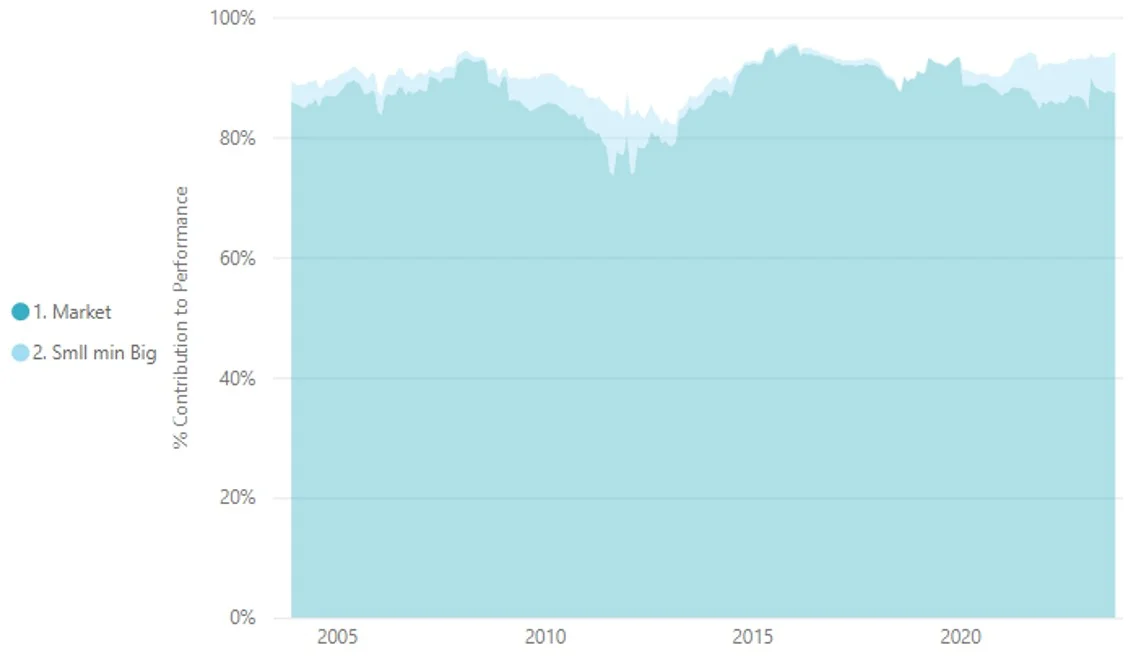
Layer 3: Value/growth plus size plus market beta explains 90.6% (87.7%+2.9%+3.5%) of performance. QUAL has greater exposure to growth over value.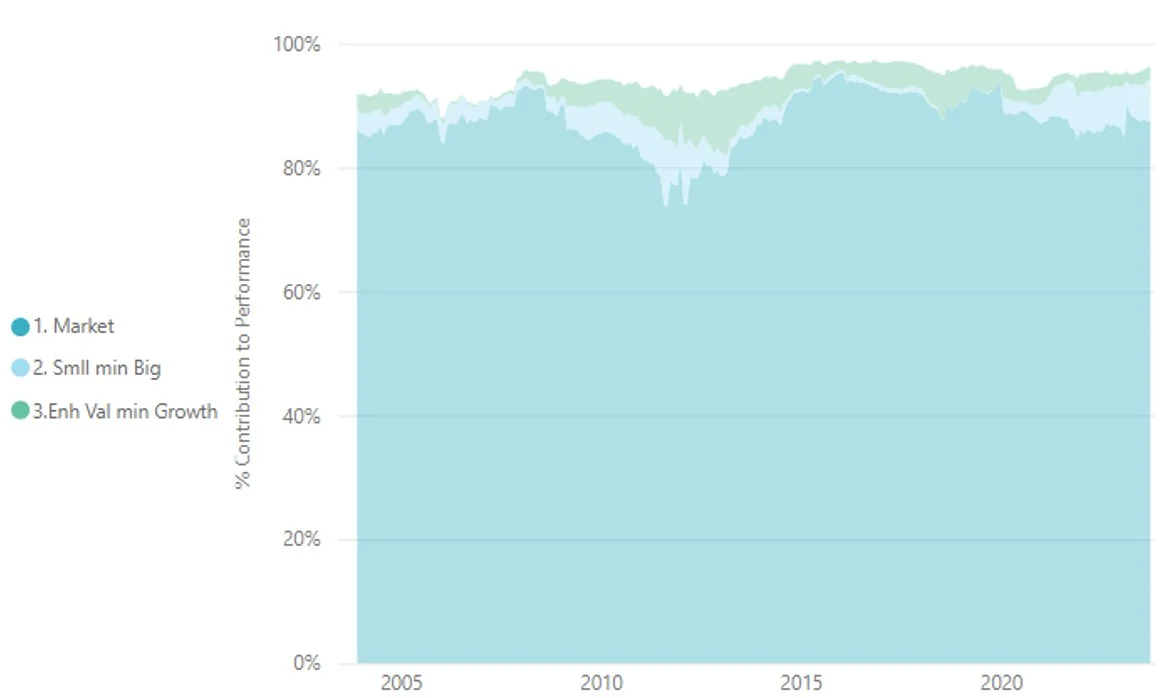
Layer 4: Quality plus value/growth plus size plus market beta explains 99.6% (87.7%+2.9%+3.5%+5.5%). Quality is by far the biggest ‘factor’ exposure.
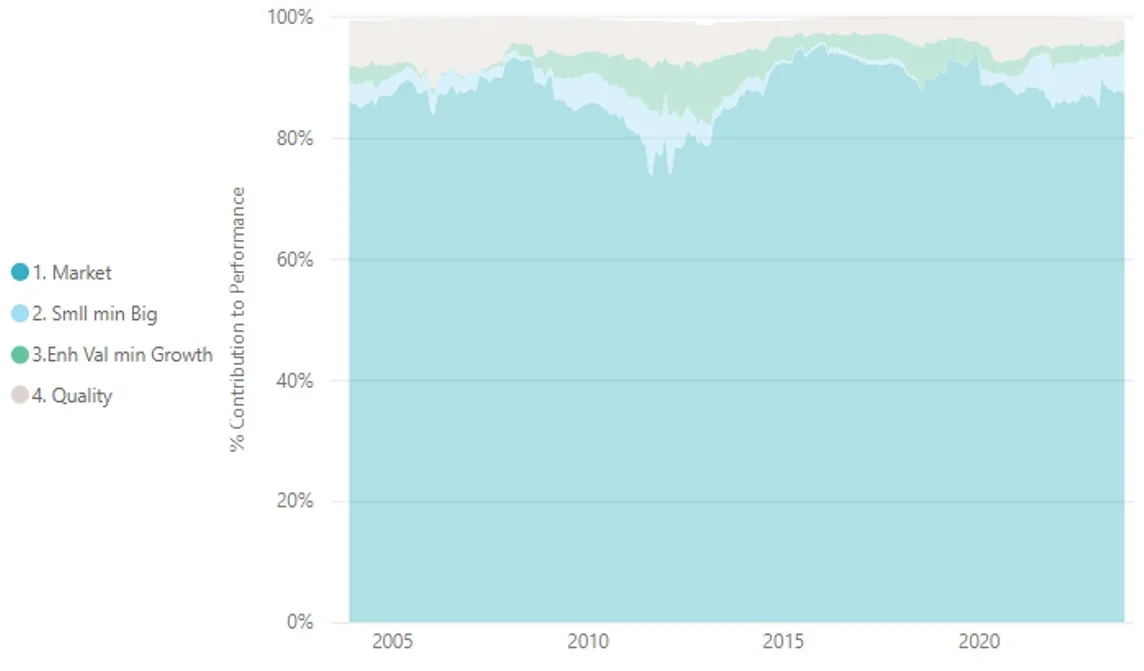
Source: VanEck, MSCI, Delta Advisory, 2000 to October 2023. Results are calculated to the last business day of the month and assume immediate reinvestment of all dividends. QUAL performance includes management fees and other costs incurred in the fund but excludes broker fees and buy/sell spreads associated with investing in QUAL. Past performance is not a reliable indicator of future performance of QUAL.
In summary, the model shows QUAL performs as you would expect it to. Quality is the dominant factor and this has been persistent through time.
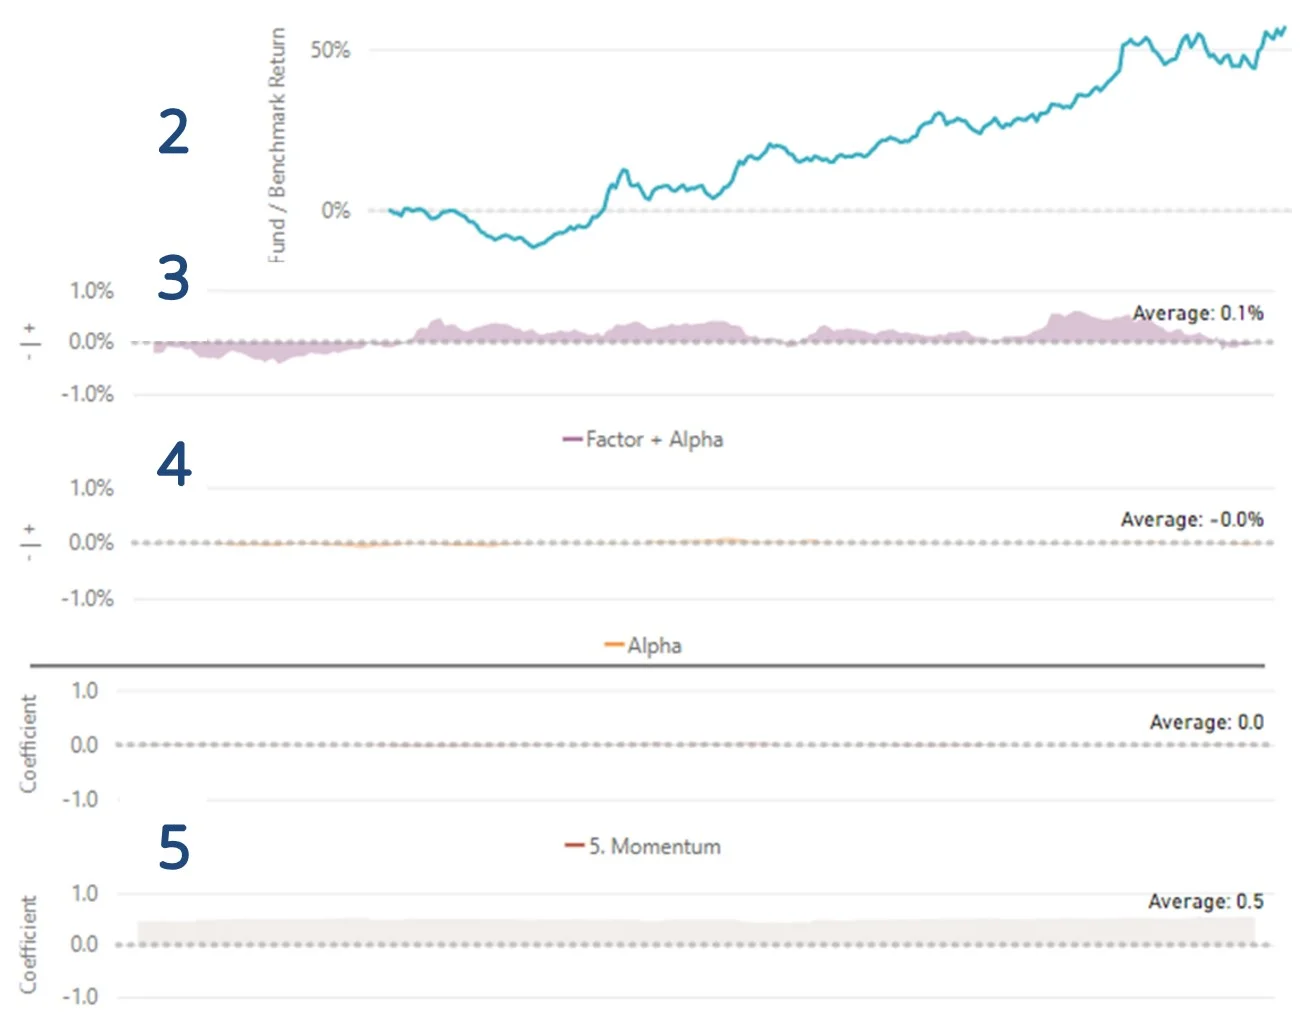
2 – Relative performance – In Figure 1. you can see that QUAL has consistently outperformed the benchmark. Toward the end of 2020 and again at the end of 2021, the line started to dip as value made a comeback, but QUAL has since turned back upwards.
3 – Factor + alpha – This purple chart shows whether the fund has out/underperformed the benchmark on a 36 month rolling basis. You can see QUAL is currently above 0%, so it is currently outperforming the market, as it has for much of the time over the analysis.
4 – Alpha – This is the pure alpha added, beyond factors and the market. As there is no active manager making decisions for QUAL so, as you would expect you can barely see an orange line
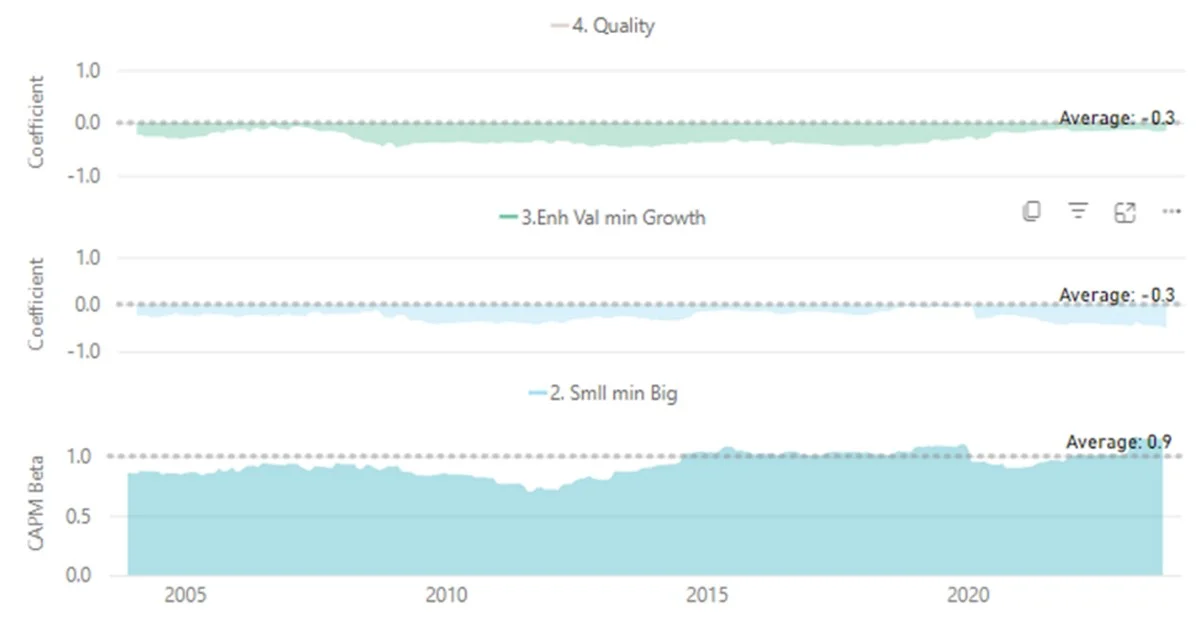
5 – Factor coefficients – The coefficients quantify whether the factor contribution is large/small, value/growth, quality and/or momentum. The coefficients show that QUAL has a quality, growth and large cap tilt as the coefficients are positive, negative and negative.
This leads to overcoming another confirmation bias #2: You may think it is impossible to outperform with passive management.
Overlooked information 2: When assessing active and passive, consider smart beta too
Smart beta ETFs are passive funds, they just track different indices from the market benchmark, and they make it possible to achieve active outcomes, including outperformance, for passive fees.
Many of VanEck’s smart beta ETFs have outperformed their market capitalisation equivalents. While we would always caution that past performance is not an indicator of future performance, you can see the performance of VanEck’s smart beta funds relative to the performance of the market capitalisations funds on each of the fund’s web pages:
|
ETF |
ASX code |
Smart beta approach |
Performance |
|
VanEck Australian Equal Weight ETF |
A core Australian equity portfolio that equally weights the largest and most liquid ASX-listed companies. |
||
|
VanEck Australian Property ETF |
Capped weight exposure to A-REITs with each holding capped at 10% to reduce concentration. |
||
|
VanEck MSCI International Quality ETF |
The 300 highest Quality companies based on MSCI’s Quality scores for high return on equity, stable annual earnings growth, and low financial leverage. |
||
|
VanEck MSCI International Quality (Hedged) ETF |
QUAL with returns hedged into AUD. |
||
|
VanEck MSCI International Value ETF |
250 international companies that are selected for their higher value score relative to sector peers as measured by MSCI. |
||
|
VanEck MSCI International Value (AUD Hedged) ETF |
VLUE with returns hedged into AUD. |
||
|
VanEck Morningstar Wide Moat ETF |
High conviction US wide moat equity strategy based on Morningstar’s Economic Moat rating. |
||
|
VanEck Morningstar Wide Moat (AUD Hedged) ETF |
MOAT with returns hedged into AUD. |
||
|
VanEck MSCI International Small Companies Quality ETF |
150 of the world’s highest quality small companies. |
||
|
VanEck MSCI International Small Companies Quality (AUD Hedged) ETF |
SML with returns hedged into AUD. |
||
|
VanEck MSCI Multifactor Emerging Markets ETF |
A diversified portfolio of emerging market equities included on the basis of Value, Low Size, Momentum and Quality. |
Overlooked information 3: Your ETF may have lots of companies, but is it truly diversified?
Another investment outcome is diversification. Sometimes investing in a passive fund that tracks a benchmark index may not be giving you the diversification you think.
According to Hammond (2014)5, “cap-weighted indexing has become the prevailing form of equity index investing due to the ease with which managers could implement investment strategies”. However, as Hammond noted “the construction methodology behind traditional cap-weighted indices creates implicit biases that could potentially increase certain risks and reduce returns.”
These risks are concentration risk and exposure to overvalued securities.
The S&P/ASX 200 is a good example of an index that is potentially exposed to the risks Hammond highlights6.
1. Concentration risk – The S&P/ASX 200 exposes investors to excessive concentration risk. The top 10 companies represent almost 50% of the index. Four of the top five companies are banks. Financials make up over 40% of the index. This is problematic if bubbles form. Sector and stock concentration make sense if an investor is ‘bullish’ or confident the sector or stock will outperform but investors buying a fund that ostensibly contains 200 stocks would likely assume such a broad-based fund to be better diversified.
2. Exposure to overvalued securities – Weighting a fund’s components according to market capitalisation can have a negative impact on performance. This is because when the market overvalues a stock its market capitalisation goes up. A fund tracking a traditional market capitalisation index buys more and more of the overpriced stock and loses money when the market corrects. Conversely, when the market undervalues a stock, the market cap-based fund sells more and more of the underpriced stock, missing out on profit when the market corrects.
This is why we like the equal weighting approach of MVW. Rather than weighting stocks by size, an equal weight index gives all its constituents the same weight regardless of market capitalisation. The result is a more diversified portfolio.
A way to measure the diversification of a portfolio is to calculate its Herfindahl Index. This index is a broadly used technique to quantify concentration. When used inversely, this index measures diversification. As at the last rebalance in June 2023, the Herfindahl Index for the S&P/ASX 200 was 304.5. The equivalent measure for the index MVW tracks was 125.0. The MVW Index is therefore nearly 2.5 times less concentrated than the S&P/ASX 200. In other words, the MVW Index is roughly two and a half times more diversified than the S&P/ASX 200.
Diversification is such a key component of share investing that the Cambridge Dictionary even refers to the stock market in its definition of ‘diversify’: People are advised to diversify their investments in the stock market to reduce risk. We agree.
Confirmation bias is hard to overcome, it’s important to be aware of it
Maybe we are biased of the evidence supporting well-thought-out smart beta approaches, though it may be through our own confirmation bias. Numbers don’t lie. We will let the outcomes speak for themselves.
Key risks:
An investment in any of our funds involves risks. These risks vary, are generally more pronounced in international funds compared to domestic funds and can be found in the respective product disclosure statement (PDS). We recommend that you speak with a financial adviser, read the PDS and target market determination (TMD) to determine if these funds are right for you.
Sources:
1Ditto, Peter H.; Lopez, David F. (1992), "Motivated skepticism: Use of differential decision criteria for preferred and nonpreferred conclusions", Journal of Personality and Social Psychology, 63 (4): 568–584,
2SPIVA® Australia Scorecard: Year-end 2019 S&P Dow Jones Indices research paper
3SPIVA® Australia Scorecard: Year-end 2018 S&P Dow Jones Indices research paper
4SPIVA® Australia Scorecard: Year-end 2022 S&P Dow Jones Indices research paper
5Hammond, Ogden, (2014), “Strategic beta: Marrying active management insights with discipline of rules-based investing” JP Morgan Investment Insights
6ibid


Published: 01 December 2023
Any views expressed are opinions of the author at the time of writing and is not a recommendation to act.
VanEck Investments Limited (ACN 146 596 116 AFSL 416755) (VanEck) is the issuer and responsible entity of all VanEck exchange traded funds (Funds) trading on the ASX. This is general advice only and does not take into account any person’s financial objectives, situation or needs. The product disclosure statement (PDS) and the target market determination (TMD) for all Funds are available at vaneck.com.au. You should consider whether or not an investment in any Fund is appropriate for you. Investments in a Fund involve risks associated with financial markets. These risks vary depending on a Fund’s investment objective. Refer to the applicable PDS and TMD for more details on risks. Investment returns and capital are not guaranteed.