Mid caps: Not too big, not too small, just right
The recent earnings season confirmed Australian mid cap companies are ‘the Goldilocks market segment.’ Mid caps have more room to grow than large cap companies and are more established than small cap companies. During the recent earnings season mid cap companies delivered the best earnings growth results. These results reinforce recent S&P research which highlight the better revenue and income growth of mid caps which has led to them outperforming “both large and small cap equities over the long term.” Investing in Australian mid caps is now easier than ever.
Last week S&P, one of the world’s largest index providers, released a research paper entitled Mid-cap Indexing in Australia which identified the reasons the mid cap segment outperforms all other size categories on both an absolute and risk-adjusted basis. Despite this “pure mid cap investing is not common and often mid and small companies are lumped together for investment purposes, diluting the unique characteristics of mid-sized companies.”
The paper concludes that exposure to mid caps can serve as an effective complement to conventional Australian equity portfolios. A copy of the paper can be found here.
Cutting through S&P’s analysis, its conclusion is supported by evidence that:
- The fundamentals of mid cap companies demonstrate they are typically achieving higher growth rates than large and small cap companies;
- Mid cap stocks have a better diversification and sector representation than large and small caps; and
- The S&P/ASX MidCap 50 Index has recorded higher risk adjusted returns over 1, 3, 5, and 15 year periods when compared to all other market segments.
Higher growth rates
The growth characteristics of the S&P/ASX MidCap 50 Index demonstrates higher growth rates than large cap companies and they have greater access to capital than small cap companies. The charts below demonstrate that companies within the S&P/ASX MidCap 50 Index have experienced meaningfully higher median revenue and normalised net income growth than large cap companies and they have also exhibited stronger growth than small cap companies over the past three years. Further, the charts below show revenue and earnings growth of the S&P/ASX MidCap 50 Index components have compared favourably to that of the broad-market S&P/ASX 200 and S&P/ASX 300 indices.
Higher Revenue Growth of Mid caps
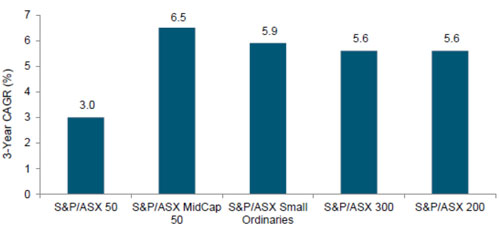
Median revenue growth of index constituents
Source: S&P Dow Jones Indices calculations using S&P Capital IQ and Compustat data as of 30 June, 2016. Past performance of the S&P/ASX MidCap50 Index is no guarantee of future results of that index or MVE. It is not possible to invest directly in an index.
Higher net income growth of Mid caps
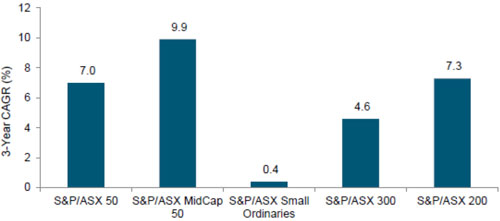
Median Growth of Index Constituent’s Net Income Before Extraordinary Items
Source: S&P Dow Jones Indices calculations using S&P Capital IQ and Compustat data as of 30 June 2016. Past performance of the S&P/ASX MidCap50 Index is no guarantee of future results of the index or MVE. It is not possible to invest directly in an index.
Better diversification:
In contrast to most Australian equity portfolios the S&P/ASX MidCap 50 Index is underweight financials and is overweight sectors underrepresented in the ASX large caps such as health care, utilities and consumer discretionary (which is not represented in the S&P/ASX 50).
Sector breakdown of ASX indices
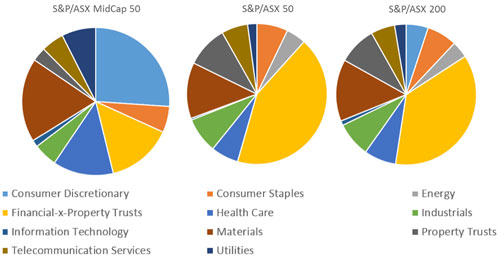
Source: VanEck, Factset, as at 31 July 2016
Long term outperformance
The following chart shows the outperformance of the S&P/ASX MidCap 50 Index relative to other Australian market segments.
Mid cap outperformance 1 August 2001 to 31 July 2016
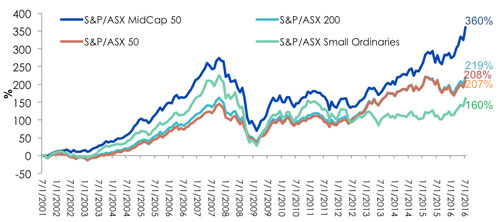
Source: VanEck, Morningstar, as at 31 July 2016. Results are calculated to the last business day of the month and assume immediate reinvestment of all dividends and exclude costs associated with investing in MVE. You cannot invest directly in an index. Past performance is not a reliable indicator of future performance.
Until recently, converting S&P’s research to an investment opportunity has been virtually impossible as pure mid cap opportunities have been difficult to find as active managers tend to include small and large cap stocks in their ‘mid cap biased’ portfolios. Australian investors can now action S&P’s findings through a first of its kind ETF trading on ASX.
The VanEck Vectors S&P/ASX MidCap ETF (ASX code: MVE) tracks the S&P/ASX MidCap 50 Index which means Australian investors can access those companies S&P identify as being in the ‘sweet spot’ of the Australian equity universe.
Click here for more information MVE or please speak to one of our ETF specialists on 02 8038 3300 or info@vaneck.com.au
This information is issued by VanEck Investments Limited ABN 22 146 596 116 AFSL 416755 (‘VanEck’) as responsible entity and issuer of the VanEck Vectors S&P/ASX MidCap ETF (‘Fund’). This is general information only and not financial advice. It does not take into account any person’s individual objectives, financial situation or needs. Before making an investment decision in relation to the Fund, you should read the PDS and with the assistance of a financial adviser consider if it is appropriate for your circumstances. The PDS is available at www.vaneck.com.au or by calling 1300 68 38 37. The Fund is subject to investment risk, including possible loss of capital invested. Past performance is not a reliable indicator of future performance. No member of the VanEck group of companies gives any guarantee or assurance as to the repayment of capital, the payment of income, the performance or any particular rate of return from the Fund.
The "S&P/ASX MidCap 50 Index" is a product of S&P Dow Jones Indices LLC or its affiliates (“SPDJI”) and ASX Limited (“ASX”) and licensed for use by VanEck. S&P® is a registered trademark of Standard & Poor’s Financial Services LLC (“S&P”); Dow Jones® is a registered trademark of Dow Jones Trademark Holdings LLC (“Dow Jones”); and these trademarks have been licensed for use by SPDJI and sublicensed by VanEck. The Fund is not sponsored, endorsed, sold or promoted by SPDJI, Dow Jones, S&P, their respective affiliates, or ASX and none of them makes any representation regarding the advisability of investing in the Fund. Such parties do not accept liability for any errors, omissions or interruptions of the S&P/ASX MidCap 50 Index and do not give any assurance that the Fund will accurately track the performance of the index or provide positive investment returns. Inclusion of a security within the index or Fund is not a recommendation by any party to buy, sell or hold such security.


Published: 09 August 2018