Expert Analysis: Australian Equities
Now that BHP has consolidated, the Australian benchmark index is now more concentrated than a majority of other global benchmark indices. Therefore investing in funds that track the Australian benchmarks, S&P/ASX 200 or S&P/ASX 300 for diversification, may not be achieving their objective. When allocating to a portfolio of 200 or 300 companies an investor would naturally expect more diversification than having 50% of their investment to go to just two sectors, or have 45% invested in just 10 companies. However, that is the reality of what you’re getting when you invest in a fund that tracks Australia’s benchmark indices. Diversification is an important risk management tool. That is why it is prudent to take the right approach when investing in Australian equities. Here we provide some insightful analysis for our popular Equal Weight ETF (MVW) versus the S&P/ASX 200.
Many market indices are an accident of history. They were not initially designed for investment purposes, rather they were created to provide an update, or a health check of the market. As investing evolved, so too have indices and while some are useful tools for investors, others may expose investors to risk. The S&P/ASX 200 is one such index. To understand these risks it is worth understanding how these indices came about.
When Charles Dow first published the Dow Jones Industrial Average (The Dow Jones) in 1896, he allocated weightings to the top 12 stocks of the day based on their prices.
The Dow Jones is still widely quoted today. Let’s take a look at how it is constructed. It is a price-weighted index, which means that the stocks with the highest price have the largest weighting. Currently, UnitedHealth Group, which has a price of $467 per share, has the highest weighting in the portfolio. Let’s contrast that with Apple. Apple is a company that is five times larger than UnitedHealth, yet it only makes up 3.2% of the Dow Jones compared to the 9.2% of UnitedHealth.
The Dow Jones provides a general barometer of US equity performance, but does not make any sense from an investment perspective because a share price could be a function of having less (or more) shares on issue.
As a result, the next index innovation was ‘market capitalisation’, which was pioneered by Henry Varnum Poor and the Standard Statistics Co. The result was the 1926 predecessor of the United States’ S&P 500. A market capitalisation index uses the size of a company for inclusion. Therefore, in a market capitalisation index, the larger companies have bigger weights. In the S&P 500, Apple makes up around 7%, UnitedHealth around 1%. Market capitalisation indices were considered better barometers of the market. Again though, the intention of the index is to be a market barometer, not a tool for investment.
Market capitalisation indices have become the source of market performance reported in the media all over the world. In Australia, the S&P/ASX 200 contains the 200 largest companies in Australia by market capitalisation.
Many funds follow market capitalisation indices. Therefore, funds that track market capitalisation indices allocate more to bigger companies than smaller companies. So when the market overvalues a stock, a fund tracking that index buys too much of the overpriced stock. Conversely when the market undervalues a stock, the fund sells too much of the under-priced stock.
Another limitation of a market capitalisation index is potential concentration, and the Australian benchmark is an example of this.
BHP recently consolidated its Australian and UK listings into a single entity on ASX. BHP now makes up over 11% of the S&P/ASX 200 increasing from just under 7% at the start of January. The top 10 stocks in the ASX 200 now makes up 47% of the index.
When you consider the sector composition of the S&P/ASX’s top 10, five companies are banks and two are materials. Investors buying a diversified Australian equity strategy would think it is unlikely one stock would be 10% of the portfolio, nor would they think two sectors represent over 50% of the portfolio, but that is what you will be getting from a portfolio linked to Australia’s largest 200 companies.
Concentration makes sense if you have high conviction in these stocks and sectors. Investors seeking diversification however may be disappointed by the concentration they get if they are in a fund tracking the S&P/ASX 200.
Index innovation beyond market capitalisation has resulted in alternative index construction methodologies. One such methodology is equal weighting. As the name suggests this means each company, irrespective of size, represents the same proportion of the index, all holdings are equally weighted. In a concentrated market like Australia, diversification benefits can be achieved by applying an equal weight methodology. Equal weighting reduces the concentration risk of the large companies, such as the big banks and big miners that dominate the S&P/ASX 200 and delivers increased exposure to companies outside the top 10 where there is generally greater opportunity for growth.
The VanEck Australian Equal Weight ETF (MVW) tracks the MVIS Australia Equal Weight Index (MVW Index) and includes only the largest and most liquid companies on ASX, currently 94 stocks, and equally weights them once a quarter at each rebalance.
Taking an equally weighted approach has been proven to produce outperformance over the long-term compared to a benchmark market capitalisation approach as well as providing diversification benefits.
So let’s walk through the difference between MVW and the S&P/ASX 200.
Table 1: Statistics and fundamentals
|
|
MVW |
S&P/ASX 200 |
|
Index strategy |
|
|
|
Number of sectors |
|
|
|
Number of holdings |
|
|
|
12mth trailing |
|
|
|
Dividend frequency |
|
- |
|
|
|
|
|
|
|
|
|
|
|
|
|
|
|
|
|
|
|
|
|
|
|
|
MVW has lower price to book, price to sales and price to cash flow. It also has a higher sales growth.
MVW vs S&P/ASX 200 - Performance
Equal weight investing has served Australian investors. At the time of writing, since its inception on ASX in 2014, MVW has outperformed the S&P/ASX 200 by 1.66% p.a.
Chart 1: Cumulative performance since MVW inception date to 23 February 2022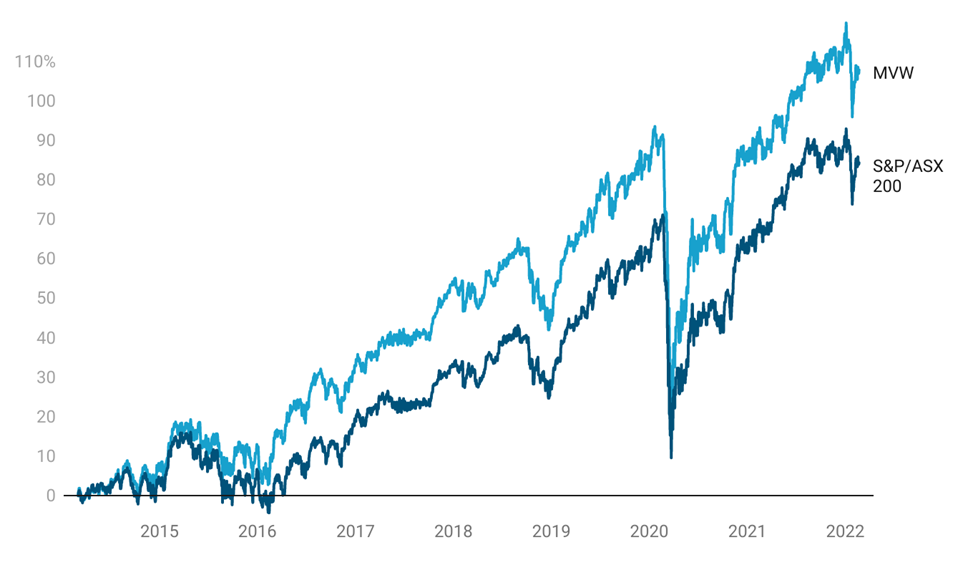
|
1 Month (%) |
3 Months (%) |
6 Months (%) |
1 yr (%) |
2 yrs (% p.a.) |
3 yrs (% p.a.) |
5 yrs (% p.a.) |
7 yrs (% p.a.) |
Since Inception* (% p.a.) |
|
|
MVW
|
0.22 |
-2.77 |
-0.32 |
9.17 |
4.44 |
8.61 |
8.80 |
8.50 |
9.59 |
|
S&P/ ASX 200 |
0.73 |
-2.32 |
-1.96 |
9.28 |
3.81 |
9.08 |
8.55 |
7.12 |
7.93 |
|
Difference |
-0.51 |
-0.45 |
+1.64 |
-0.11 |
+0.63 |
-0.47 |
+0.25 |
+1.38 |
+1.66 |
Chart 1 and Table 2 source: Morningstar Direct, VanEck as at 23 February 2022. The chart and table above show past performance of MVW and of the S&P/ASX 200. You cannot invest directly in an index. Results are calculated to the last business day of the month and assume immediate reinvestment of distributions. MVW results are net of management fees and other costs incurred in the fund, but before brokerage fees and bid/ask spreads incurred when investors buy/sell on the ASX. Returns for periods longer than one year are annualised. Past performance is not a reliable indicator of future performance. The S&P/ASX 200 Index is shown for comparison purposes as it is the widely recognised benchmark used to measure the performance of the broad Australian equities market. It includes the 200 largest ASX-listed companies, weighted by market capitalisation. MVW’s index measures the performance of the largest and most liquid ASX-listed companies, weighted equally at rebalance. MVW’s index has fewer companies and different industry allocations than the S&P/ASX 200. Click here for more details.
MVW vs S&P/ASX 200 Index - Top 10 holdings
Below you can see the top 10 companies. The differences are stark – to see all the holdings in MVW and their weightings click here.
Table 3: Top 10 holdings MVW Table 4: Top 10 S&P/ASX 200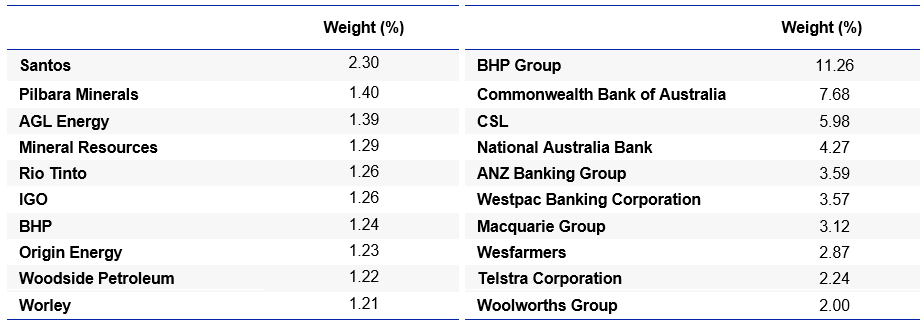
Source: Factset, VanEck, MVIS, as at 31 January 2022
The reason MVW’s holdings are not equal above is that it only rebalances back to equal weight each quarter. Noticeably Santos is now 2.30% of MVW. At rebalance, it was 1.04%, like every other holding, but due to its merger with Oil Search in January, it makes up a bigger part of MVW now. At the next quarterly rebalance it will be pared and the portfolio holding will be equal.
MVW vs S&P/ASX 200 Index - Sectors
MVW is currently underweight the financials’ sector by 9.97% compared to the S&P/ASX 200. Conversely it is overweight industrials by 6.62% and consumer discretionary by 3.56%.
Chart 2: S&P/ASX 200 and MVW Index company weightings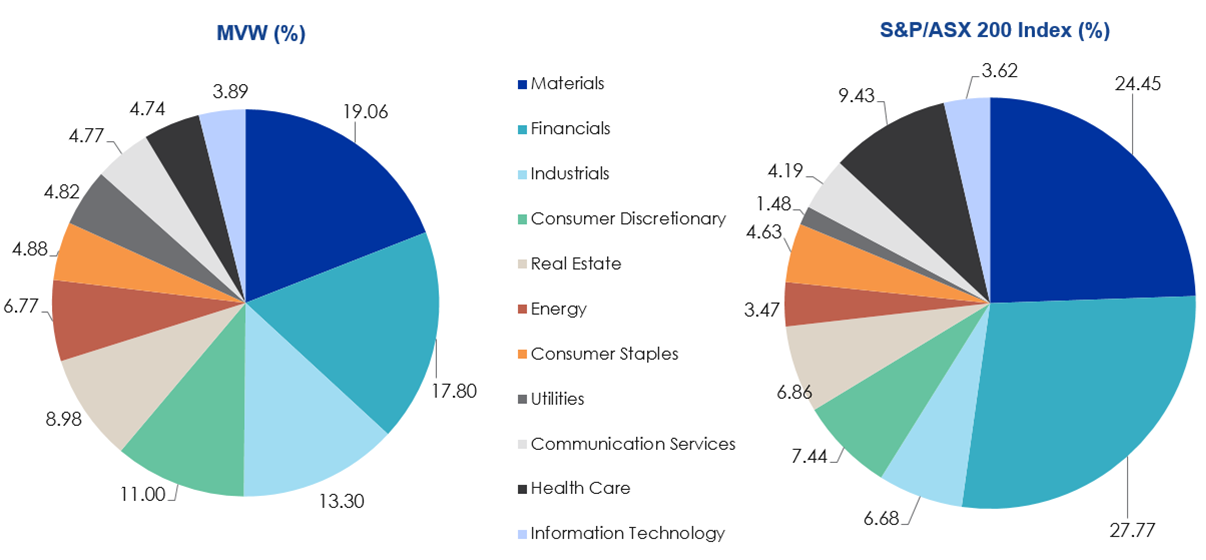
Source: Factset, 31 January 2022
What this means is that if there is another systematic banking issue, or commodities fall the impact on the S&P/ASX 200 is greater than in the MVW Index.
MVW vs S&P/ASX 200 Index - Style
When looking at portfolios it is important to determine what style e.g. value or growth and what size bias a portfolio holds e.g. giant, large, mid or small. Below we can see MVW’s. Importantly MVW holds large companies with a similar value-core orientation relative to the S&P/ASX 200, which skews larger (giant) and more toward growth.
Chart 3: MVW holdings based style map Chart 4: S&P/ASX 200 holdings based style map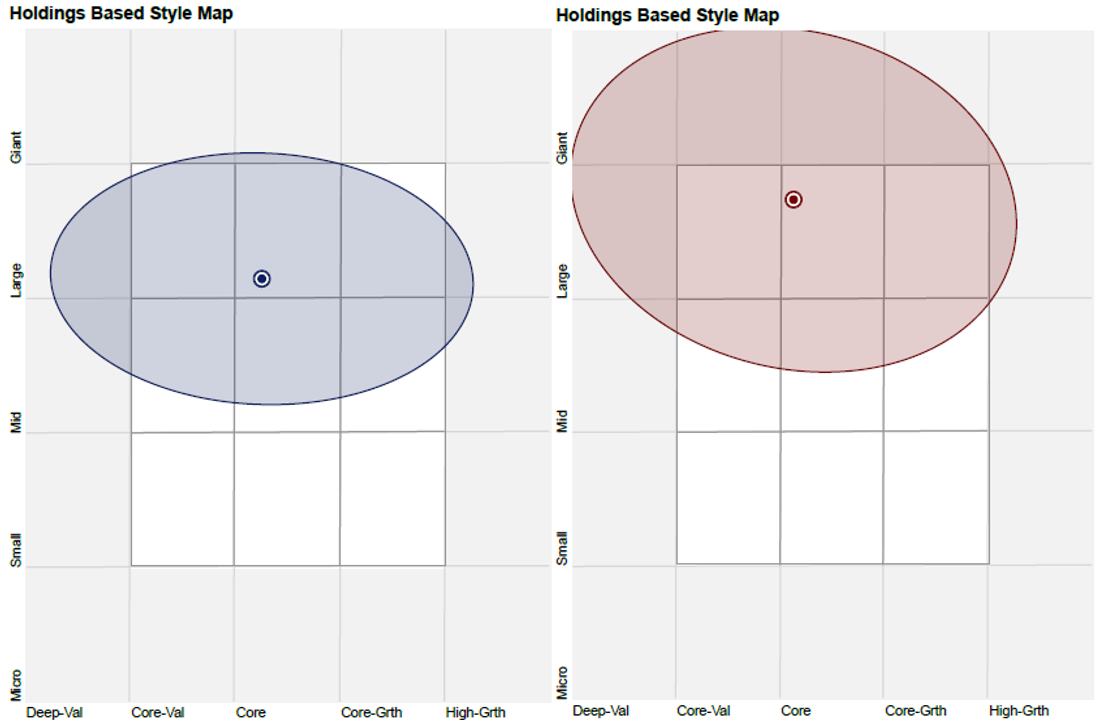
Source: Morningstar Direct, as at 31 January 2022
While each Australian equity ETF has its merit for portfolio inclusion, you should assess all the risks and consider your investment objectives.
Past performance is no guarantee of future performance. The above is not a recommendation. Please speak to your financial adviser or stock broker.
For further information you can email us or call on us on +61 2 8038 3300.
Key risks
An investment MVW carries risks associated with: ASX trading time differences, financial markets generally, individual company management, industry sectors, country or sector concentration, political, regulatory and tax risks, fund operations and tracking an index. See the PDS for details.


Published: 25 February 2022