Bonds: The cool kids again
A year ago, investors were questioning the prudence of the 60-40 blend and no one was predicting that, entering the 2022/23 financial year, they would be increasing their allocation to bonds, but here we are. Bonds are cool again. Prices have plunged, credit spreads have widened and yields have increased, creating potential opportunities for investors looking to increase their allocation to bonds, especially in corporate bonds.
Entering the 2022/23 financial year, increasing allocation to bonds was not on the cards for investors, but here we are. Bonds are cool again.
A year ago, investors were questioning the prudence of the 60-40 blend and no one was predicting that, entering the 2022/23 financial year, they would be increasing their allocation to bonds, but here we are. Bonds are cool again. Rates, driven by high inflation, have risen. The long end of the curve, 10-year bonds’ yield is in excess of 4%, up from 2.6% this time last year.
Bond prices have plunged, Australia’s Bond Index, the Bloomberg AusBond Composite Bond Index 0+ years (AusBond Composite) has suffered a maximum drawdown of 12.70%, its biggest ever fall, well beyond the falls of the 1994 bond crash. In addition to falling bond prices, credit spreads have widened and they are now beyond their March 2020 levels. Bonds are starting to look attractive again. Yields have increased and there are potential opportunities for investors looking to increase their allocation to bonds, especially in corporate bonds.
The market is pricing rate rises into the end of the year
Looking at interest rate futures, the implied Australian cash rate after the RBA’s December meeting sits beyond 3.50%. This requires aggressive interest rate moves over the next six months.
Figure 1: Interest rate probabilities
|
2022 RBA Meeting |
Current cash rate |
5 July 2022 |
2 August 2022 |
6 September 2022 |
4 October 2022 |
1 November 2022 |
6 December 2022 |
|
Implied rate |
0.85 |
1.37 |
1.94 |
2.42 |
2.89 |
3.36 |
3.79 |
Australian 10-year yields have gone even further
The graph below shows the yield of Australian Government 10-year bonds have moved beyond 4%.
Figure 2: Australian Government Bond 10-year yield
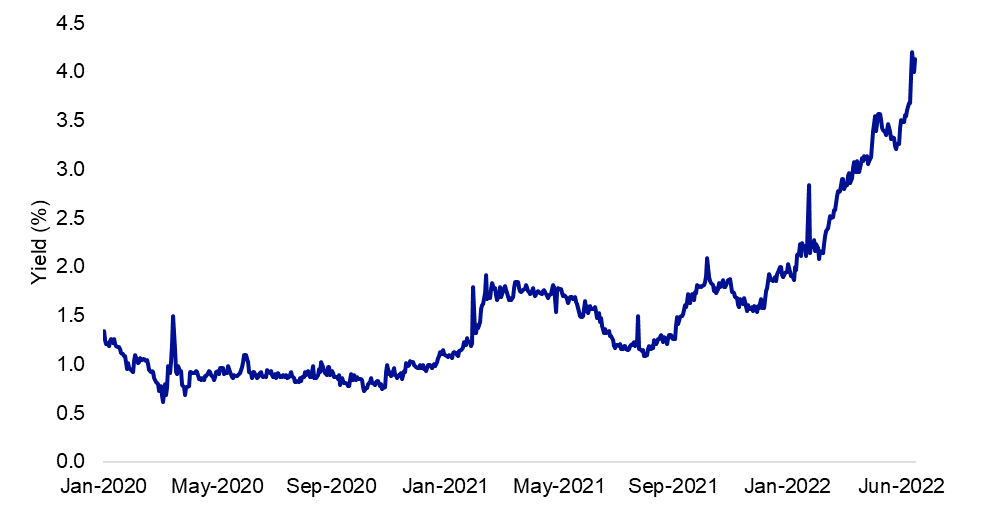
Source: Bloomberg, 20 June 2022
The market may have oversold longer dated bonds. If they have, it may be time for investors to consider bonds.
As yields have been increasing, bond prices have fallen. At the same time, credit spreads have widened, this has put further pressure on corporate bonds. The spreads on corporate bonds are now as wide as they were in March 2020, at the peak of the COVID-19 crisis.
Accessing the yield while limiting duration (interest rate) risk
With bonds having fallen 12% since the end of 2020, there may be pockets of ‘value’ for investors seeking income with attempting to preserve capital. One way it may be prudent for investors to consider bonds is to shorten the duration of their fixed-term bond investments to mitigate the impact of rising interest rates and target higher rated bonds to mitigate credit risks.
The bonds with the greatest duration risk are long-end fixed term bonds. Duration risk measures the sensitivity of a bond to changes in interest rate movements. For example, if the duration of a bond is 4, it means that with a 1% rate rise, the value of the bond would fall 4%. A bond with a duration of 2 would only fall 2% on a 1% rate rise.
Short dated over long dated securities
The VanEck Australian Corporate Bond Plus ETF (PLUS) provides a diversified, investment-grade credit exposure but features a shorter duration than the AusBond Composite. PLUS had an average modified duration of 4.59 as at 21 June compared to 5.17 years for the for the AusBond Composite.
Not only that, it’s yield, or income return, is higher with an average yield to maturity of 5.87% as at 21 June 2022, compared to 4.00% for the benchmark. Currently, PLUS holds only investment grade bonds and has an average credit rating of A-.
|
As At 21 Jun 2022 |
VanEck Australian Corporate Bond Plus ETF |
Bloomberg AusBond Composite 0+ Yr Index |
|
No constituents |
127 |
724 |
|
No issuers |
83 |
187 |
|
Ave Modified Duration (yrs) |
4.59 |
5.17 |
|
Ave Yield to Maturity |
5.87% |
4.00% |
|
Ave Running Yield |
3.64% |
3.02% |
|
Weight of top 10 issuers |
29.97% |
84.44% |
|
Rating Profile |
A- |
AA+ |
|
Average time to Maturity (yrs) |
5.40 |
5.99 |
|
Top Holding Weight |
2.48% |
2.93% |
Key risks
An investment in the ETF carries risks associated with: bond markets generally, interest rate movements, issuer default, credit ratings, fund operations, liquidity and tracking an index. See the PDS for details.

Published: 28 June 2022
Any views expressed are opinions of the author at the time of writing and is not a recommendation to act.
VanEck Investments Limited (ACN 146 596 116 AFSL 416755) (VanEck) is the issuer and responsible entity of all VanEck exchange trades funds (Funds) listed on the ASX. This is general advice only and does not take into account any person’s financial objectives, situation or needs. The product disclosure statement (PDS) and the target market determination (TMD) for all Funds are available at vaneck.com.au. You should consider whether or not an investment in any Fund is appropriate for you. Investments in a Fund involve risks associated with financial markets. These risks vary depending on a Fund’s investment objective. Refer to the applicable PDS and TMD for more details on risks. Investment returns and capital are not guaranteed.
The Bloomberg AusBond Composite 0+ Yr Index (“BACI”) is shown for comparison purposes as it is the widely recognised benchmark used to measure the performance of the broad Australian bond market, weighted by market value. PLUS’s index measures the performance of the higher-yielding AUD denominated corporate bond market with credit ratings from AAA to BB-. The index PLUS tracks has fewer bonds, fewer issuers, a different rating profile, different industry allocations, different sensitivity to interest rates and a different maturity profile than BACI. ‘Click here for more details’