Targeting the quality factor in the global small-cap universe
In the face of rising rates, the share price rises of the tech mega-caps have been well documented, but there has been another group of international companies that have done relatively well.
The tech mega-cap stocks do not have a monopoly on stable earnings, low leverage and high return on equity. The rise of global small companies, in particular, ‘quality’ global small companies has been overlooked by many investors.
The rise of the ‘quality’ resistance
The unpredictable rises of Meta, Apple, Alphabet, Microsoft and NVIDIA over the past twelve months, despite rising rates and expectations that this would adversely impact technology companies, have inflated the quoted returns of equity markets indices globally. It has been well documented that the rise of these companies accounts for a large percentage of rises of the broader share market indices.
While factors like the rise of so-called artificial intelligence (AI) applications had helped, ultimately the companies noted above all have been able to achieve relatively stable earnings and high return on equity (ROE) while having strong balance sheets, with a couple of them having lots of cash and short-term assets.
Those are characteristics of ‘quality’.
And it is not just the quality mega-cap companies that have done well. Over 12 months to the end of June 2023, global small companies, as measured by the MSCI World ex Australia Small Cap Index, rose 16.83%, over the same period the VanEck MSCI International Small Companies Quality ETF (QSML), which only includes 150 ‘quality’ global small companies has risen 28.38%. Though we would always note that past performance cannot be relied upon for future performance.
Table 1: Trailing returns as at 30 June 2023: QSML vs MSCI World ex Australia Small Cap Index
|
1 month |
3 months |
6 months |
1 Year |
Since QSML Inception |
|
|
QSML |
6.93 |
8.49 |
17.91 |
28.38 |
8.53 |
|
MSCI World ex Australia Small Cap Index |
3.44 |
3.83 |
9.89 |
16.83 |
3.66 |
|
Difference |
+3.49 |
+4.66 |
+8.02 |
+11.55 |
+4.87 |
Source: VanEck, Morningstar, Bloomberg as at 30 June 2023. Past performance is not a reliable indicator of future performance.
QSML inception date is 8 March 2021 and a copy of the factsheet is here.
The MSCI World ex Australia Small Cap Index (Parent Index) is shown for comparison purposes as it is the widely recognised benchmark used to measure the performance of developed market small companies, weighted by market cap. The Index that QSML tracks measures the performance of 150 companies selected from the Parent Index based on MSCI quality scores. Consequently, the QSML Index has fewer companies and different country and industry allocations than the Parent Index. ‘Click here for more details’.
Baby QUAL
The Quality Factor, inspired by investment pioneers such as Benjamin Graham and Warren Buffett, has demonstrated its prowess through the cycle with the VanEck MSCI International Quality ETF (QUAL) offering superior risk-adjusted performance and an enviable track record relative to active managers, all for a fraction of the cost and with full transparency. It includes companies on the basis of:
- High ROE;
- Stable year-on-year earnings growth; and
- Low financial leverage.
Manoeuvring portfolios to meet the challenges and idiosyncrasies of today’s capital markets is no easy feat. The consensus is that we are entering a period of economic weakness, which will be followed by a period of recovery and in the past, in this type of cycle, small caps have offered more upside than large caps.
To position portfolios during a slowdown into recovery and extend on the Quality Factor, the VanEck MSCI International Small Companies Quality ETF (QSML) is the only smart beta international small cap ETF in Australia. Over the last 20 years and in cyclical recoveries, international small cap quality as represented by the index QSML tracks, the MSCI World ex Australia Small Cap Quality 150 Index (QSML Index), has outperformed the large-cap MSCI World ex Australia Index. This is much like QSML’s larger cap parent – hence the name it’s affectionately known by, “Baby QUAL”.
Chart 1: Calendar year and YTD performance: MSCI World ex Australia Small Cap Quality 150 Index and MSCI World ex Australia Index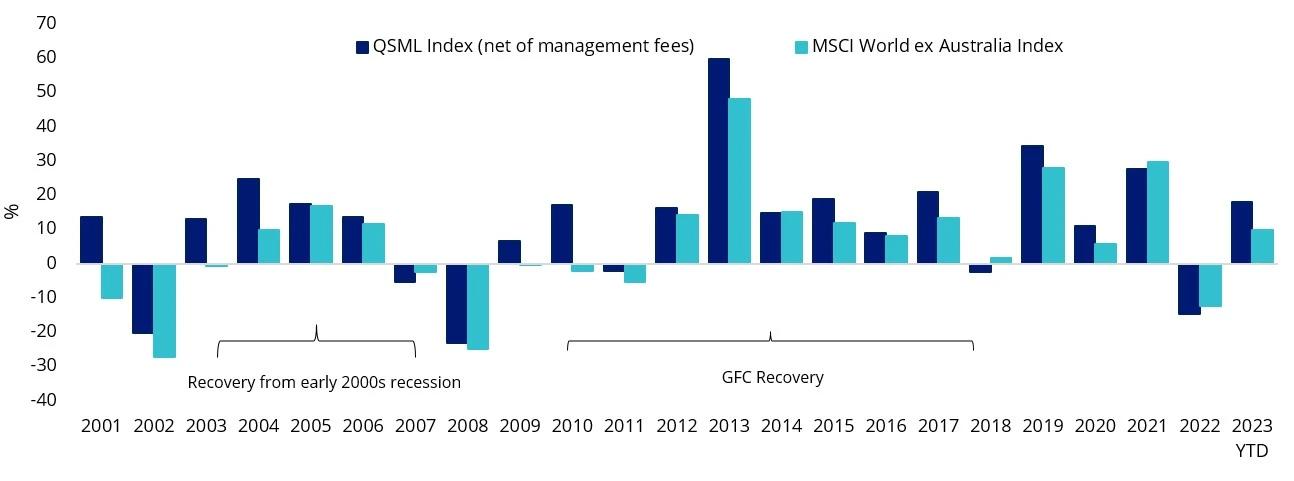
Source: VanEck, Morningstar Direct, to 30 June 2023. You cannot invest directly in an index. Past performance of the index is not a reliable indicator of the future performance of QSML. The MSCI World ex Australia Index is shown for comparison purposes as it is the widely recognised international equity benchmark used to measure the performance of developed market large- and mid-cap companies, weighted by market cap. It is used here to represent larger companies. QSML Index measures the performance of 150 companies selected from the MSCI World ex Australia Small Cap Index based on MSCI quality scores. Consequently, the QSML Index includes smaller-sized companies, has fewer companies and has different country and industry allocations than the MSCI World ex Australia. ‘Click here for more details’.
You’ll note Baby QUAL’s strongest periods of outperformance coincides with periods following a US recession (2001 & 2007 to 2009). And there is a fear that the US is headed for a recession again. Noting that this is not a reliable indicator of future performance.
QSML harvests the Quality Factor but in the international small cap universe and as you would expect drawdowns have historically been better than the global small-cap benchmark, the MSCI World ex Australia Small Companies index.
Chart 2: Drawdown: MSCI World ex Australia Small Cap Quality 150 Index and MSCI World ex Australia Small Companies Index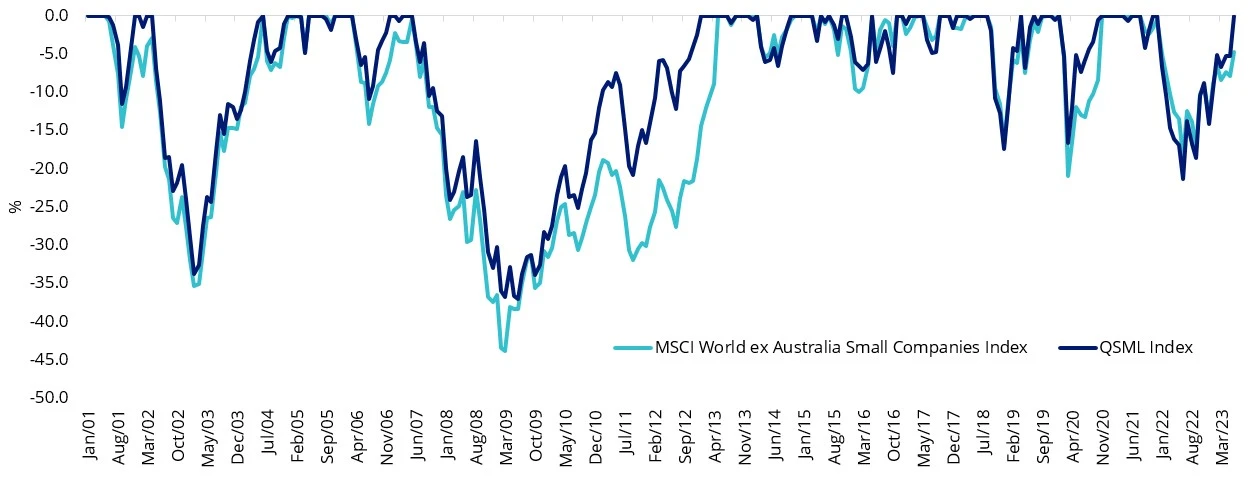
Source: Morningstar Direct, 1 January 2001 to 30 June 2023. The above charts are hypothetical comparisons of performance of the QSML Index and the MSCI World ex Australia Small Cap Index (“Parent Index”). QSML Index performance prior to its launch in December 2020 is simulated based on the current index methodology. Results are calculated to the last business day of the month and assume immediate reinvestment of all dividends and exclude fees and costs associated with investing in QSML. You cannot invest in an Index. Past performance information is not a reliable indicator of future performance of the indices or QSML. The Parent Index is shown for comparison purposes as it is the widely recognised benchmark used to measure the performance of developed market small companies, weighted by market cap. QSML Index measures the performance of 150 companies selected from the Parent Index based on MSCI quality scores. Consequently, the QSML Index has fewer companies and different country and industry allocations than the Parent Index. For more information click here
Australians are no strangers to small caps:
Australian advisers are no strangers to Australian small companies, but the world is far bigger than the ‘Small Ords’ and we think global small companies could be an overlooked asset class by Australian investors.
We recently released a new research paper Global small-caps: An overlooked opportunity, which shows global small-caps, which are typically underrepresented in Australian investment portfolios, have outperformed international large- and mid-caps as well as Australian small-caps over the long term.
The paper makes a few interesting observations considering Australian large and small companies:
- According to a review of Morningstar data, 17% of all money invested in Australian equity funds (ex ETFs) in Australia are invested in small companies funds. This compares with just 2% of all international equity funds (ex ETFs) being invested in international small companies. This is surprising when you consider the different opportunity sets and the better relative performance of the ‘size effect’ in overseas markets. The ASX represents less than 2% of the developed global share market, hence the appeal of adding international equities to a portfolio.
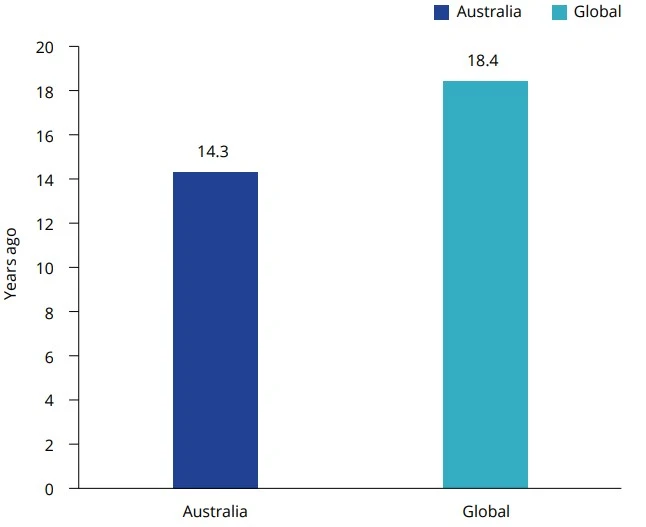
- Global small companies are not ‘small’ by Australian standards. Local investors might be surprised to learn that global small-caps, in the context of market size, would be characterised as mid-caps in Australia when measured by market capitalisation.
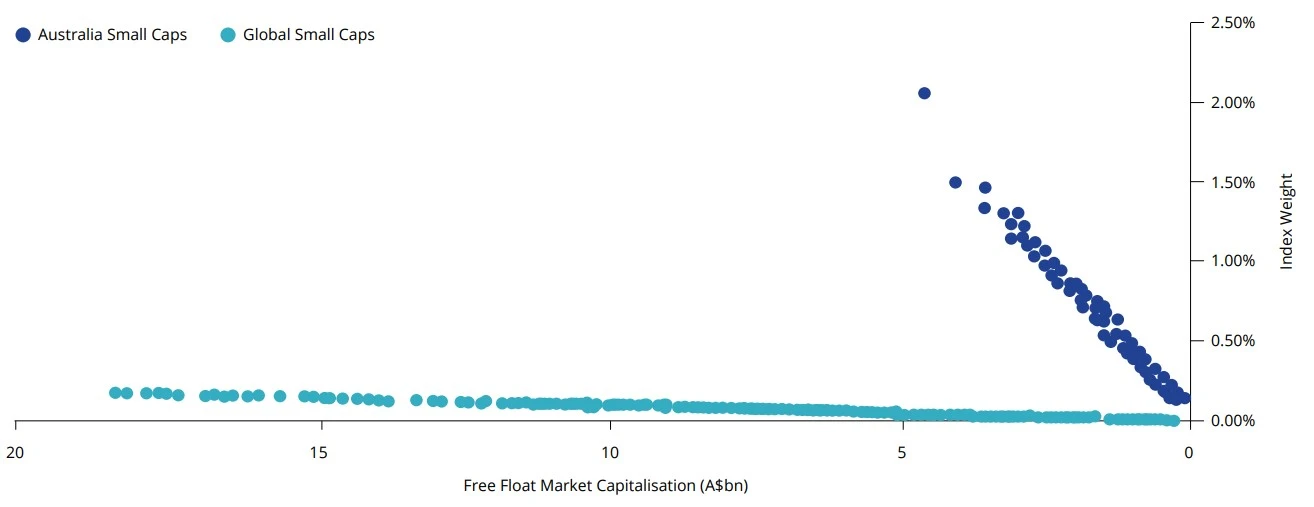
Source: S&P, MSCI, as at 30 April 2023. Australian Small Caps is S&P/ASX Small Ordinaries Index, Global Small Caps is MSCI World ex Australia Small Caps Index.
Higher average market capitalisation of global small-caps relative to Australian small-caps implies that these companies are more established businesses in the ‘growth’ phase of the business cycle. Australian small-caps by comparison have a higher proportion of companies in the ‘introduction’ phase, meaning that sales and earnings growth are likely to be more mixed, with a shorter track record.
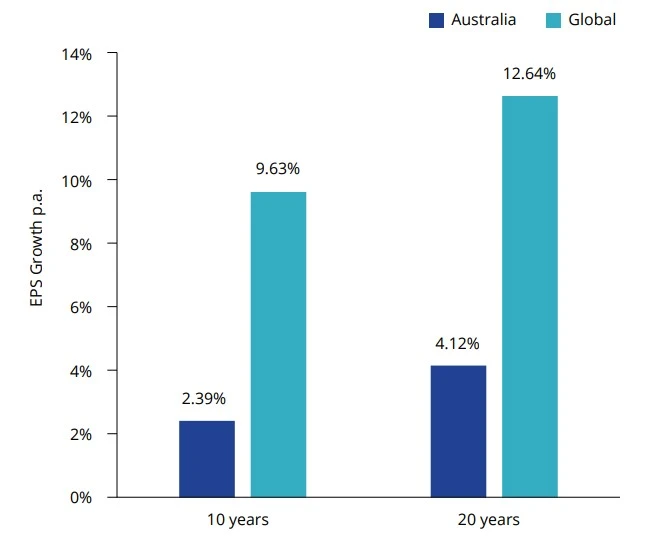
- Offshore exchanges tend to have stricter rules around profitability and financial viability requirements for listing. Weaker listing requirements at home mean Australian small-caps have almost double the exposure to non-profitable companies, compared to global. The largest Australian small-cap sector is materials. In the global index, it is one of the smallest sectors. Many small unprofitable mining companies list on the Australian stock exchange in the ‘infant’ stage of the business cycle to raise capital for exploration or mine development where debt and private equity financing is unavailable.
| Chart 4: EPS growth comparison | Chart 5: Listing date comparison |
 |
 |
But Australians could be missing out on this overlooked asset class
Australian investors are attracted to small-caps for their growth potential. Indeed, a significant body of empirical research supports the ‘size’ factor. But, as highlighted in our paper, Global small-caps: An overlooked opportunity, the S&P/ASX Small Ordinaries Index has delivered lower cumulative returns relative to the broader Australian equities benchmark since 1998. The opposite is true for global small companies. The paper begs the question, wouldn’t Australian investors targeting the size factor be better off investing in global small-caps than Australian small-caps?
Chart 6: Different performance outcomes of the ‘size’ factor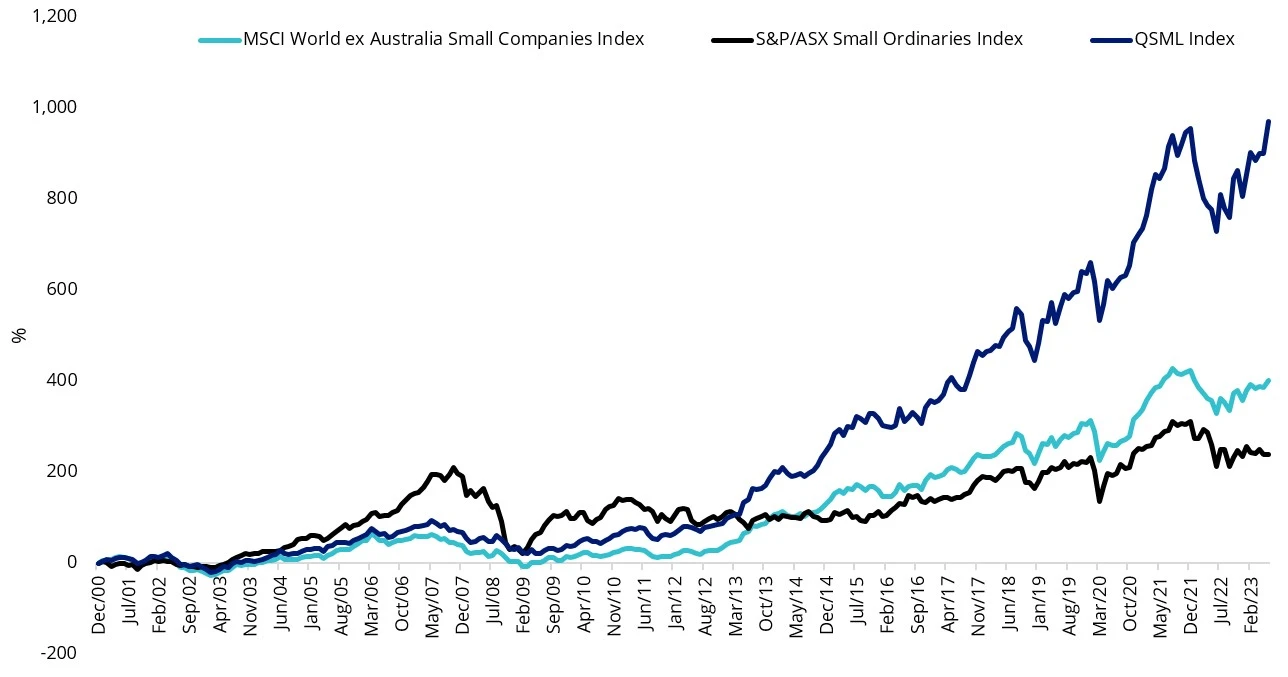
Source: Morningstar Direct, 1 January 2001 to 30 June 2023. The above charts are hypothetical comparisons of performance of the QSML Index, the S&P/ASX Small Ordinaries Index and the MSCI World ex Australia Small Cap Index (“Parent Index”). QSML Index performance prior to its launch in December 2020 is simulated based on the current index methodology. Results are calculated to the last business day of the month and assume immediate reinvestment of all dividends and exclude fees and costs associated with investing in QSML. You cannot invest in an Index. Past performance information is not a reliable indicator of future performance of the indices or QSML. The Parent Index is shown for comparison purposes as it is the widely recognised benchmark used to measure the performance of developed market small companies, weighted by market cap. QSML Index measures the performance of 150 companies selected from the Parent Index based on MSCI quality scores. Consequently, the QSML Index has fewer companies and different country and industry allocations than the Parent Index. The S&P/ASX Small Ordinaries Index (“Small Ords”) is shown for comparison purposes as it is the widely recognised Australian small-cap benchmark used to measure the performance of the 200 ASX-listed companies included in the S&P/ASX 300 but not in the S&P/ASX 100, weighted by market capitalisation. QSML Index measures the performance of 150 companies selected from the Parent Index based on MSCI quality scores. Consequently, the QSML Index invests in international small companies and therefore has exposure to many countries. It also has fewer companies and different industry allocations than the Small Ords. For more information click here.
Key risks: An investment in the ETF carries risks associated with ASX trading time differences, financial markets generally, individual company management, industry sectors, foreign currency, country or sector concentration, political, regulatory and tax risks, fund operations, liquidity and tracking an index. See the PDS for details.


Published: 20 July 2023
Any views expressed are opinions of the author at the time of writing and is not a recommendation to act.
VanEck Investments Limited (ACN 146 596 116 AFSL 416755) (VanEck) is the issuer and responsible entity of all VanEck exchange traded funds (Funds) listed on the ASX. This is general advice only and does not take into account any person’s financial objectives, situation or needs. The product disclosure statement (PDS) and the target market determination (TMD) for all Funds are available at vaneck.com.au. You should consider whether or not any Fund is appropriate for you. Investments in a Fund involve risks associated with financial markets. These risks vary depending on a Fund’s investment objective. Refer to the applicable PDS and TMD for more details on risks. Investment returns and capital are not guaranteed.
QSML is indexed to a MSCI index. QSML is not sponsored, endorsed or promoted by MSCI, and MSCI bears no liability with respect to QSML or the MSCI World ex Australia Small Cap Quality 150 Index. The PDS contains a more detailed description of the limited relationship MSCI has with VanEck and QSML.