The stocks that have moved back into view


Australia’s largest companies dominate portfolios, but reporting season suggests stronger growth may be emerging among small and mid-caps.
Behavioural economist Daniel Kahneman had an acronym for the mind’s tendency to construct a complete story from the evidence immediately in front of it: WYSIATI, or “what you see is all there is”.
The Australian share market has become a case study in this principle.
The S&P/ASX 200 is seen by investors as the home of Australian equities, by super funds as a source of liquidity and by regulators as a familiar benchmark. All these perspectives create the illusion that the largest companies receive the largest allocations with conviction. But this is not the case.
Australia’s largest companies have not become safer because everyone owns them. They have simply become harder not to own. Reporting season is now exposing the potential opportunity cost of this investing reality, with the strongest expected earnings growth emerging among small- and mid-sized companies.
To understand why this allocation persists, start with scale. Australia’s superannuation system manages approximately $4.4 trillion. While that figure is a symbol of our world-class retirement system, it has also created a problem: much of that capital is managed by institutions that can become too large for much of the Australian share market.
For a super fund managing $100 billion, even a 0.1% position represents $100 million. That capital can be deployed readily in Commonwealth Bank or BHP. In a smaller company, it could represent days of trading volume and a significant ownership stake. A position small enough to avoid those constraints may also be too small to affect the fund’s returns.
Robert C. Merton described this problem in his 1987 paper on capital markets with incomplete information. Merton argued that investors do not choose from every available security, but from the smaller set they recognise. For less-followed businesses, a narrower investor base can reduce demand, affect valuations and increase the return required to attract capital.
Ivy League academics Paul Gompers and Andrew Metrick later found that large US institutional investors preferred larger, more liquid companies. As institutional ownership grew over the research period (1980-1996), these preferences increased demand for large stocks relative to small cap stocks.
The average Australian investor experiences both effects through conventional Australian equity exposure. For every $100 invested in an S&P/ASX 200 fund, almost $50 is directed towards just ten companies. That allocation does not necessarily mean those companies offer the best prospects. In fact, as I argued in the Australian Financial Review, last financial year’s headline return masked the risks of a market dependent on a narrow group of companies. As institutional ownership grows, this feedback loop can strengthen, allowing size to be mistaken for conviction.
The warning was easy to ignore because, for the first seven months of 2026, a bias towards large companies appeared to pay dividends. Through late July, the S&P/ASX Small Ordinaries Index had fallen approximately 13%, while the S&P/ASX 100 had gained almost 5%. Smaller companies faced legitimate headwinds from rising interest rates, soaring energy prices and lacklustre consumer and business confidence.
But as the environment has changed, that conclusion has become harder to defend.
Chart 1: Reporting season has rewarded companies outside the large caps
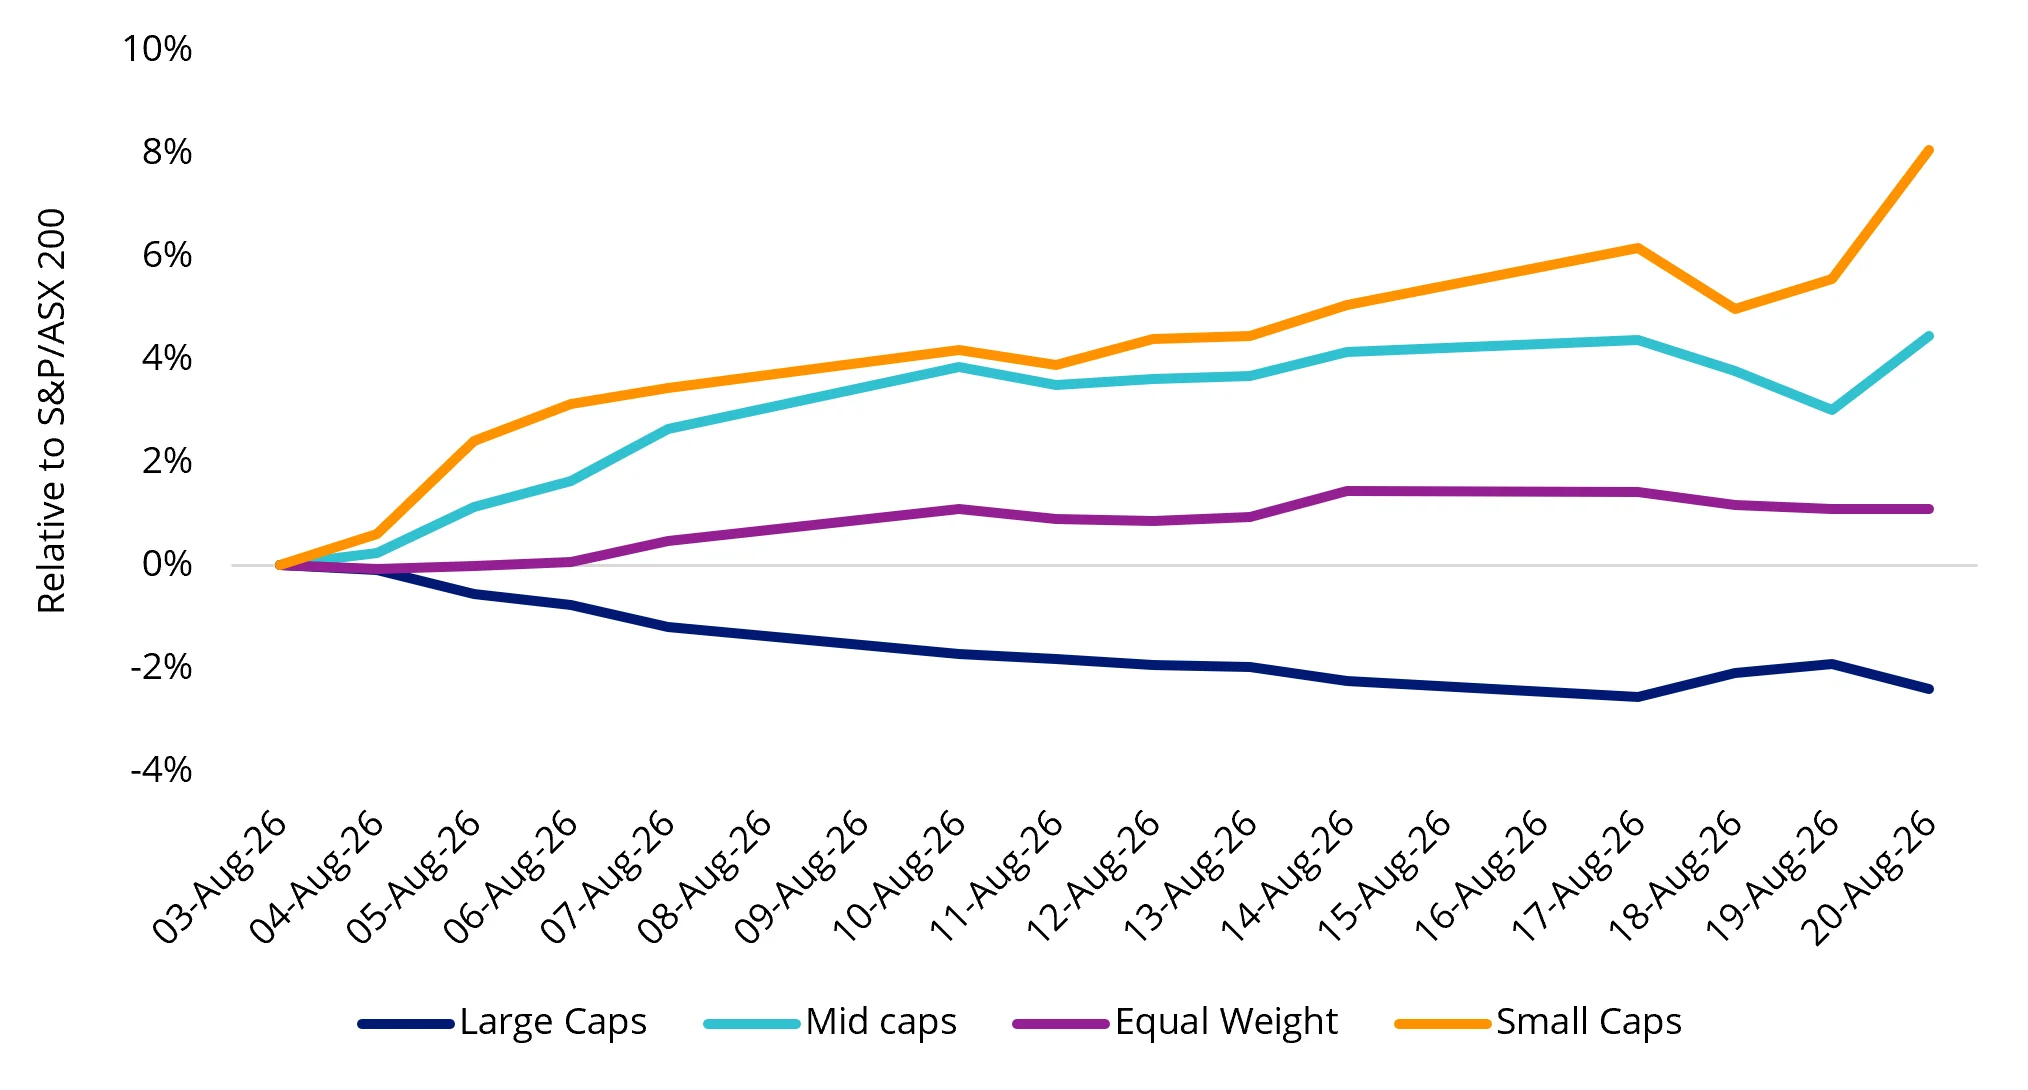
Source: VanEck, Bloomberg. As at 24 August 2026. Large Caps is S&P/ASX 20 Index, Mid caps is S&P/ASX Midcap 50 Index, Equal weight is MVIS Australia Equal Weight Index, Small Caps is S&P/ASX Small Ordinaries Index. Past performance is not indicative of future performance. You cannot invest directly in an index.
August showed that earnings growth alone does not determine the market reaction. A company can rise 5% or fall 5% depending on whether its outlook exceeds or disappoints expectations. This reporting season, some of the strongest outlooks are emerging outside the market leaders.
Consensus estimates suggest Australian small companies could deliver earnings per share growth of approximately 28% over the next year and 25% the year after. Mid-sized companies are expected to produce growth of around 13% and 8% respectively. By contrast, the largest companies have earnings growth estimates of closer to 4% and 2% respectively.
Chart 2: Earnings growth is expected to be strongest outside large caps
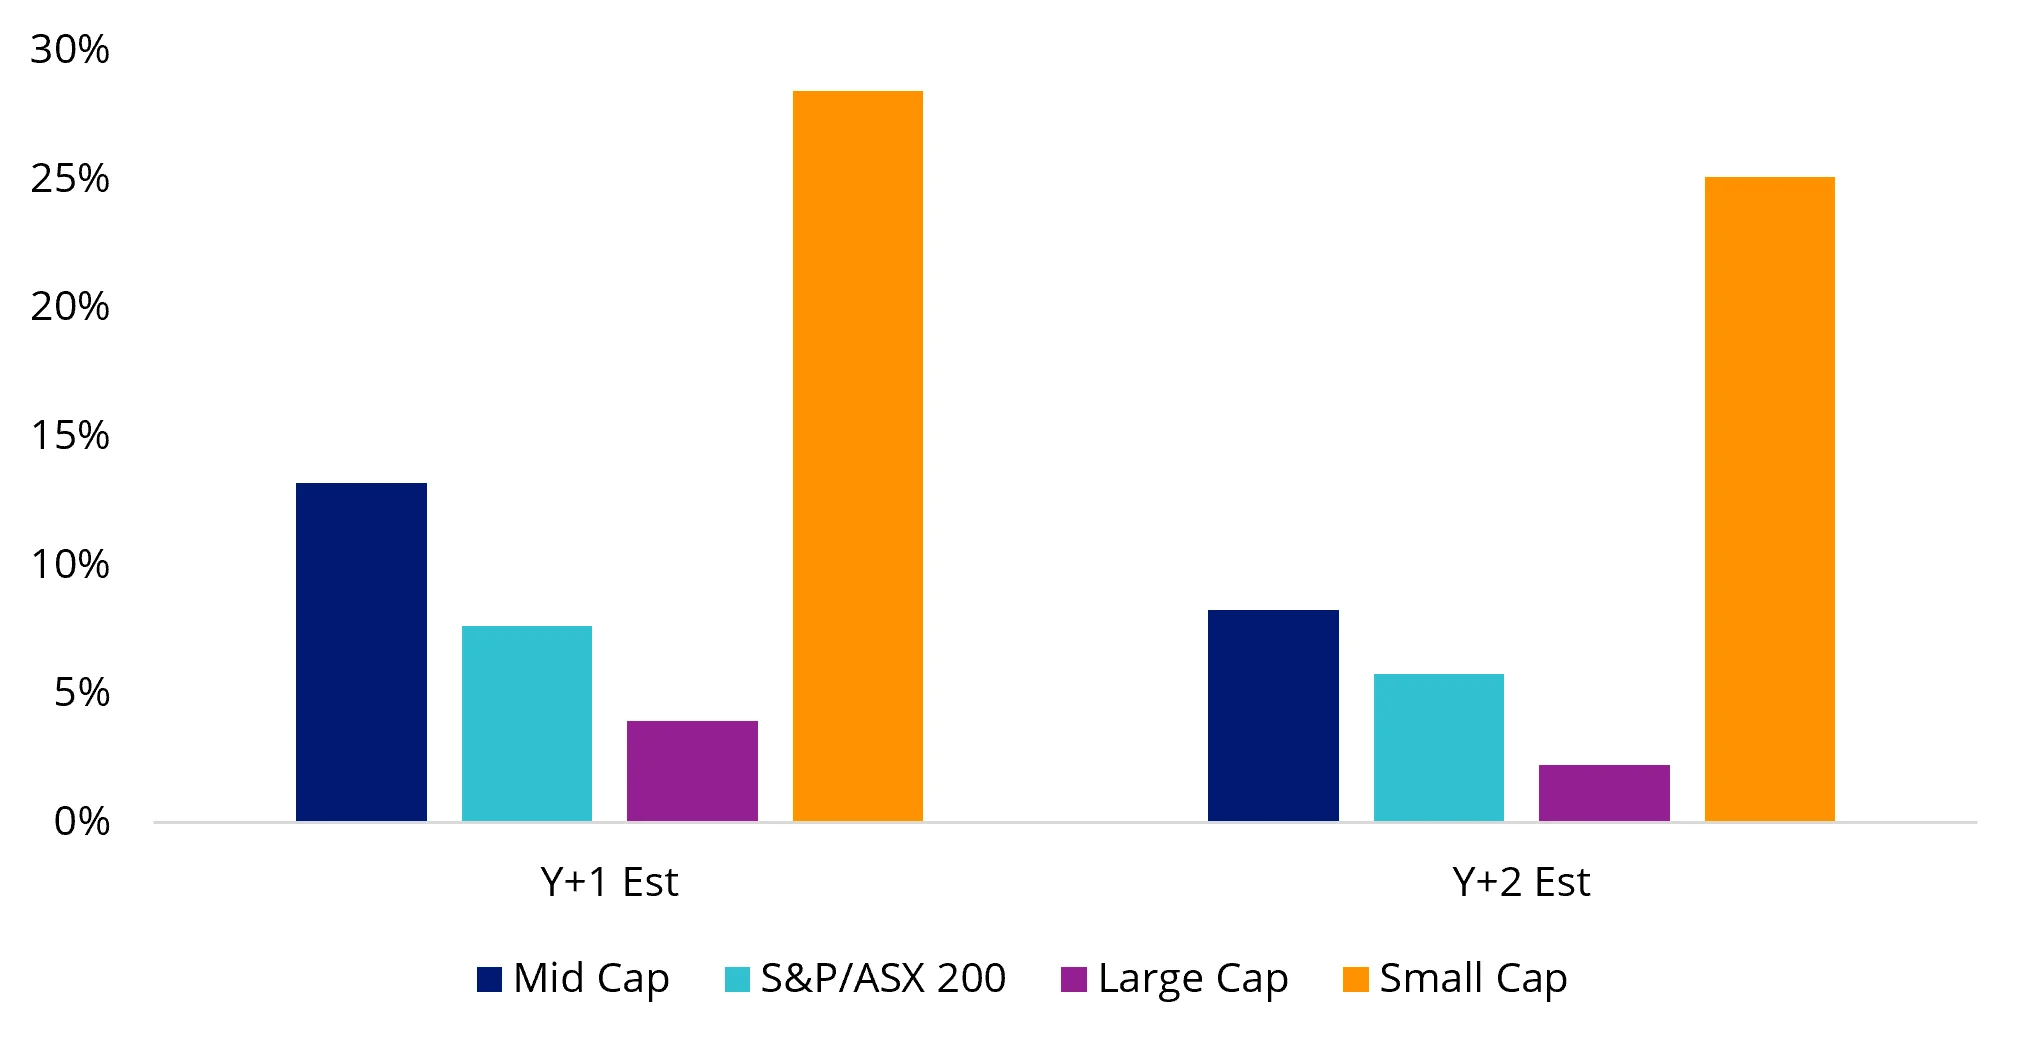
Source: VanEck, Bloomberg. As at 24 August 2026. Large Caps is S&P/ASX 20 Index, Mid caps is S&P/ASX Midcap 50 Index, Equal weight is MVIS Australia Equal Weight Index, Small Caps is S&P/ASX Small Ordinaries Index. Forecasts are not guaranteed and are subject to change.
While forecasts will change, the direction is difficult to ignore.
Market capitalisation weighting is indifferent to where earnings are growing fastest. It gives the greatest influence toward the companies the market has already made largest. That may be a sensible way to measure the market. It is not, by itself, a reason to allocate capital the same way.
None of this requires the largest companies to fail. It requires earnings elsewhere to improve faster than the market expects. For investors this may mean taking an approach different from market capitalisation.
August offered the first evidence that large caps lagging may already be happening.
The aggregate forecasts noted above do not mean every constituent is profitable or equally capable of delivering growth. Many companies within the S&P/ASX Small Ordinaries Index have negative trailing earnings. This may mean a more selective approach to Australian small companies may be warranted.
Recently, higher rates exposed the difference between growth funded by a business and growth funded by its shareholders. Markets now expect less additional RBA tightening than they did a few months ago. Because small companies have historically been sensitive to changing rate expectations, that repricing can ease some pressure on valuations.
The opportunity is not evenly spread. For instance, many smaller industrial businesses support mining, utilities, transport and energy infrastructure, earning recurring revenue from maintenance and sustaining expenditure that asset owners cannot indefinitely defer. They may sit outside the large cap index, but they are embedded in the assets on which the economy depends.
August reporting season showed why selectivity matters. Macmahon Holdings (ASX: MAH) increased earnings per share by 25%, generated more free cash flow and reduced net debt. Superloop (ASX: SLC) completed its first profitable financial year and increased free cash flow by 50%.
Both companies were rewarded after reporting. Neither was rewarded simply because it was small. What mattered was the improving financial evidence.
The same pattern is appearing one rung higher. Pro Medicus (ASX: PME) increased revenue by nearly 23% and underlying net profit by 24%. Its shares rose sharply after reporting. Elsewhere, Genesis Minerals (ASX: GMD) increased production by 33%, more than doubled EBITDA and declared its first dividend. Their mid-cap status reflects their size, not the maturity of their businesses or the quality of their financial evidence.
Yet institutional capital remains directed towards the largest companies. Super funds require liquidity and positions large enough to matter, while market capitalisation-weighted funds allocate more to the companies that are already the largest.
One month does not prove a lasting reversal. But the strength emerging outside the market leaders shows that the hierarchy can be challenged. Australia’s large caps are what investors see. They are not all there is.


Published: 31 August 2026
Any views expressed are opinions of the author at the time of writing and is not a recommendation to act.
VanEck Investments Limited (ACN 146 596 116 AFSL 416755) (VanEck) is the issuer and responsible entity of all VanEck exchange traded funds (Funds) trading on the ASX. This information is general in nature and not personal advice, it does not take into account any person’s financial objectives, situation or needs. The product disclosure statement (PDS) and the target market determination (TMD) for all Funds are available at vaneck.com.au. You should consider whether or not an investment in any Fund is appropriate for you. Investments in a Fund involve risks associated with financial markets. These risks vary depending on a Fund’s investment objective. Refer to the applicable PDS and TMD for more details on risks. Investment returns and capital are not guaranteed.