The most important number in investing


Just as a hurdler must clear the bar in front of them, every investment must deliver enough return to justify its risk. In investing, that hurdle is set by the US 10-year Treasury bond yield.
It is the most important number in investing and as you will find out, it impacts the value of everything in your portfolio.
For much of the past 15 years, the US 10-year Treasury yield was kept close to the ground, meaning the yield was very low (and even below 1% during the depths of the COVID-19 pandemic). But this year, persistent inflation, heavy government borrowing and geopolitical unrest have contributed to pushing that number to its highest level since 2007. Meanwhile, its Australian equivalent has reached levels last seen in 2011.
Investors who can understand why this move is important and what is driving it can identify which assets have the best shot at clearing it and which will fall by the wayside, a distinction that could prove vital in both defending portfolios and finding early opportunities in a correction.
The number beneath the market
The US 10-year Treasury yield is the yearly interest rate an investor would earn at that point in time if they lent money to the American government for 10 years and held the investment until its maturity.
The time an investor buys in is crucial because the 10-year yield reflects the return investors would earn in that moment. Yields also change minute by minute when the markets are open.
Another important note is that a bond’s yield tends to move in the opposite direction to its price. If new bonds start paying 5%, an existing bond paying 3% looks less attractive, so, all else being equal, its price falls until its yield is competitive.
US and Australian government bonds are treated as carrying negligible default risk in their own currencies, meaning there is a near-certain chance an investor will get their starting capital back.
The components of the most important number in finance
One way to understand the 10-year yield is to split it into two parts: the expected path of short-term interest rates and the term premium.
The first part moves when investors expect a central bank (e.g. the US Federal Reserve or the Reserve Bank of Australia) to move its policy rate.
The second part is the term premium, a figure which estimates the extra compensation that investors demand for accepting the uncertainty that comes with lending for a long period of time. It is easier to predict what the official interest rate will be in a month, rather than 10 years in advance; the term premium, or higher rate is to compensate investors for that longer term risk.
Why the US Treasury matters more than the rest
The US bond market is the deepest and most liquid market in the world. These US Treasury bonds are held as reserves, pledged as collateral and used to price loans and investments across the global financial system.
10 years gives investors enough of a leash to react to changing interest rate expectations, while also reflecting how they see growth and inflation over the long term.
Investors expect shares, credit or property to offer more than the return of a US government security. When the Treasury yield rises, those assets must offer more income, faster growth or a cheaper entry price to preserve that compensation.
When yields drop, they elevate the present value of future corporate earnings, lifting equity market valuations.
Chart 1: The US 10-year yield and the valuation multiple of US shares since 2000
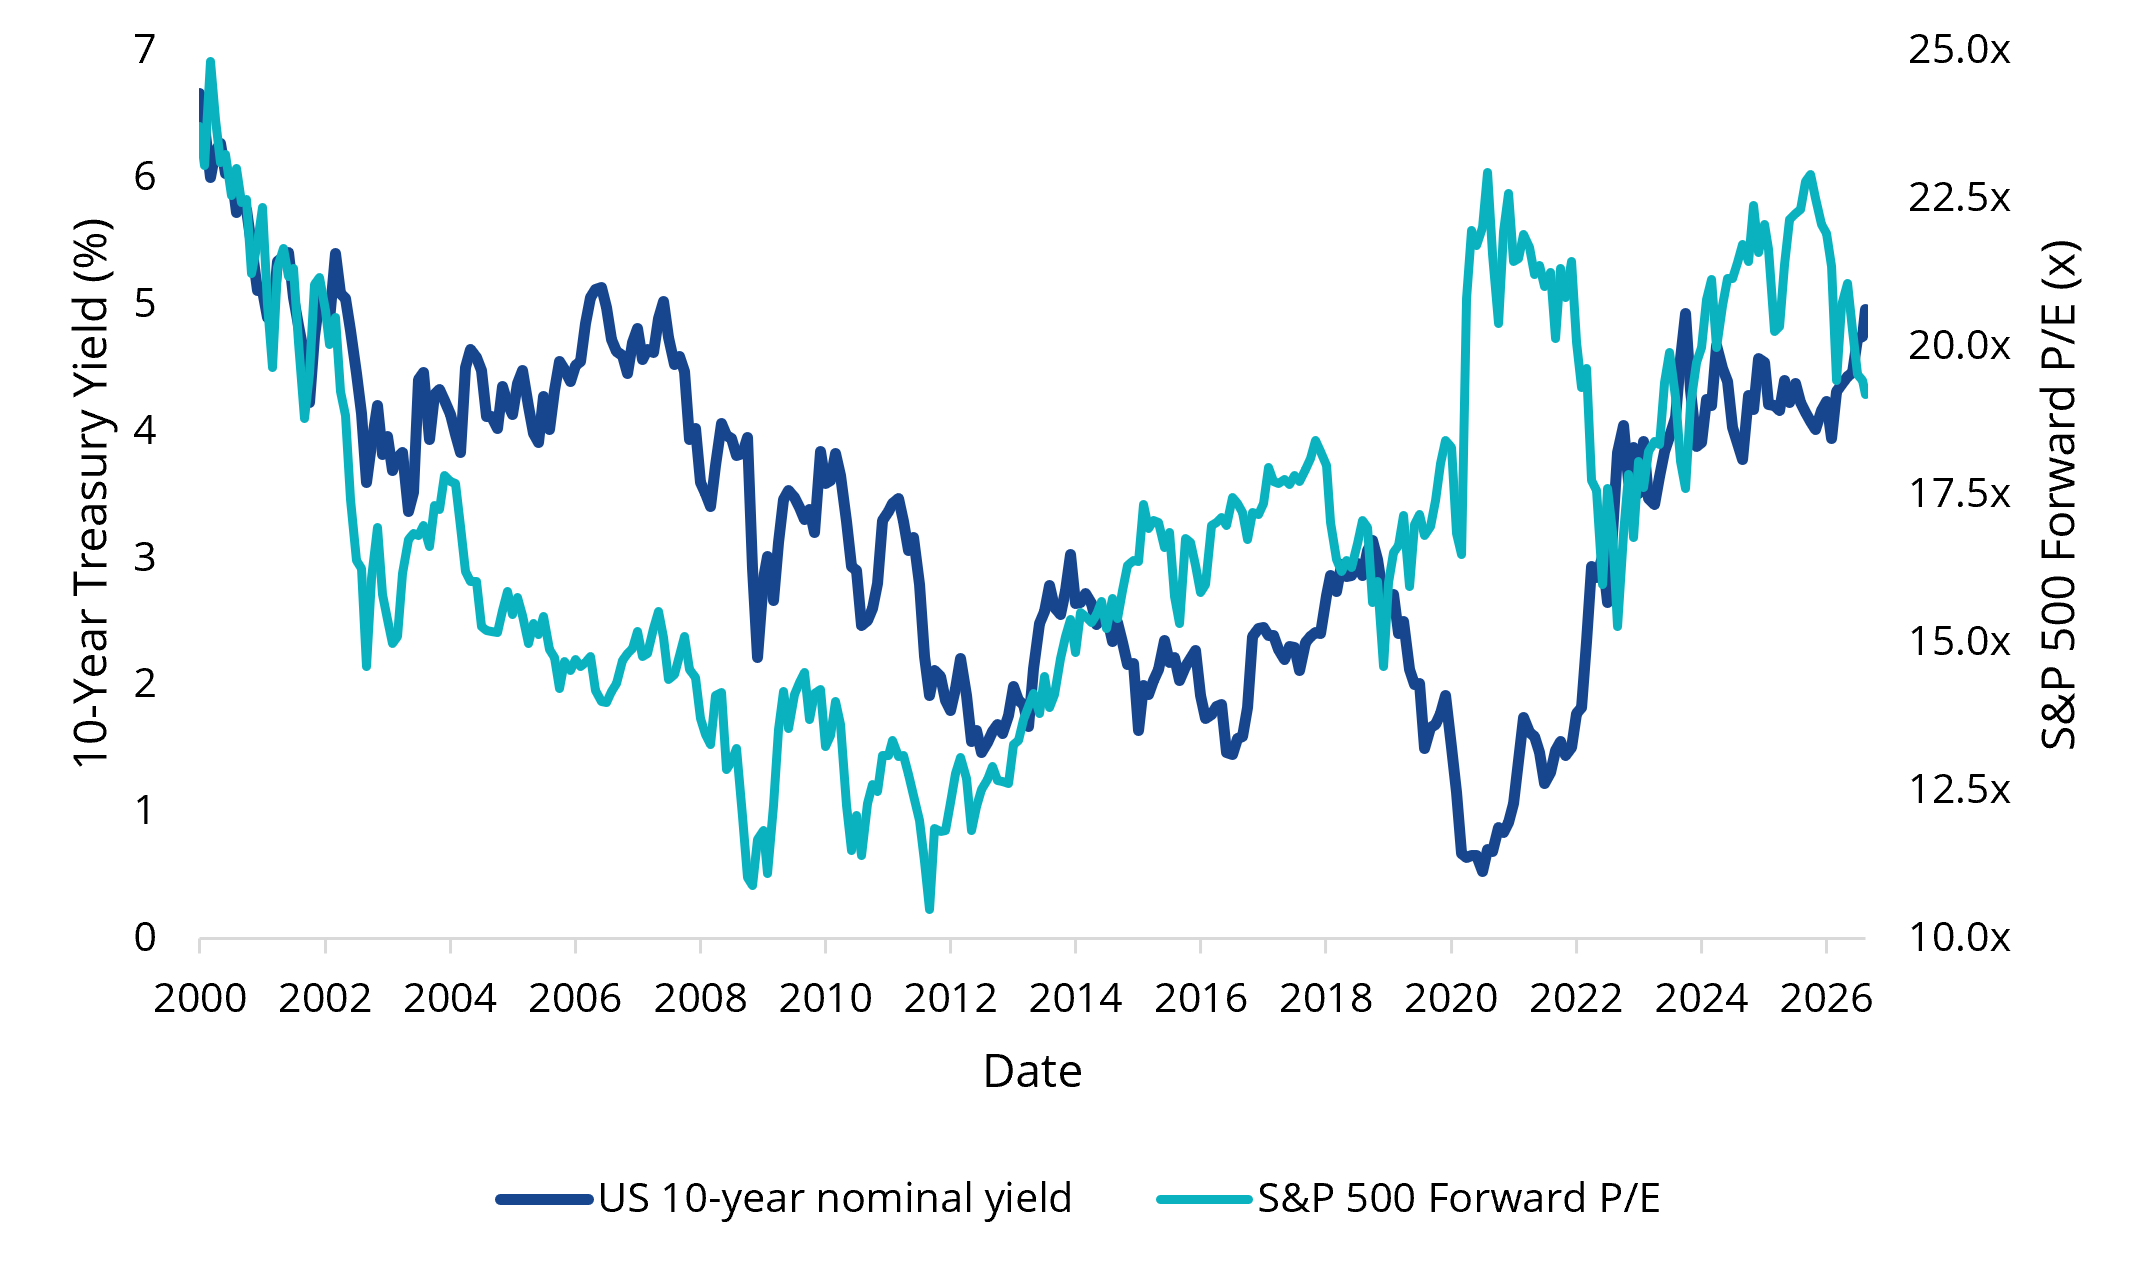
Source: Bloomberg. US 10Y nominal yield: GT10 Govt; US equity valuation: S&P 500 best (consensus forward) P/E ratio. Month-end observations, Jan-2000 to 14-Sep-2026.
This helps explain why a share price can fall without any change in the underlying business.
Valuing a company involves estimating the cash it may generate and translating those future amounts into today’s dollars. Professional investors do this using a discount rate, which starts with the 10-year yield and adds compensation for the greater risk of owning shares. When that yield rises, it can lift the discount rate used to value shares. The return investors require from shares therefore rises too, placing pressure on the price they are prepared to pay.
Growth companies are more sensitive because much of their expected value rests on profits that may not arrive for years. The further into the future a cash flow sits, the more a higher discount rate reduces its present value. Mature companies generating cash today have less of their valuation riding on distant expectations.
The other reason the 10-year yield matters so much is because of the influence of the US Treasury itself. The US yield can influence global borrowing costs, the performance of currencies, and by extension, the performance of Australian bonds and equities as well.
The period that bent investors’ rulers
A yield near 5% feels extreme if you only started investing after the Global Financial Crisis. The US 10-year remained below 3% for almost all the period from mid-2011 to mid-2022 and fell towards 0.5% during the pandemic. But as the chart below shows, a yield above 5% has been seen before.
Chart 2: The US 10-year Treasury yield over the past 60 years
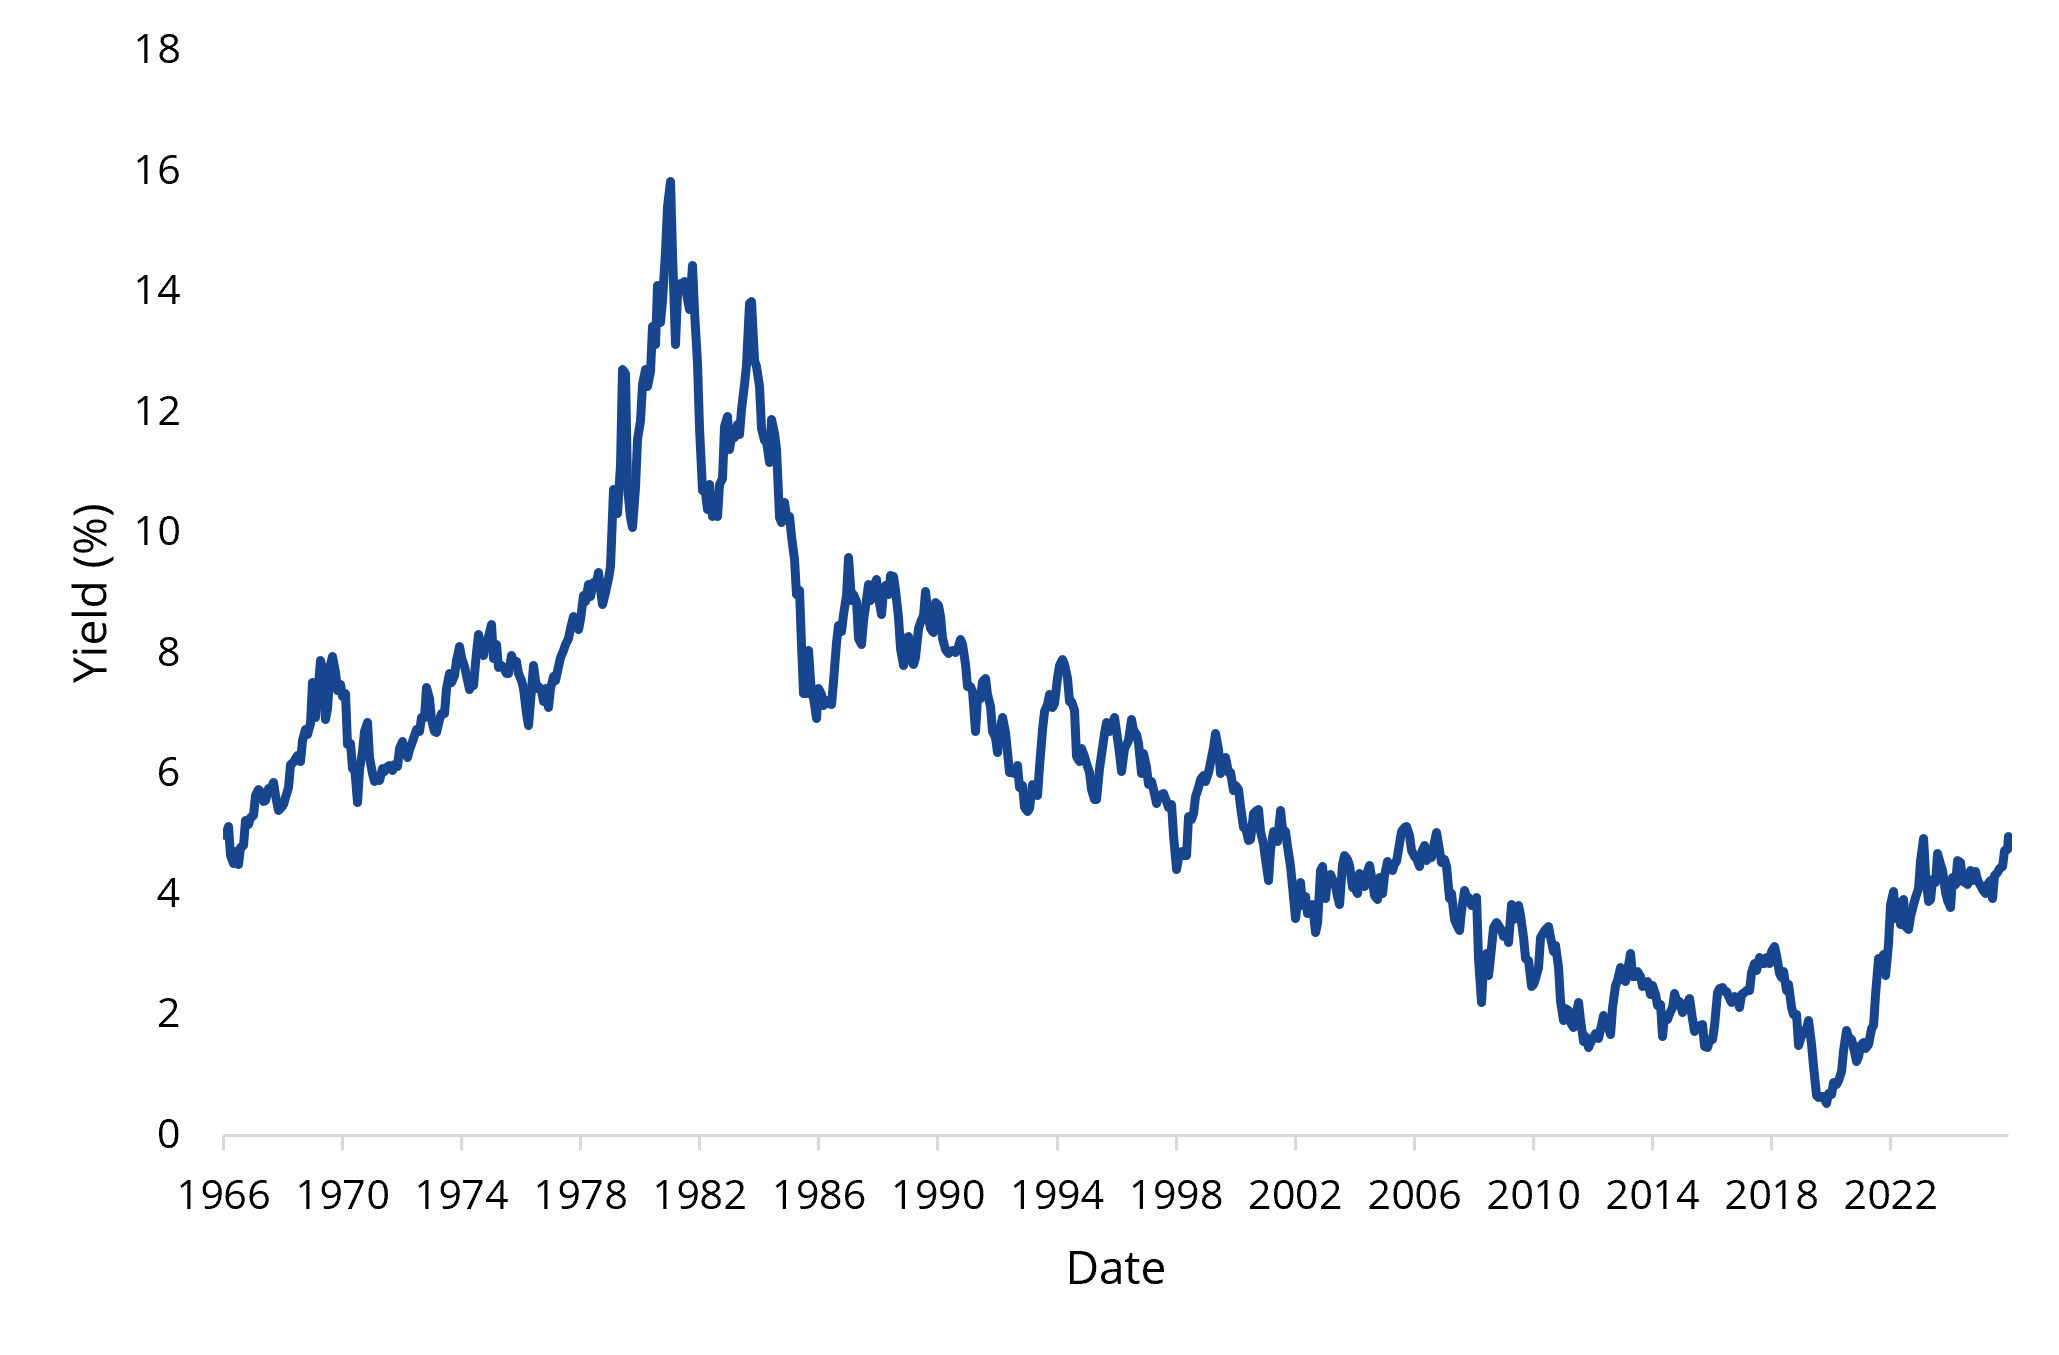
Source: Bloomberg. Month-end observations, Sep-1966 to 14-Sep-2026. USGG10YR Index (US Generic Govt 10 Yr, constant-maturity yield derived from the Fed H.15 release).
Notable credit investor Howard Marks has compared the structural decline in interest rates since the 1980s to an airport moving walkway. Investors moved forward with help beneath their feet, sometimes mistaking the tailwind for their own speed. Bond prices benefited from lower yields, equities from lower borrowing rates.
Now, that walkway appears to have changed direction. Inflation has proved harder to extinguish since the COVID-19 pandemic, with Federal Reserve projections putting 2026 inflation at 3.6%, much higher than the Fed’s 2% target.
The economy is also demanding more capital. Investment in artificial intelligence, data centres, energy systems and manufacturing capacity is competing with other borrowers for savings. At the same time, the US government must finance large deficits and refinance an expanding stock of debt. Federal debt has passed US$40 trillion, but the flow of new issuance matters more to bond investors than the headline total.
All this pressure is appearing in the term premium. As investors demand more compensation for owning these long-dated bonds, yields push higher. And as we’ve already discussed, higher yields push the hurdle rate for investment returns much higher.
The valuation of everything needs to be reassessed.
What clears a higher hurdle?
A US 10-year yield near 5% is prompting many investors to consider their portfolios. Positioning should depend on their own risk tolerance and time horizon.
In the immediate term, we remain positive on international value. Many value companies generate strong cash flows in the present rather than depending on profits far into the future. Companies with sound balance sheets and pricing power remain better placed than businesses reliant on cheap refinancing.
Emerging markets also stand out in our opinion. Although emerging market assets have often struggled when US bond yields and the US dollar rise, company valuations remain attractive and earnings have improved. Stronger institutions and deeper local bond markets have also left many emerging economies better equipped to manage external pressure than their reputations suggest.
Fixed income may offer the biggest opportunity set. When yields sat near zero, investors were exposed to price falls with little income to soften the blow. Today’s higher starting yields provide a much larger buffer. Investors are being paid to wait, while long-duration bonds offer greater capital upside if yields fall and greater downside if they continue rising.
Finally, we think gold remains an important counterweight, supported by mounting government debt levels, central-bank demand and concern about the purchasing power of currencies.
In short, no one asset will dish out the golden ticket. That is true of every cycle, as the following table shows. But together, a collection of assets may give investors more than one way to clear the higher hurdle.
Table 1: How asset classes have performed during rising bond yield periods
| 4 Feb 1994 – 1 Feb 1995 | 30 Jun 1999 – 16 May 2000 | 30 Jun 2004 – 29 Jun 2006 | 2 May 2013 – 31 Dec 2013 | 16 Mar 2022 – 26 Jul 2023 | |
|---|---|---|---|---|---|
| Change in yields | +210bps | +91bps | +44bps | +140bps | +342bps |
| DM Equity | -3.5% | 10.4% | 22.3% | 13.0% | 3.7% |
| EM Equity | -20.9% | 6.9% | 67.4% | -3.3% | -4.5% |
| Gold | -2.8% | 6.4% | 47.6% | -18.3% | 2.7% |
| Global REITs | -20.2% | -3.6% | 62.3% | -8.2% | -12.9% |
| EM Bonds | -21.6% | 13.7% | 24.8% | -7.6% | -2.7% |
| DM Bonds | 2.4% | -2.7% | 6.5% | -1.7% | -8.7% |
Source: Bloomberg. Returns are cumulative from the start date to the end date shown for each period, during which the US 10-year Treasury yield rose. All returns are in US dollars. DM Equity is MSCI World Price Index (MXWO). EM Equity is MSCI Emerging Markets Price Index (MXEF). Global REITs represented by FTSE EPRA Nareit Global Index (RUGL). Gold is Bloomberg Gold Subindex Total Return (BCOMGCTR). EM Bonds is J.P. Morgan EMBI Global Total Return Index (JPEIGLBL). DM Bonds represented by Bloomberg Global Aggregate Total Return Index, USD Hedged (LEGATRUU). Equity returns exclude dividends, other returns include income reinvested. Past performance is not an indicator of future performance. You cannot invest directly in an index.
The number is not the answer
The 10-year bond yield serves as a clue for what investors should be expecting from the other components in a portfolio.
Investors do not have to predict the yield’s next move. But if yields continue to march higher from here, owning a diversified portfolio which consists of several assets that can clear the higher hurdle will be crucial.
At least now you know the most important number in investing. It impacts the valuation of everything.


Published: 24 September 2026
Any views expressed are opinions of the author at the time of writing and is not a recommendation to act.
VanEck Investments Limited (ACN 146 596 116 AFSL 416755) (VanEck) is the issuer and responsible entity of all VanEck exchange traded funds (Funds) trading on the ASX. This information is general in nature and not personal advice, it does not take into account any person’s financial objectives, situation or needs. You should consider whether or not an investment in any Fund is appropriate for you. Investments in a Fund involve risks associated with financial markets. These risks vary depending on a Fund’s investment objective. Refer to the applicable product disclosure statement (PDS) and target market determination (TMD) available at vaneck.com.au for more details. Investment returns and capital are not guaranteed.