A sneak peek at the newest Australian quality ETF


The new VanEck MSCI Australian Quality Plus ETF (AQTY) is now trading on ASX. Here we provide some insightful analysis of AQTY versus the S&P/ASX 200.
With over 70 years investing experience, VanEck has been offering investors opportunities since 1955. Our approach for many of our funds is synonymous with investing greats Benjamin Graham and his student Warren Buffett’s1investment philosophies. Deeply embedded in Benjamin Graham’s value investing philosophy is the concept of quality. In what is considered one of the world’s best investing almanacs The Intelligent Investor, Benjamin Graham outlines some of the fundamental measures he looks for in a company. There are seven in total but ones that investors should not ignore include a sufficiently strong financial condition, earnings stability and earnings growth.
Enter ‘quality’. These three characteristics became the basis for MSCI’s Quality Indices, one of which is the index that our popular International Quality ETF (ASX: QUAL) tracks.
You can read more about quality investing here.
In summary, quality is associated with its relative outperformance during slowdowns and contractions as well as its relative resilience during periods of heightened market volatility, which we have written about here and here.
We do not think these outcomes would translate to the Australian market if QUAL’s methodology were applied locally. The Australian equity universe is much more concentrated, from both a sector and stock perspective than the MSCI World ex Australia universe. It is also a much smaller opportunity set.
What this means in practice is that the names in the MSCI Australia Quality Index are not significantly different from the names in the MSCI Australia Growth Index or the MSCI Australia Value Index. Instead of outperforming in a drawdown or during a period of volatility, it may move much further than the broader market because of its exposure to growth. Alternatively, during a low growth and low inflation environment when you would expect quality to do well, it might underperform because value companies are underperforming.
You can see the problem. This has been the focus of our research for a number of years.
In 2022 we published The Australian concentration conundrum, a whitepaper which highlighted why factor investing in Australia does not have the same effectiveness as factor investing in global markets. At the same time, we were working with our index partners to work out if we could create a systematic, rules-based index that could potentially give Australian investors quality outcomes.
Earlier this year, we examined the usefulness of existing quality indices in Australia in The limits of quality in Australia. Our research found that these indices fell short of giving investors quality outcomes.
Readers of last week’s Vector Insights, were informed about the MSCI Australia IMI Quality Plus Index (AQTY Index) – a custom index developed by MSCI in collaboration with VanEck that will aim to provide Australian investors with a way to achieve quality investment outcomes in their home market. You can read that edition of Vector Insights here.
AQTY tracks the AQTY Index, which uses quality as an anchor for company inclusion while also considering factors such as value (to avoid overpaying) and low-price variability (to reduce unexpected volatility).
We think, if Benjamin Grahman and Warren Buffett1were to invest in Australian equities, they would consider AQTY.
Let's look at the inaugural holdings of the AQTY Index. The index includes 50 companies and will rebalance once a quarter.
So, let’s walk through the difference between AQTY Index and the S&P/ASX 200.
AQTY vs S&P/ASX 200 Index – Fundamentals
Table 1: Statistics and fundamentals
|
|
AQTY Index |
S&P/ASX 200 |
|
Index strategy |
Smart beta |
Market capitalisation weight |
|
Number of sectors |
11 |
11 |
|
Number of holdings |
50 |
200 |
|
ROE (%) |
14.33 |
13.62 |
|
Long-term forward EPS Growth (%) |
10.43 |
9.49 |
|
Price/Earnings* |
19.98 |
20.74 |
|
Dividend Yield* |
3.58 |
3.24 |
|
Price/Book* |
2.30 |
2.44 |
|
Price/Sales* |
1.59 |
2.11 |
Weighted average *Weighted harmonic average
Source: VanEck, Factset, as at 29 May 2026. Not a recommendation to act. You cannot invest in an index. Data used prior to May 2026 is simulated. Dividend yield is not guaranteed. Past performance is not indicative of future performance.
Like you would expect from a quality index, AQTY Index has higher return on equity (ROE), higher long-term forward earnings per share (EPS) growth as well as a lower average price to book, price to sales and price to earnings ratio than the S&P/ASX 200.
AQTY Index vs S&P/ASX 200 Index - Sectors
AQTY Index is currently underweight real estate and health care, but overweight energy compared to the S&P/ASX 200. When you look at it on a subsector level, you can see it as overweight sub sectors such as consumer discretionary distribution & retail, and commercial & professional services.
Chart 1 and 2: GICS sector weight differential: AQTY Index v S&P/ASX 200 Index
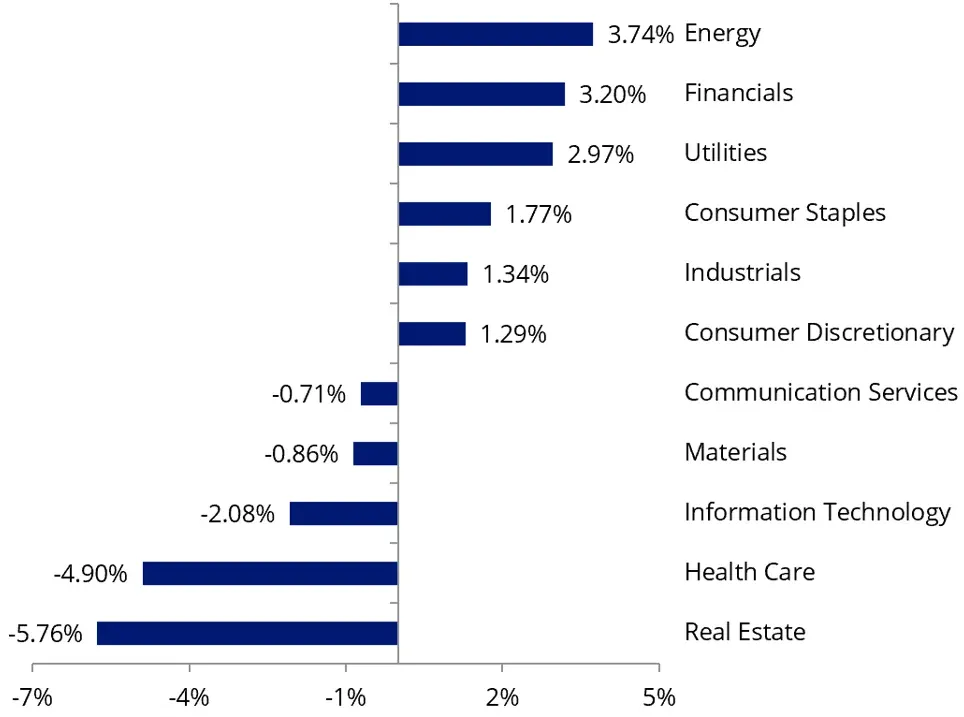
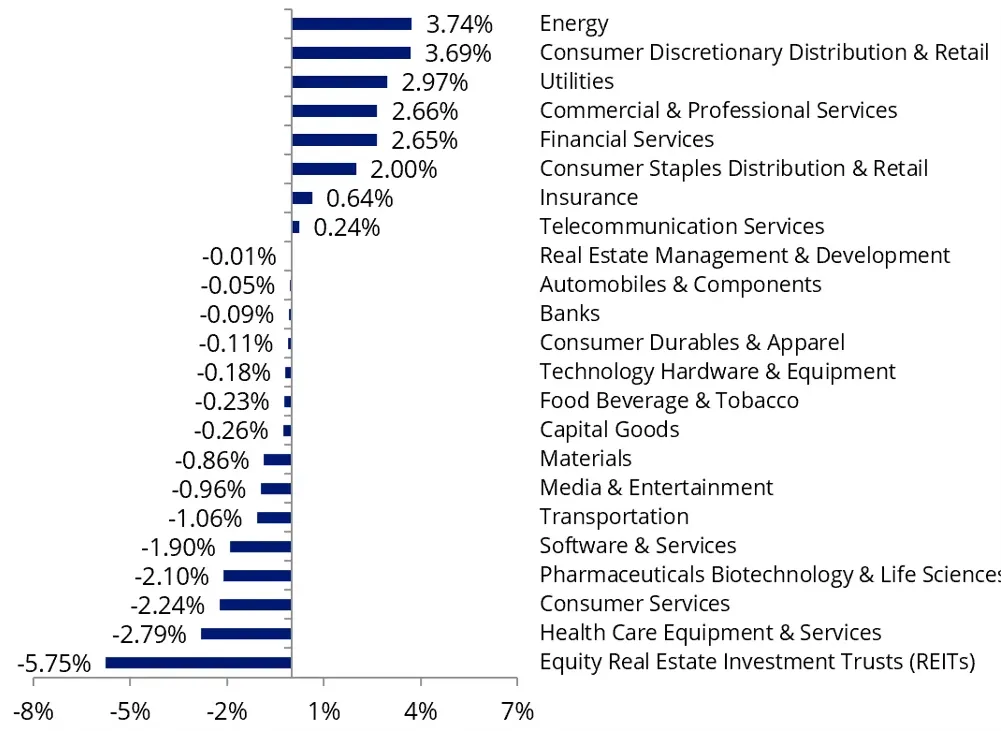
Source: VanEck, FactSet; as at 27 May 2026. AQTY Index is represented by MSCI Australia IMI Quality Plus Index Calculated by subtracting S&P/ASX 200 Index from respective AQTY Index sector and sub-sector weights; positive differentials indicate greater AQTY Index weight in the sector and sub-sector. You cannot invest in an index.
AQTY Index vs S&P/ASX 200 Index - Style
When looking at portfolios it is important to determine what style e.g. value or growth and what size bias a portfolio has e.g. giant, large, mid or small. Below we can see AQTY Index’s. Importantly AQTY Index includes large companies with a slight value skew relative to the S&P/ASX 200, which skews larger (giant) and more toward core/growth.
Chart 3 and 4: AQTY Index holdings based style map, S&P/ASX 200 holdings based style map

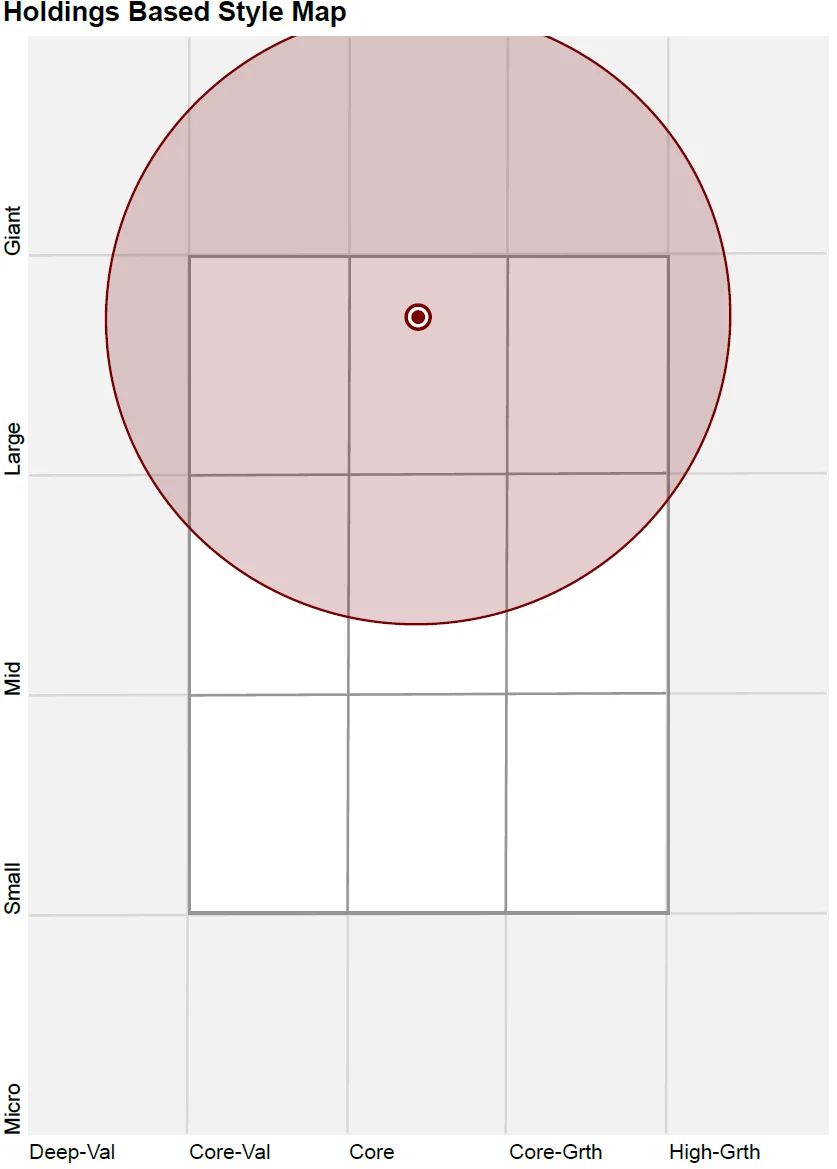
Source: Morningstar Direct, MSCI, as at 27 May 2026
The above analysis is not a recommendation. Please speak to your financial adviser or stock broker.
1 There is no suggestion that Benjamin Graham or Warren Buffett endorse AQTY.
Key risks
An investment AQTY carries risks associated with: ASX trading time differences, financial markets generally, individual company management, industry sectors, country or sector concentration, political, regulatory and tax risks, fund operations and tracking an index. See the PDS and TMD for details.
AQTY is likely to be appropriate for a consumer who is seeking capital growth and a regular income distribution, is intending to use the product as a minor or satellite allocation within a portfolio, has an investment timeframe of at least 5 years, and has a high risk/return profile.


Published: 31 May 2026
Any views expressed are opinions of the author at the time of writing and is not a recommendation to act.
VanEck Investments Limited (ACN 146 596 116 AFSL 416755) (VanEck) is the issuer and responsible entity of all VanEck exchange traded funds (Funds) trading on the ASX. This information is general in nature and not personal advice, it does not take into account any person’s financial objectives, situation or needs. You should consider whether or not an investment in any Fund is appropriate for you. Investments in a Fund involve risks associated with financial markets. These risks vary depending on a Fund’s investment objective. Refer to the applicable product disclosure statement (PDS) and target market determination (TMD) available at vaneck.com.au for more details. Investment returns and capital are not guaranteed.
VanEck MSCI Australian Quality Plus ETF (AQTY) is indexed to a MSCI index. AQTY is not sponsored, endorsed or promoted by MSCI, and MSCI bears no liability with respect to AQTY or the MSCI Index. The PDSs contain a more detailed description of the limited relationship MSCI has with VanEck and the Fund.
© 2026 Van Eck Associates Corporation. All rights reserved.