Global small caps back in focus
As volatility returns and valuations reset, investors are turning to high-quality small caps for resilience and growth potential.
For many investors, the pursuit of ‘quality’ companies has been a successful strategy underlying their portfolio approach.
With many industry pundits forecasting volatility, the macroeconomic backdrop and geopolitical uncertainty bode well for a quality rotation with global small companies.
Globalsmall company valuations, relative to large companies, are at a discount, however, being selective in small companies is important.
There are several signs that suggest we could be in the early stages of a small company quality rotation. These include:
- US manufacturing has shifted into expansionary territory with the ISM Index moving above 50, a backdrop that has historically favoured all caps as capex and production pick up, and QSML is well positioned via its tilt toward industrials.
- US GDP growth outlook consensus forecast is around 2% for 2026 and 2027, a trajectory that bodes well for smaller companies in the market to harvest higher earnings growth.
- Attractive valuations.
- Higher-for-longer oil prices and elevated tariffs could lift inflation concerns and growth uncertainty, which could result in investors favouring quality small caps due to their defensive characteristics,
2026 volatility
Markets have experienced significant volatility over the first four months of 2026. While early concerns were driven by a weakening US labour market and AI disruption adversely impacting tech software earnings, the dominant narrative became the escalation of the US / Iran conflict. This initially led to a broad-based market sell-off, with higher risk segments such as small companies particularly impacted.
In the immediate aftermath, large-cap and energy stocks outperformed, supported by inflationary expectations and safe-haven demand. However, as markets began to price in a potential de-escalation amid negotiations and non-negotiations, investor attention started to shift toward more compelling value opportunities.
One area that stood out is quality small-cap stocks. These have started to outperform both their benchmark (MSCI World ex Australia Small Cap Index) and the broad equities (MSCI World ex Australia Index) as investors rotate into segments with stronger fundamentals and attractive valuations.
Chart 1: Global small companies fell further than large caps when the US / Iran conflict escalated
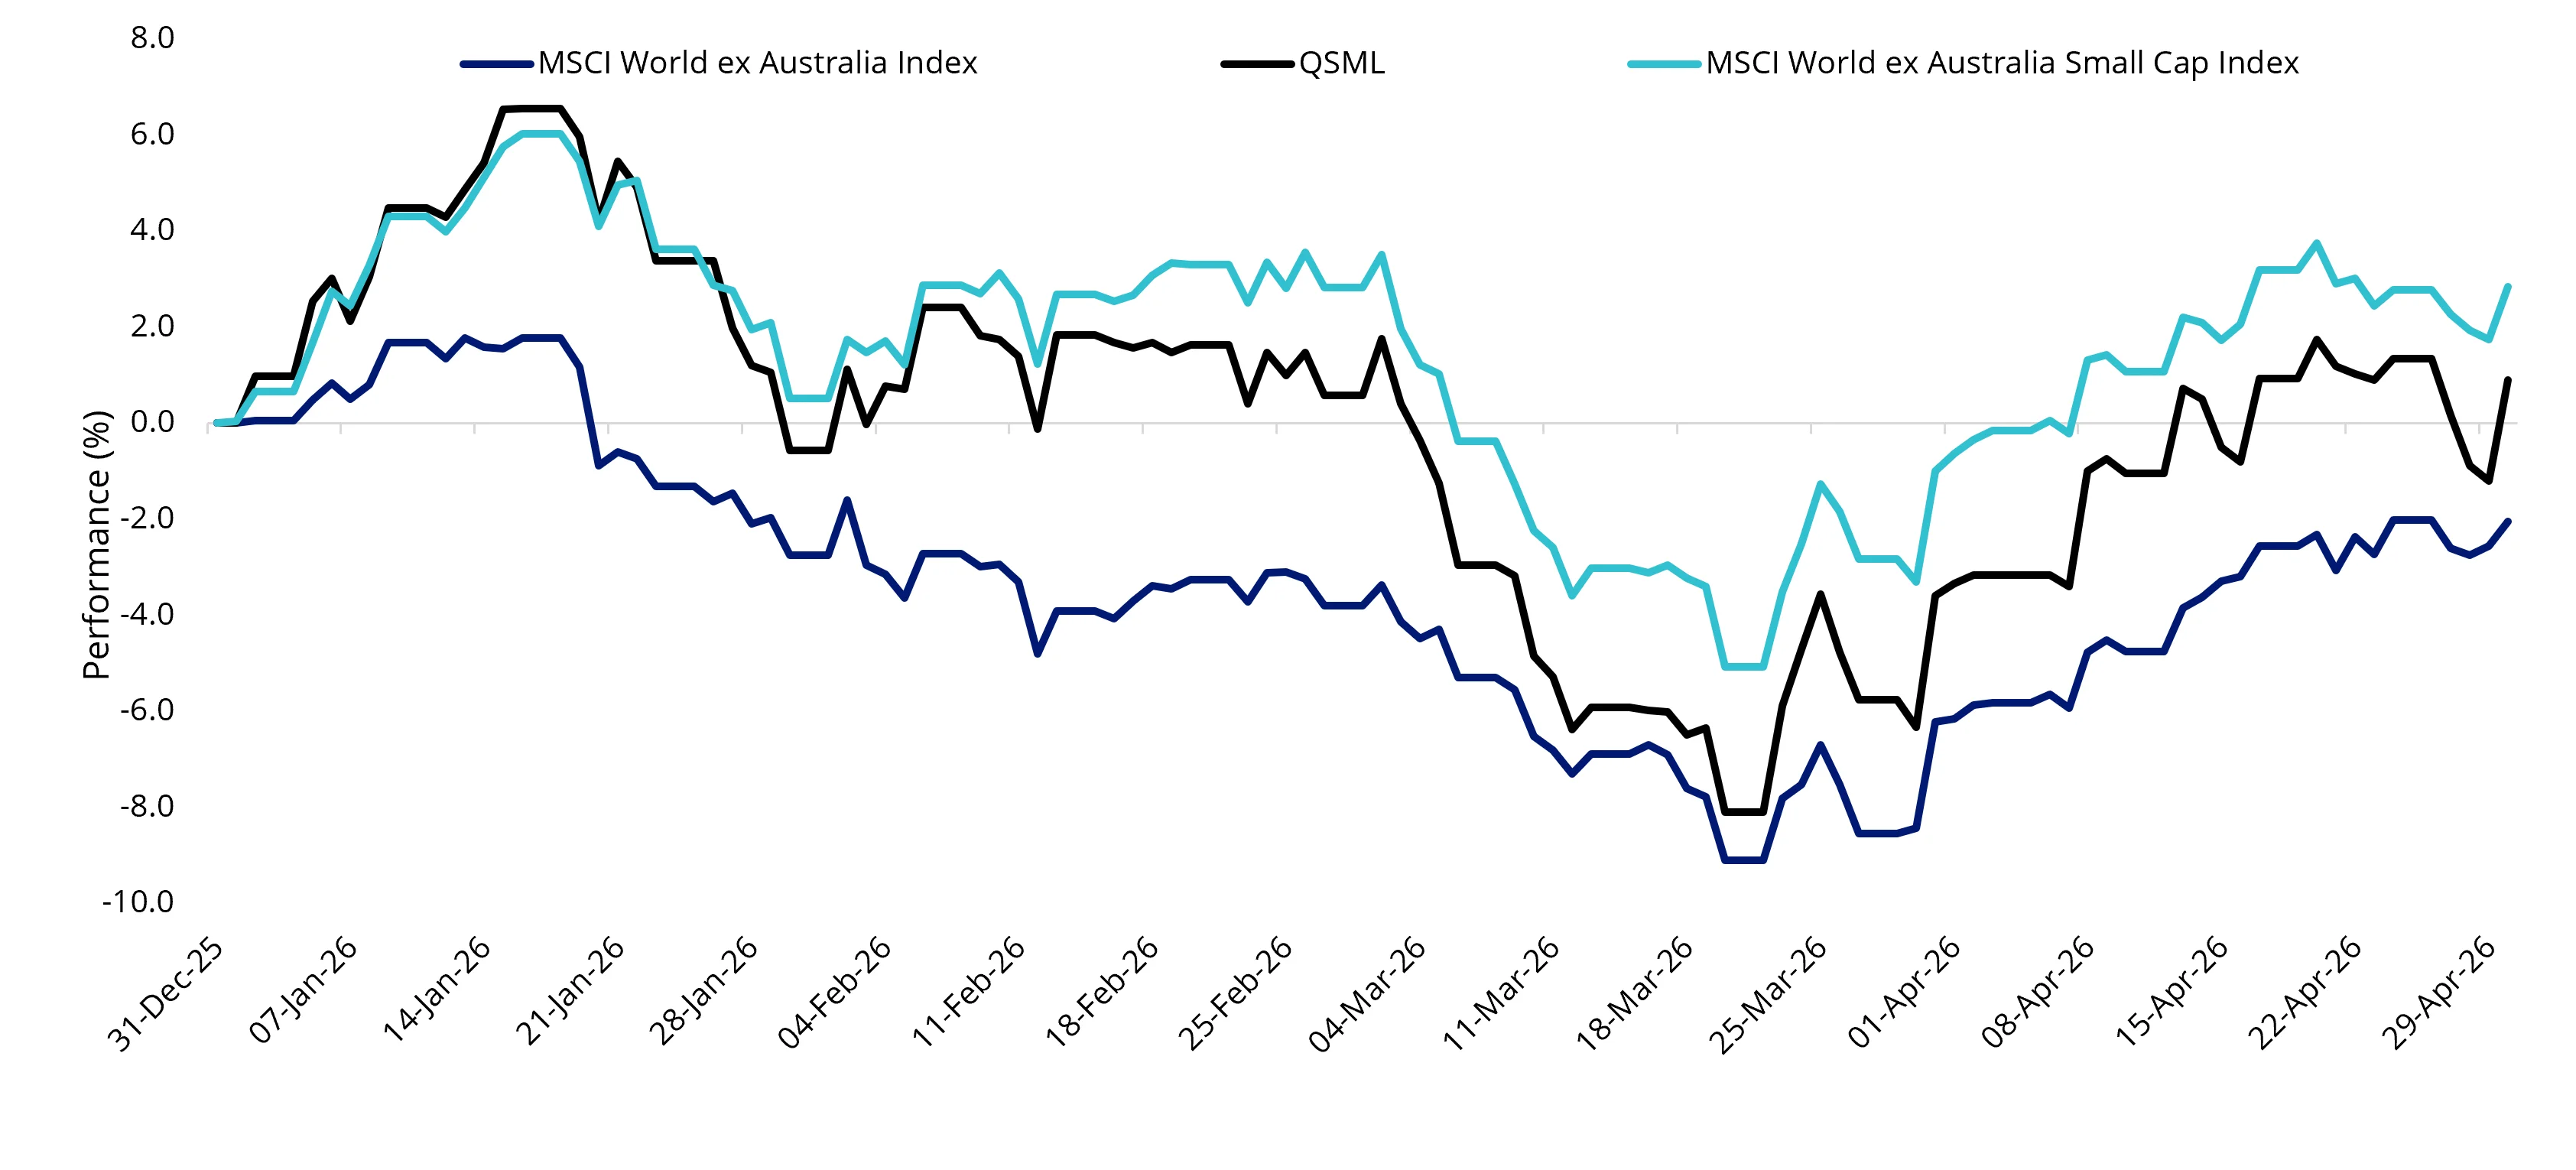
Source: Morningstar Direct, 31 December 2025 to 28 April 2026. Performance in Australian dollars. Results assume immediate reinvestment of all dividends and exclude costs associated with investing and taxes. You cannot invest directly in an index. Past performance is not indicative of future performance.
Within small companies, the ‘hope-to-the-end-of-the-conflict’ rally has led to recent outperformance of quality small companies. As of 30 April 2026, QSML has outperformed its benchmark MSCI World ex Australia Small Cap and large caps MSCI World ex Australia, by 88 basis points (bps) and 66 bps, respectively, since the 20 March low, as investors rotate into segments with strong fundamentals. (Noting that this is a short period and past performance is not an indicator of future performance. For a full performance history - click here)
With political uncertainty, geopolitical risks continuing, and inflation concerns not abating, higher-risk speculative assets could come under more pressure. If these market conditions persist, we could experience an uptick in market volatility in 2026, despite overall economic growth remaining strong. The US GDP growth outlook consensus forecast is around 2% for 2026 and 2027, with an AI-driven productivity boost potentially adding another 50 to 100 bps.
Chart 2: US GDP YoY% and forecast
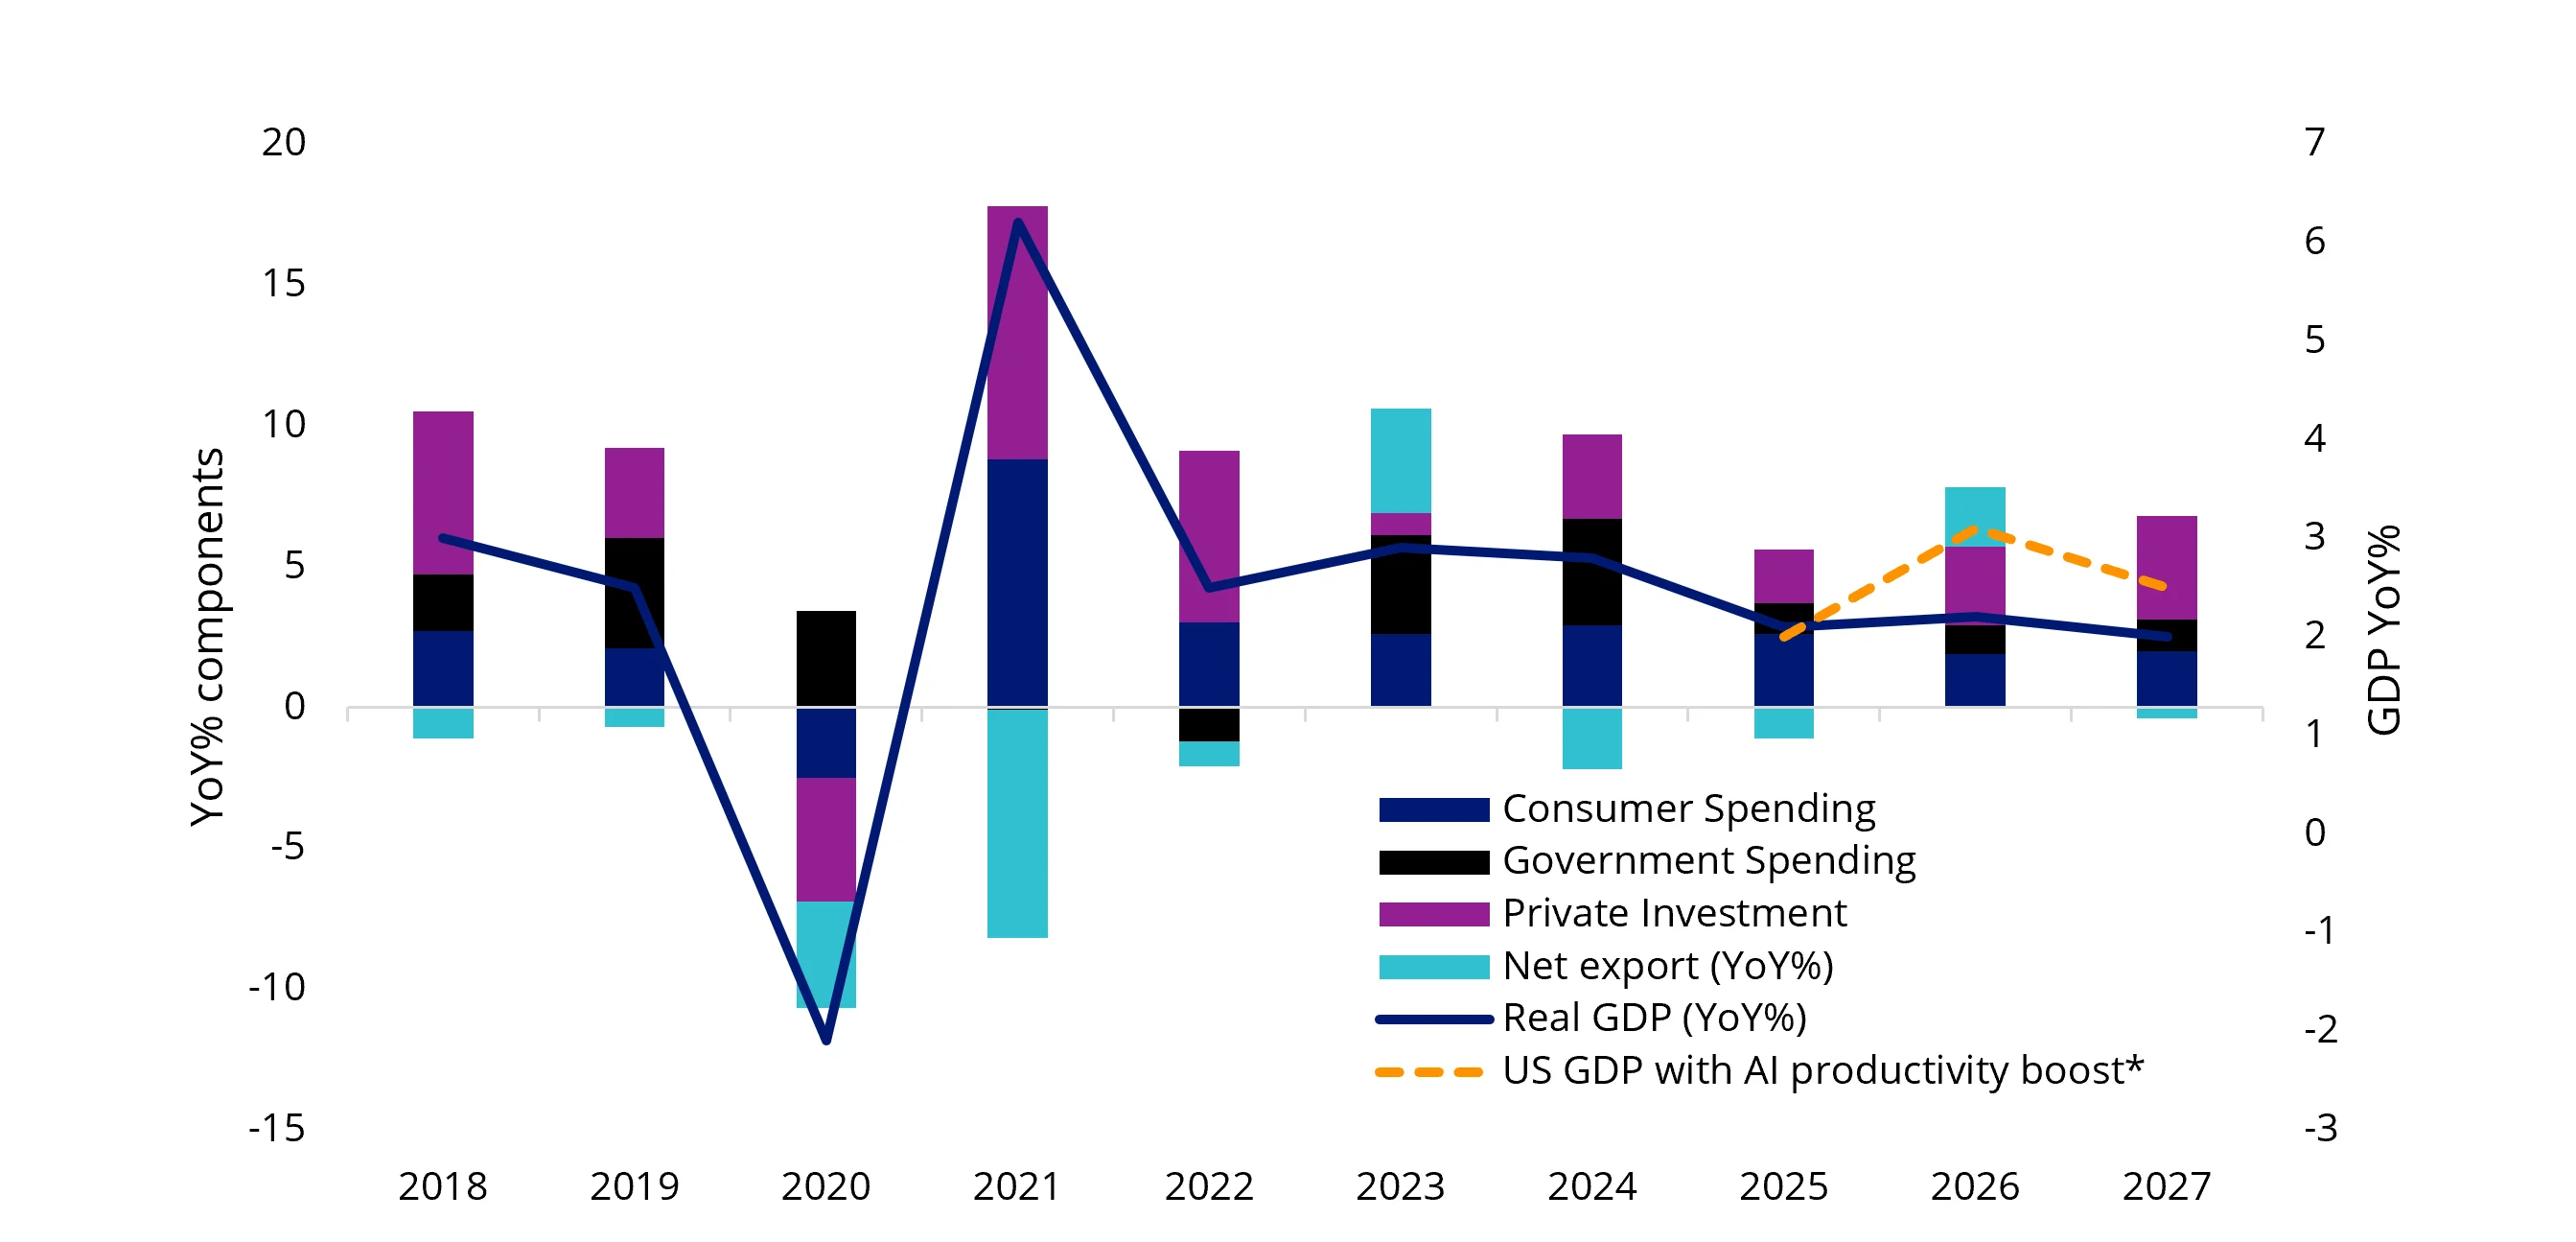
Source: VanEck. Bloomberg. 2025, 2026 and 2027 full year GDP growth based on street estimates. GDP growth with AI productivity boost was based on Morgan Stanley’s forecast.
This resilient growth trajectory bodes well for smaller companies in the market to harvest higher earnings growth.
Taking history as a guide, we believe this backdrop (potential volatility) bodes well for a quality rotation within the global small companies’ complex.
Chart 3: Quality small-cap companies have historically outperformed amid volatile times

Source: VanEck. Bloomberg. 31 December 2000 to 24 April 2026. Performance in Australian dollars. Results assume immediate reinvestment of all dividends and exclude costs associated with investing and taxes. You cannot invest directly in an index. Past performance is not indicative of future performance. Quality small companies is the MSCI World ex Australia Small Cap Quality 150 Index. Index performance is not illustrative of QSML performance.
Valuations for global quality small caps are reasonable/attractive by historical standards. Global small companies is one of the few asset classes where the price-to-12-month forward earnings is below the historical average. QSML relative to large caps is at a -8.3% discount to large caps, where the average is +7.3% relative to global large caps (MSCI World Index), with valuations at multi-year lows.
Chart 4: 12-Month Forward P/E: MSCI World ex AUS vs. Small Cap vs. QSML
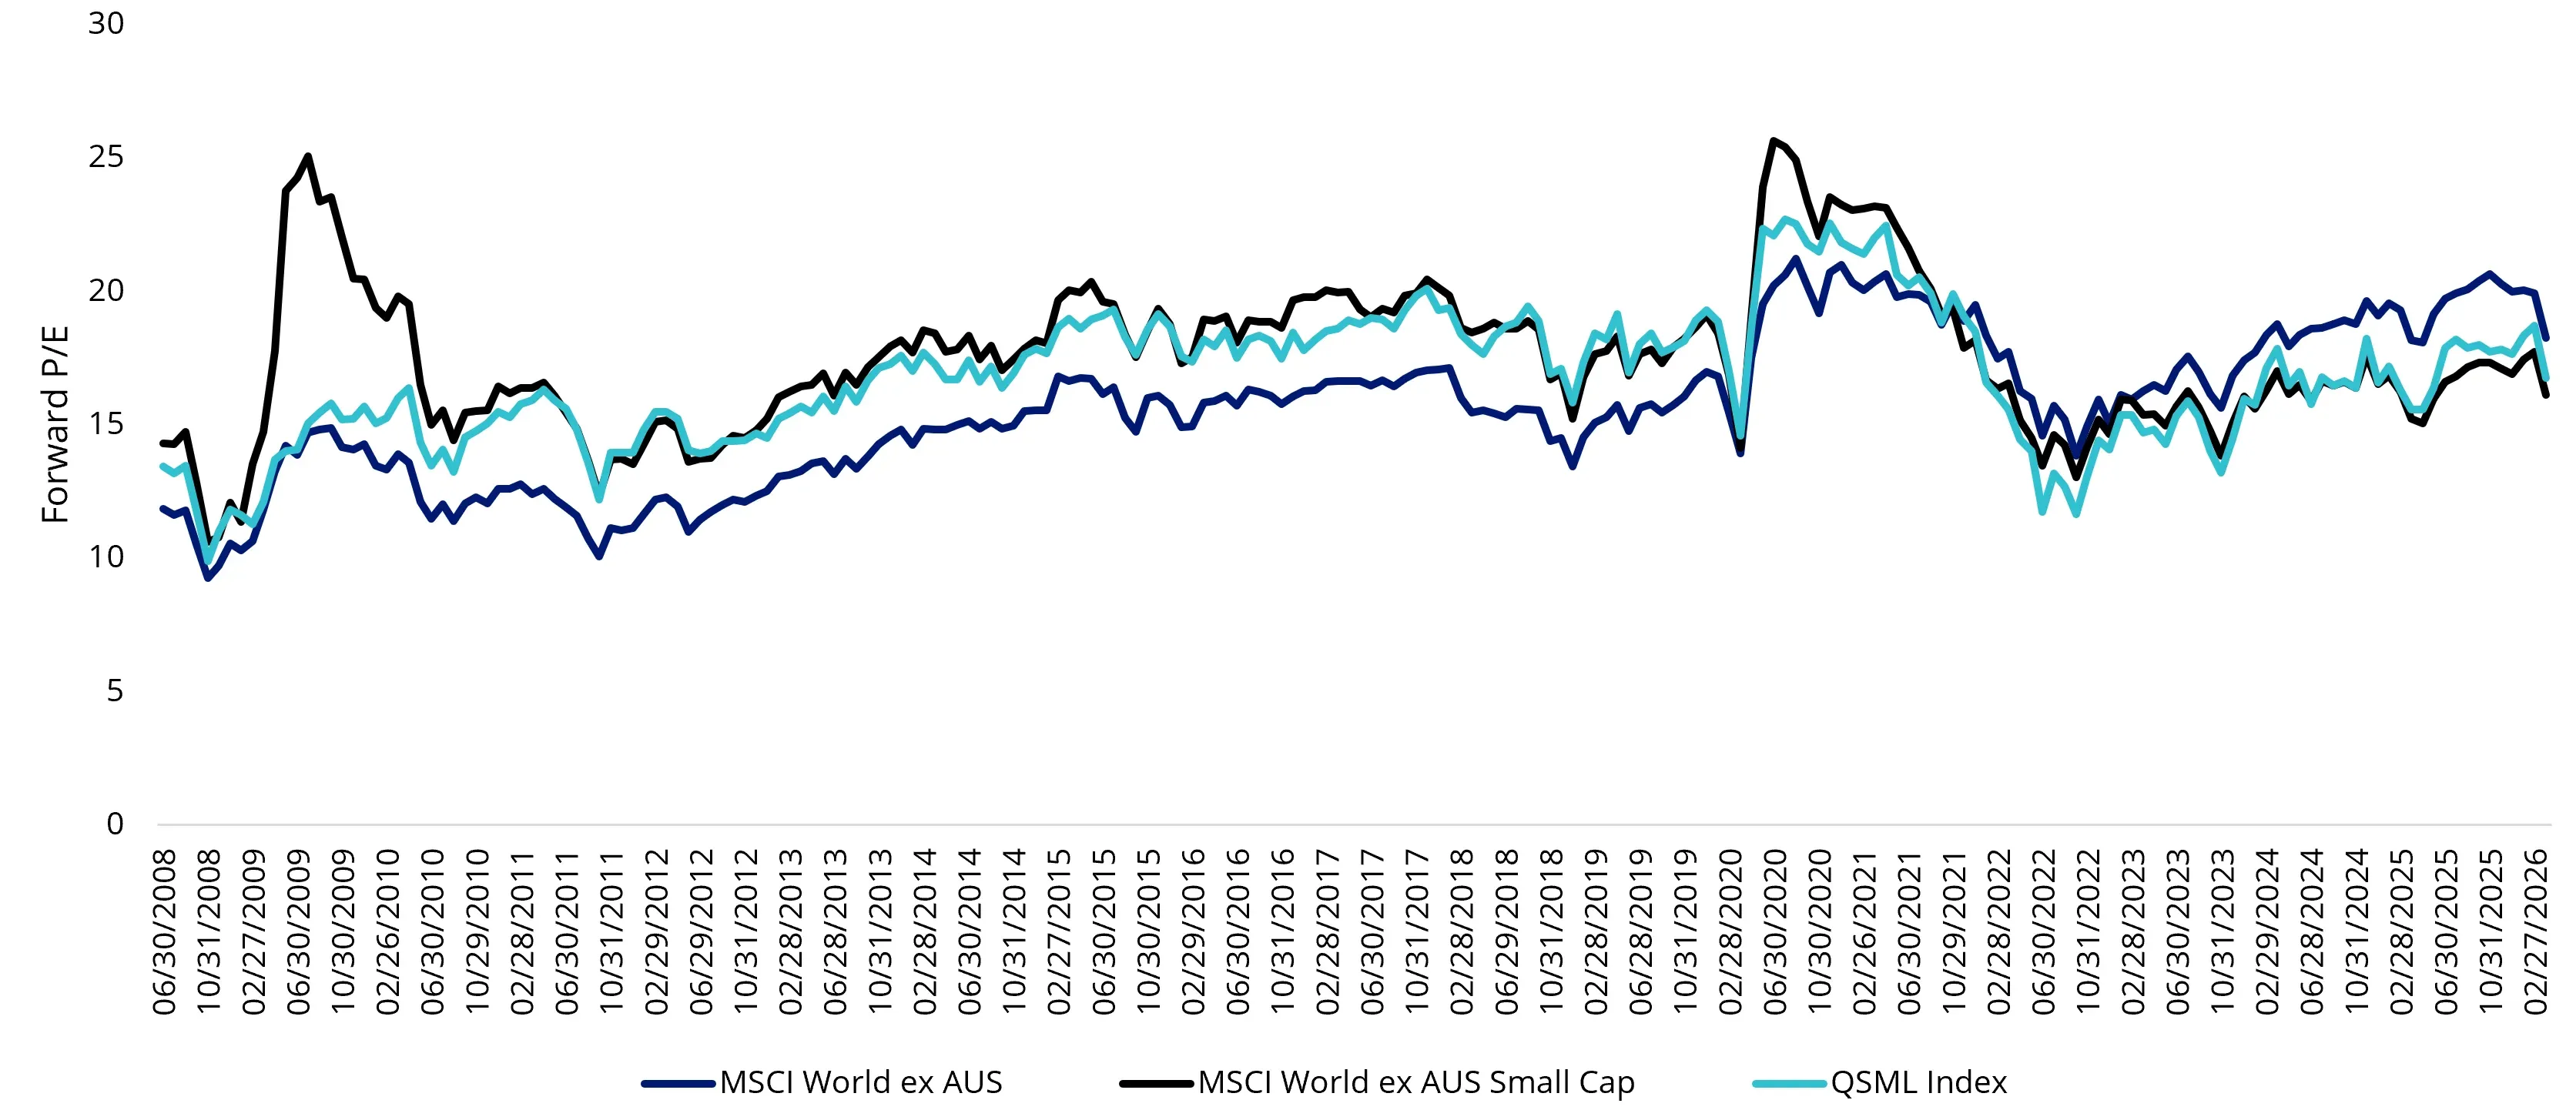
Source: VanEck. Bloomberg. 24 April 2026. Performance in Australian dollars. Results assume immediate reinvestment of all dividends and exclude costs associated with investing and taxes. You cannot invest directly in an index. Past performance is not indicative of future performance. QSML Index is MSCI World ex Australia Small Cap Quality 150 Index. Index performance is not illustrative of QSML performance.
Chart 5: QSML P/E Relative to MSCI World ex AUS (%)
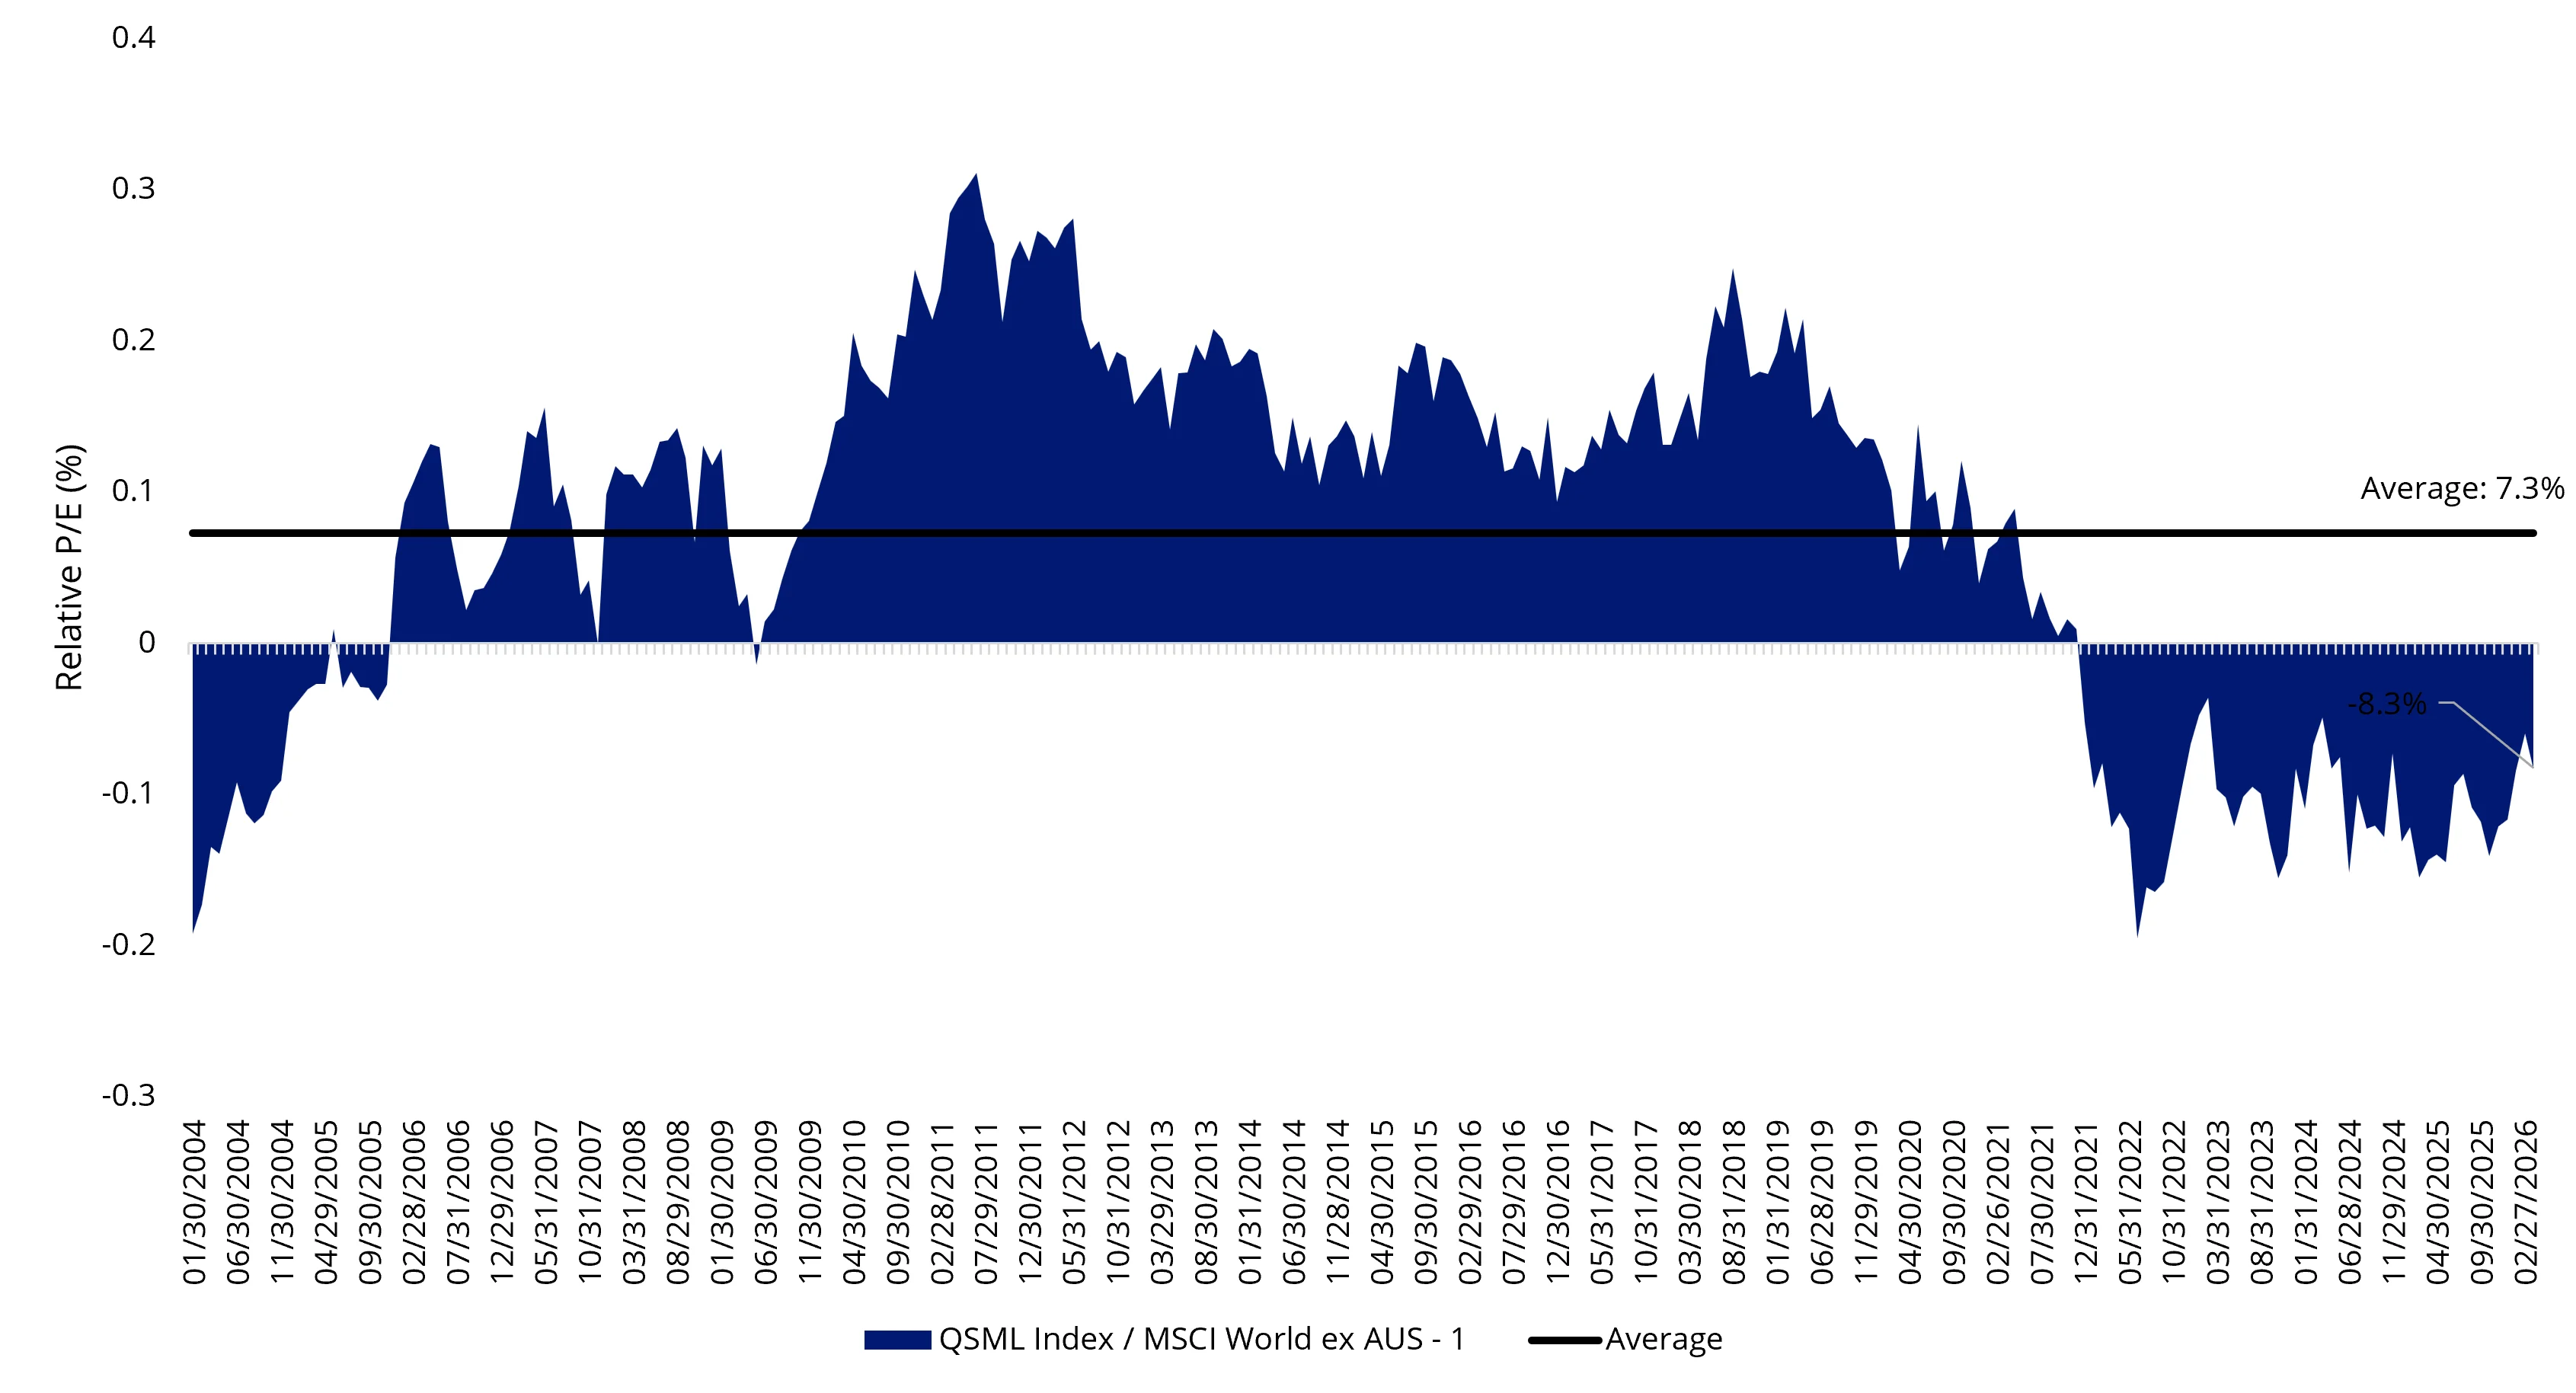
Source: Bloomberg, Z-score quantifies how many standard deviations valuations are different to the historical average. The graph above shows the average z-score by 12 month forward price to earnings, 12 month forward price to book, 12 month forward price to sales. QSML Index is MSCI World ex Australia Small Cap Quality 150 Index. Index performance is not illustrative of QSML performance.
Looking ahead
US manufacturing has shifted into expansionary territory with the ISM Index moving above 50, a backdrop that has historically favoured small caps as capex and production pick up, and we believe QSML is well positioned via its tilt toward industrials, with quality small caps having led during expansion phases (25.48% p.a. vs 21.03% for small caps and 15.20% for MSCI World) since the turn of the century.
Chart 6: Quality small caps have typically outperformed in an expansionary environment
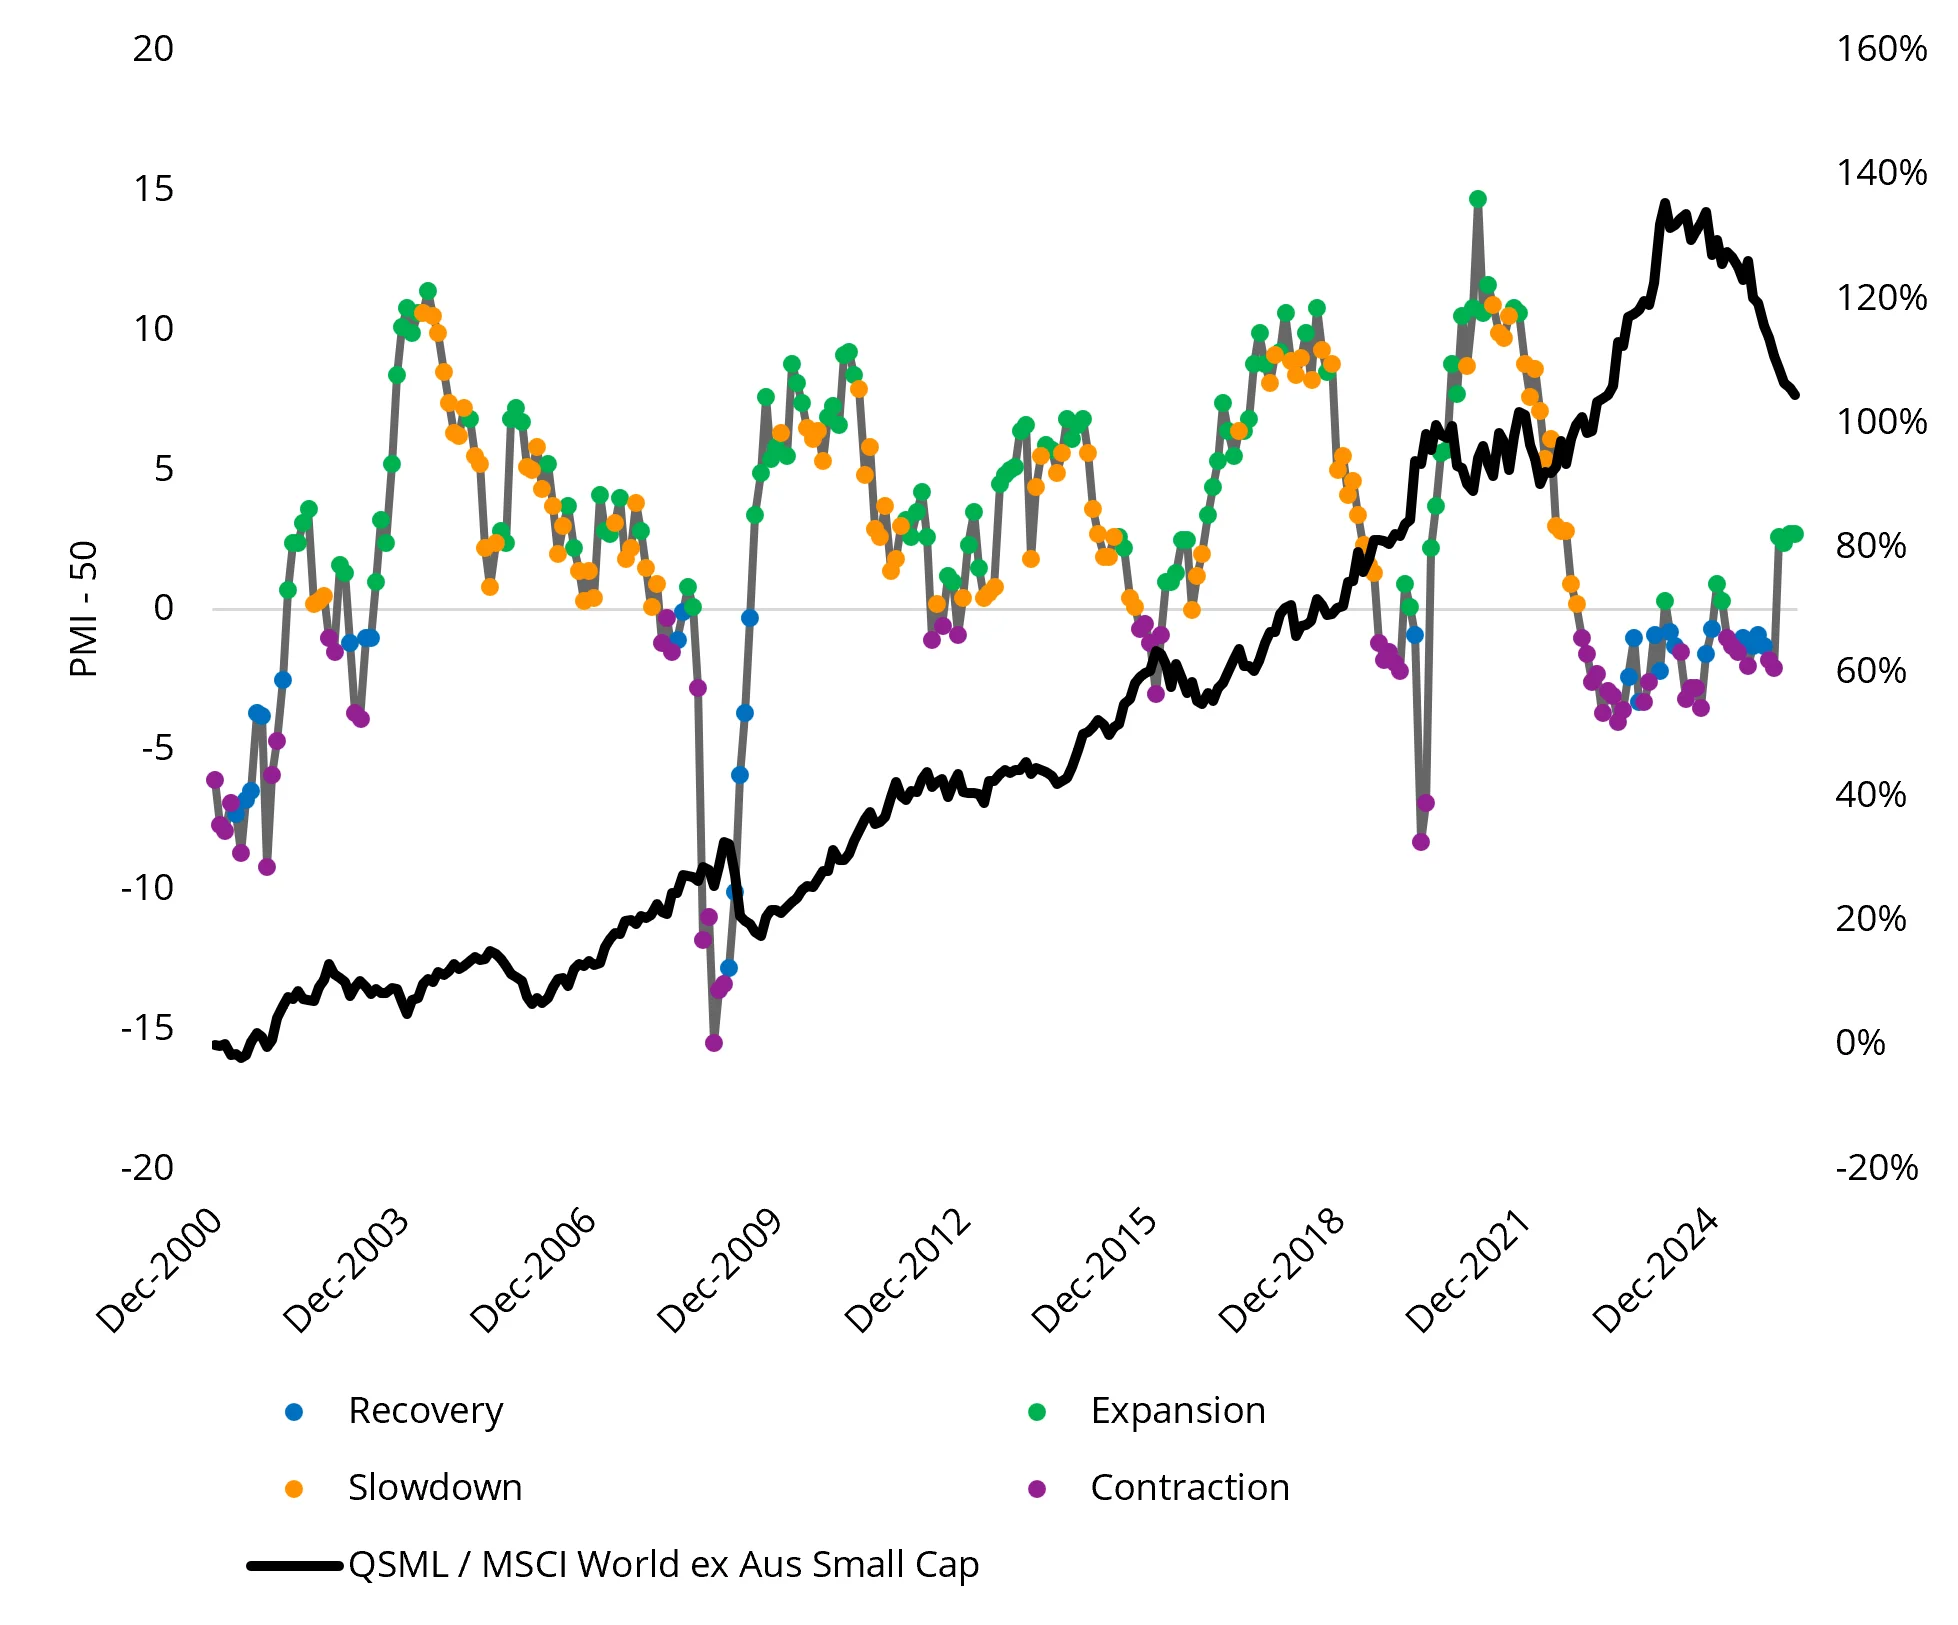
Source: MSCI, Bloomberg, ISM. Data as at 31 March 2026 due to data availability. QSML/MSCI World ex Aus Small Cap as of 28 April 2026. Results assume immediate reinvestment of all dividends and exclude costs associated with investing and taxes. You cannot invest directly in an index. Past performance is not indicative of future performance. QSML Index is MSCI World ex Australia Small Cap Quality 150 Index. Index performance is not illustrative of QSML performance.
Further, higher-for-longer oil prices and elevated tariffs could lift inflation concerns and growth uncertainty. This may see investors favour quality small caps due to their defensive characteristics, while chasing the growth premium offered by small caps.
European and Japanese equities have been disproportionately impacted since the onset of the Middle Eastern conflict, reflecting their reliance on imported energy. Unlike the US, which is a net energy exporter, these economies lack sufficient domestic production and remain dependent on imports. As a result, rising oil prices act as a headwind to growth, especially across industrial and consumer sectors.
However, in the event of a sustained resolution to the conflict, a normalisation in oil prices could provide meaningful support to smaller companies. Again, given QSML’s overweight positioning in industrials and consumer sectors relative to the large-cap universe, we believe this would represent a structural tailwind with a more pronounced benefit for small caps relative to large caps.
Thus far in the conflict, QSML’s overweight exposure to the US has helped cushion the impact of the oil shock, as the US remains largely self-sufficient in its energy supply, as aforementioned.
Table 1: Oil Import Dependency by Region
|
Region |
Production (mb/d) |
Consumption (mb/d) |
Net Imports (mb/d) |
Import Dependency % |
|
United States |
21.4 |
20.3 |
(1.1) |
0.0% |
|
EU-27 |
0.5 |
10.1 |
9.6 |
95.0% |
|
China |
4.3 |
16.2 |
11.9 |
73.5% |
|
India |
0.8 |
5.6 |
4.8 |
85.7% |
|
Japan |
0.0 |
3.3 |
3.3 |
100.0% |
|
Saudi Arabia |
10.6 |
3.2 |
(7.4) |
0.0% |
|
Russia |
10.8 |
3.5 |
(7.3) |
0.0% |
Source: United States: EIA (U.S. Energy Information Administration), 2024 annual data. Production includes crude oil, NGLs, renewables & refinery processing gain. EU-27: Eurostat & Energy Institute Statistical Review of World Energy 2024. EU production ~0.5 mb/d (ex Norway/UK), consumption ~10.1 mb/d. China, India, Japan, Saudi Arabia, Russia: Energy Institute Statistical Review of World Energy 2024 (formerly BP Statistical Review).
We think a rotation may be beginning, and global quality small caps could shine throughout the rest of 2026.
The VanEck MSCI International Small Companies Quality ETF (QSML), which we affectionately call ‘Baby QUAL’, harvests the Quality factor, like VanEck’s
International Quality ETF (QUAL), but selects its companies from the international small-cap universe.
Despite the prolonged US-Iran conflict keeping oil prices elevated, a strong start to Q1 US earnings season has insulated international quality small caps. As of 30 April 2026, QSML’s portfolio posted a 76.9% earnings beat rate and average 1-day post-earnings return of 0.86%, versus 73.38% and -0.35% for MSCI World.
As of 30 April 2026, QSML has outperformed its benchmark MSCI World ex Australia Small Cap and large caps MSCI World ex Australia, by 8 basis points (bps) and 66 bps, respectively, since the 20 March low, as investors rotate into segments with strong fundamentals. Noting, this is a very short period and is not indicative of future performance.
Key points of QSML:
- 150 of the world's highest quality small companies
Access a diversified portfolio containing some of the world's highest quality small companies based on key fundamentals including (i) high return on equity, (ii) earnings stability and (iii) low financial leverage.
- Outperformance potential in growing companies
Investments focusing on quality small companies that have delivered outperformance over the long term relative to other global small companies benchmarks and also relative to large- and mid-cap benchmarks.
- Diversified across countries, sectors and companies
Offering investors a portfolio of 150 companies across a range of geographies, sectors and economies.
Key risks: An investment in the ETF carries risks associated with ASX trading time differences, financial markets generally, individual company management, industry sectors, foreign currency, country or sector concentration, political, regulatory and tax risks, fund operations, liquidity and tracking an index. See the PDS for details.
QSML is likely to be appropriate for a consumer who is seeking capital growth, is intending to use the product as a core, minor or satellite allocation within a portfolio, has an investment timeframe of at least 5 years, and has a high risk/return profile.


Published: 11 May 2026
Any views expressed are opinions of the author at the time of writing and is not a recommendation to act.
VanEck Investments Limited (ACN 146 596 116 AFSL 416755) (VanEck) is the issuer and responsible entity of all VanEck exchange traded funds (Funds) trading on the ASX. This is general advice only and does not take into account any person’s financial objectives, situation or needs. The product disclosure statement (PDS) and the target market determination (TMD) for all Funds are available at vaneck.com.au. You should consider whether or not any Fund is appropriate for you. Investments in a Fund involve risks associated with financial markets. These risks vary depending on a Fund’s investment objective. Refer to the applicable PDS and TMD for more details on risks. Investment returns and capital are not guaranteed.
QSML is indexed to an MSCI index. QSML is not sponsored, endorsed or promoted by MSCI, and MSCI bears no liability with respect to QSML, or the MSCI World ex Australia Small Cap Quality 150 Index. The QSML PDS contains a more detailed description of the limited relationship MSCI has with VanEck and QSML.