The market is still dancing – but the tune may be changing
When Bruce Springsteen released Dancing in the Dark in 1984, the worst of the last extended stagflation era was finally fading into the rear-view mirror. Inflation had retreated from the double-digit levels that defined much of the previous decade, and policymakers were beginning to regain control of an economic problem that had frustrated them for years.
More than 40 years later, markets continue to find reasons for optimism. The S&P 500 is hovering near record highs, artificial intelligence has become the investment story of the decade, and investors are once again looking beyond the United States after years of concentration in a handful of mega-cap names.
But beneath the enthusiasm sits a more uncomfortable possibility: what if investors are preparing for the wrong future?
To answer that question, it helps to revisit the last time inflation and growth combined to create one of the most challenging investing environments in modern history.
The ghost of the 1970s
The 1970s were supposed to be a victory lap. After two decades of strong post-war growth and rising living standards, many policymakers believed they had learned how to manage the economic cycle. Instead, the collapse of the Bretton Woods system and two major oil shocks sent energy prices soaring, with oil prices roughly quadrupling after the 1973 embargo and more than doubling again following the 1979 Iranian Revolution.
The result was an extended period of stagflation: a rare and uncomfortable combination of high inflation and weak economic growth.
Most investors are familiar with recessions, which have historically been associated with weaker demand, lower inflation and falling interest rates. But unlike a typical economic slowdown, a stagflation environment behaves differently. The table below highlights some of the key distinctions.
Table 1: How stagflation differs from a recession
|
Aspect |
Recession |
Stagflation |
|
Growth |
Economic activity contracts |
Economy continues growing slowly or stalls |
|
Inflation |
Usually falls as demand weakens |
Remains elevated despite weaker growth |
|
Interest rates |
Have historically fallen as central banks respond to weaker growth |
Have historically remained higher as inflation limits policy flexibility |
|
Policymakers |
Can focus primarily on supporting growth |
Must balance supporting growth against controlling inflation |
|
Investors |
Growth becomes the primary concern |
Growth and inflation become competing risks |
Source: For illustrative purposes only.
What makes stagflation so challenging is that it combines two problems that do not normally occur together. In a typical slowdown, weaker demand helps bring inflation down. In a typical inflation scare, strong demand is often part of the problem. Stagflation breaks that relationship, leaving policymakers trying to solve two problems at once.
The chart below shows what that looked like during the 1970s, the last major stagflationary period in developed economies. Inflation remained elevated even as growth weakened, creating one of the most difficult economic backdrops of the post-war era.
Chart 1: United States inflation vs real GDP growth (1972-1983) and Chart 2: Australia inflation vs real GDP growth (1972-1983)

Source: Bloomberg, VanEck. Data spans December 1972 to December 1983.
For investors, the lesson was brutal: shares struggled to keep pace with inflation, bonds offered little refuge and diversification did not feel particularly comforting. There were no easy answers then, which is why investors still pay attention whenever stagflation re-enters the conversation. The obvious question is: why now?
Extended stagflation 2.0?
While nobody is suggesting Australia will relive the 1970s experience exactly, some familiar ingredients are reappearing.
Inflation has fallen from its post-pandemic peak, but services inflation remains stubborn and renewed energy price pressures has seen inflation accelerate recently. At the same time, growth is becoming harder to find. Australia's economy is still expanding, but per-capita growth has been weak, productivity growth has disappointed and consumers remain under pressure from higher borrowing and living costs.
Chart 2: Australian inflation versus per-capita GDP growth
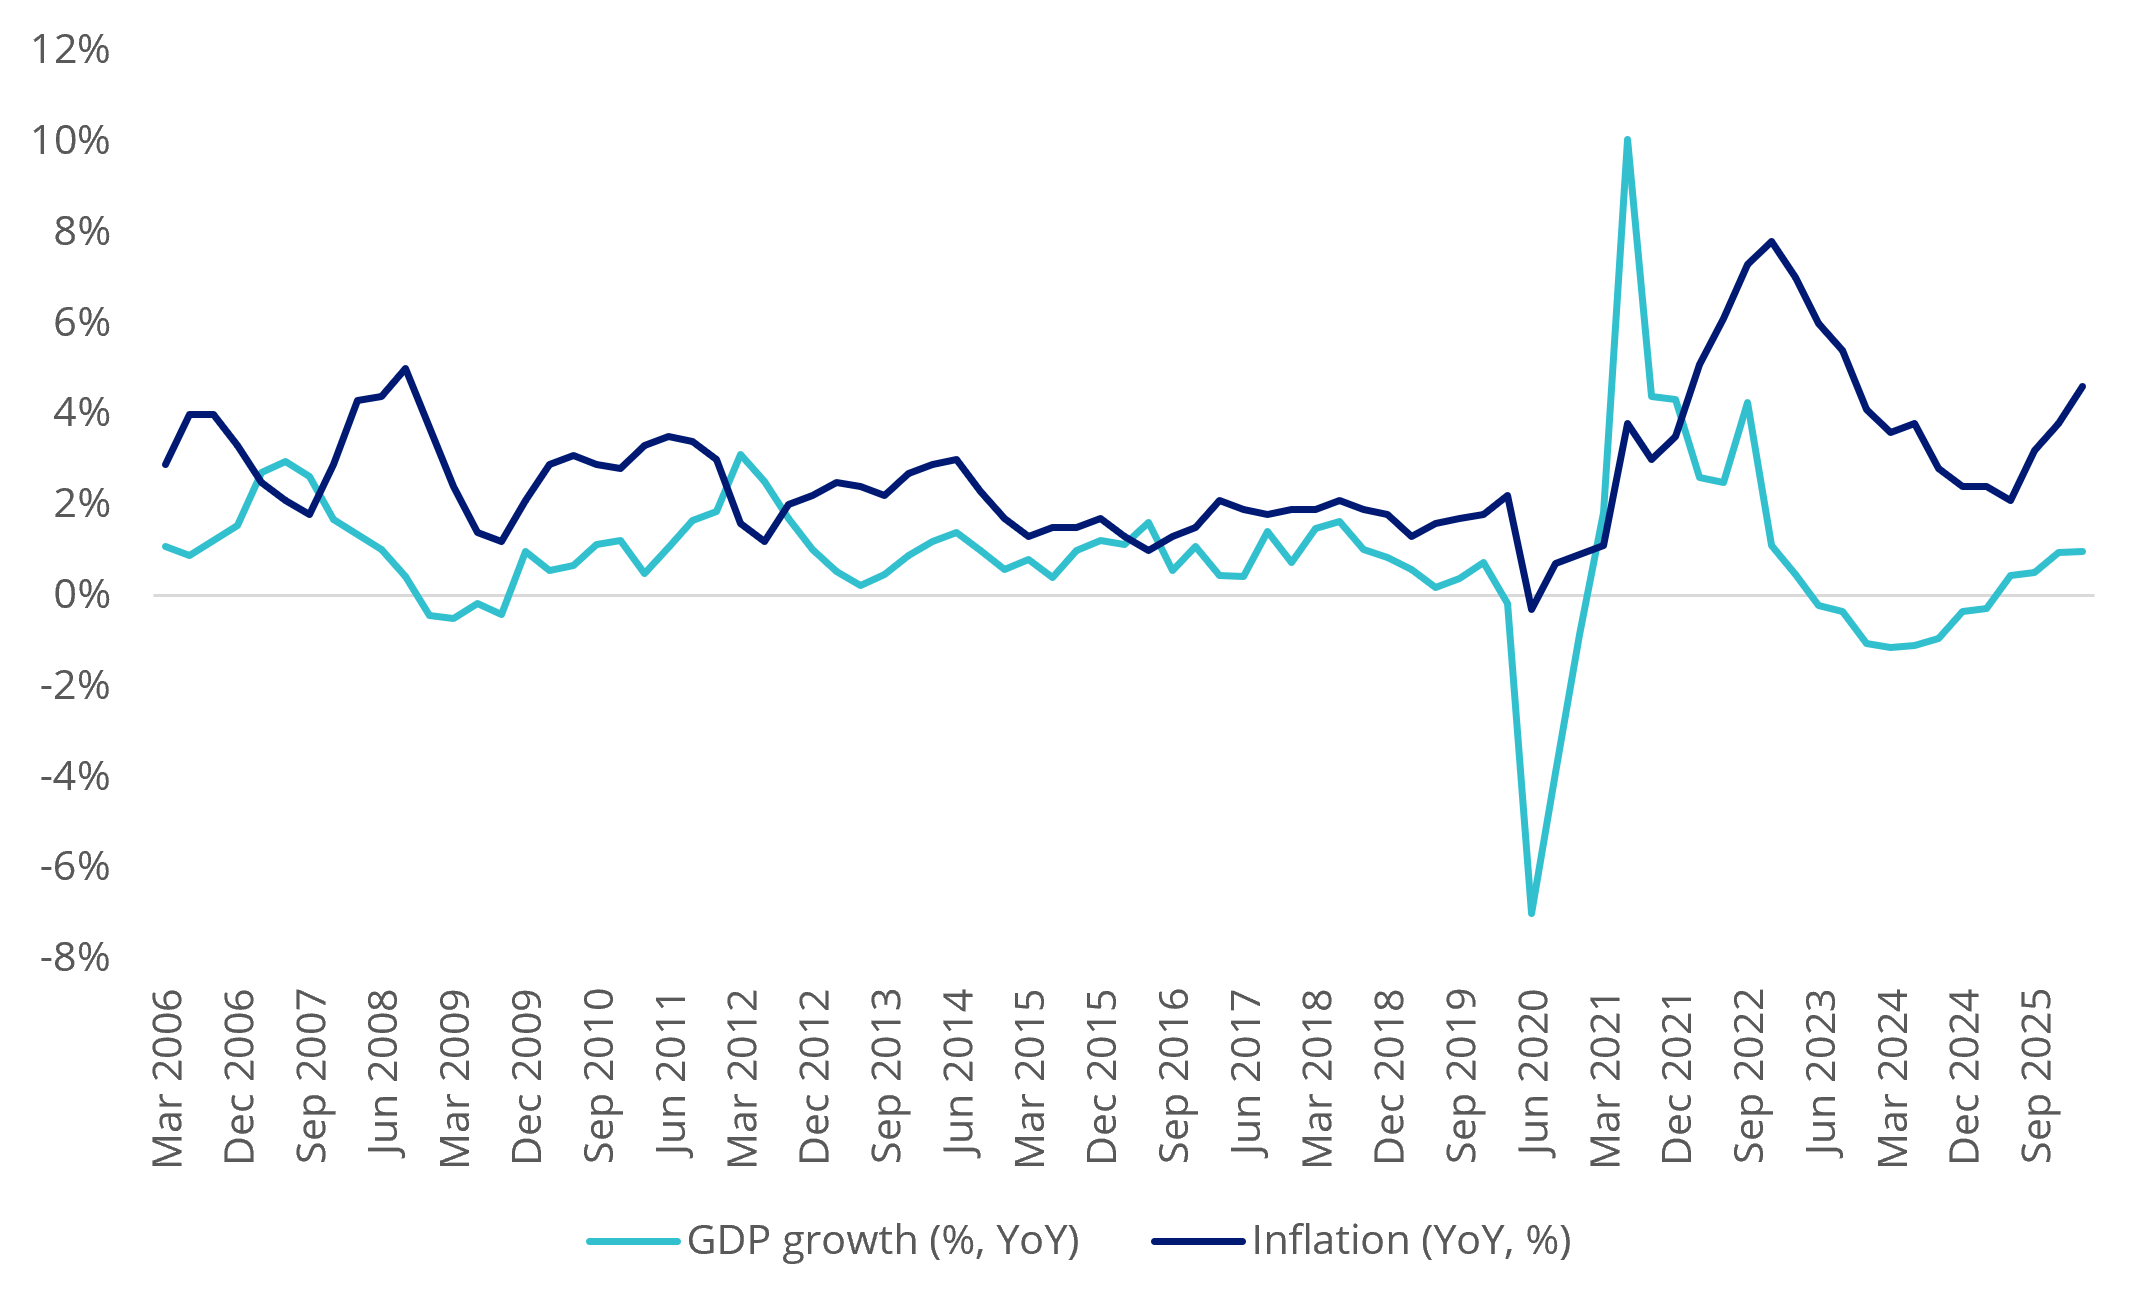
Source: ABS, RBA, VanEck. Data spans March quarter 2006 to March quarter 2026.
While unemployment remains low by historical standards, wage growth in Australia is proving more resilient than many expected and labour shortages persist across parts of the economy. The Fair Work Commission's recent decision to award wage increases of 4.75% to around 2.7 million workers, alongside a near 6% increase in the national minimum wage, is welcome news for households. But without stronger productivity, higher wage growth can make inflation harder to contain. At the same time, consumers remain under pressure. Westpac's Consumer Sentiment Index recently fell to levels historically associated with significant household pessimism.
Similar themes are emerging overseas. Inflation in the US has proven stickier than many expected, while the recent May US labour force report highlighted ongoing strength in the jobs market. Combined with geopolitical tensions that continue to pose risks to energy markets, these signals suggest inflation may remain elevated even as growth becomes harder to find.
So how should investors position for stagflation?
The challenge for investors is that most portfolios have been built during a period that looked very different from the 1970s. Falling inflation, declining interest rates and globalisation generally rewarded growth assets and encouraged investors to pay a premium for future earnings.
History suggests a stagflationary environment rewards different characteristics.
During periods of elevated inflation and higher interest rates, investors have often favoured assets with tangible value and stronger pricing power. Gold has historically benefited from inflationary pressures and economic uncertainty. We saw this after the oil shock in 1973 and the stagflationary environment that followed.
Chart 3: Gold and equity performance in the decade after the 1970s energy crisis
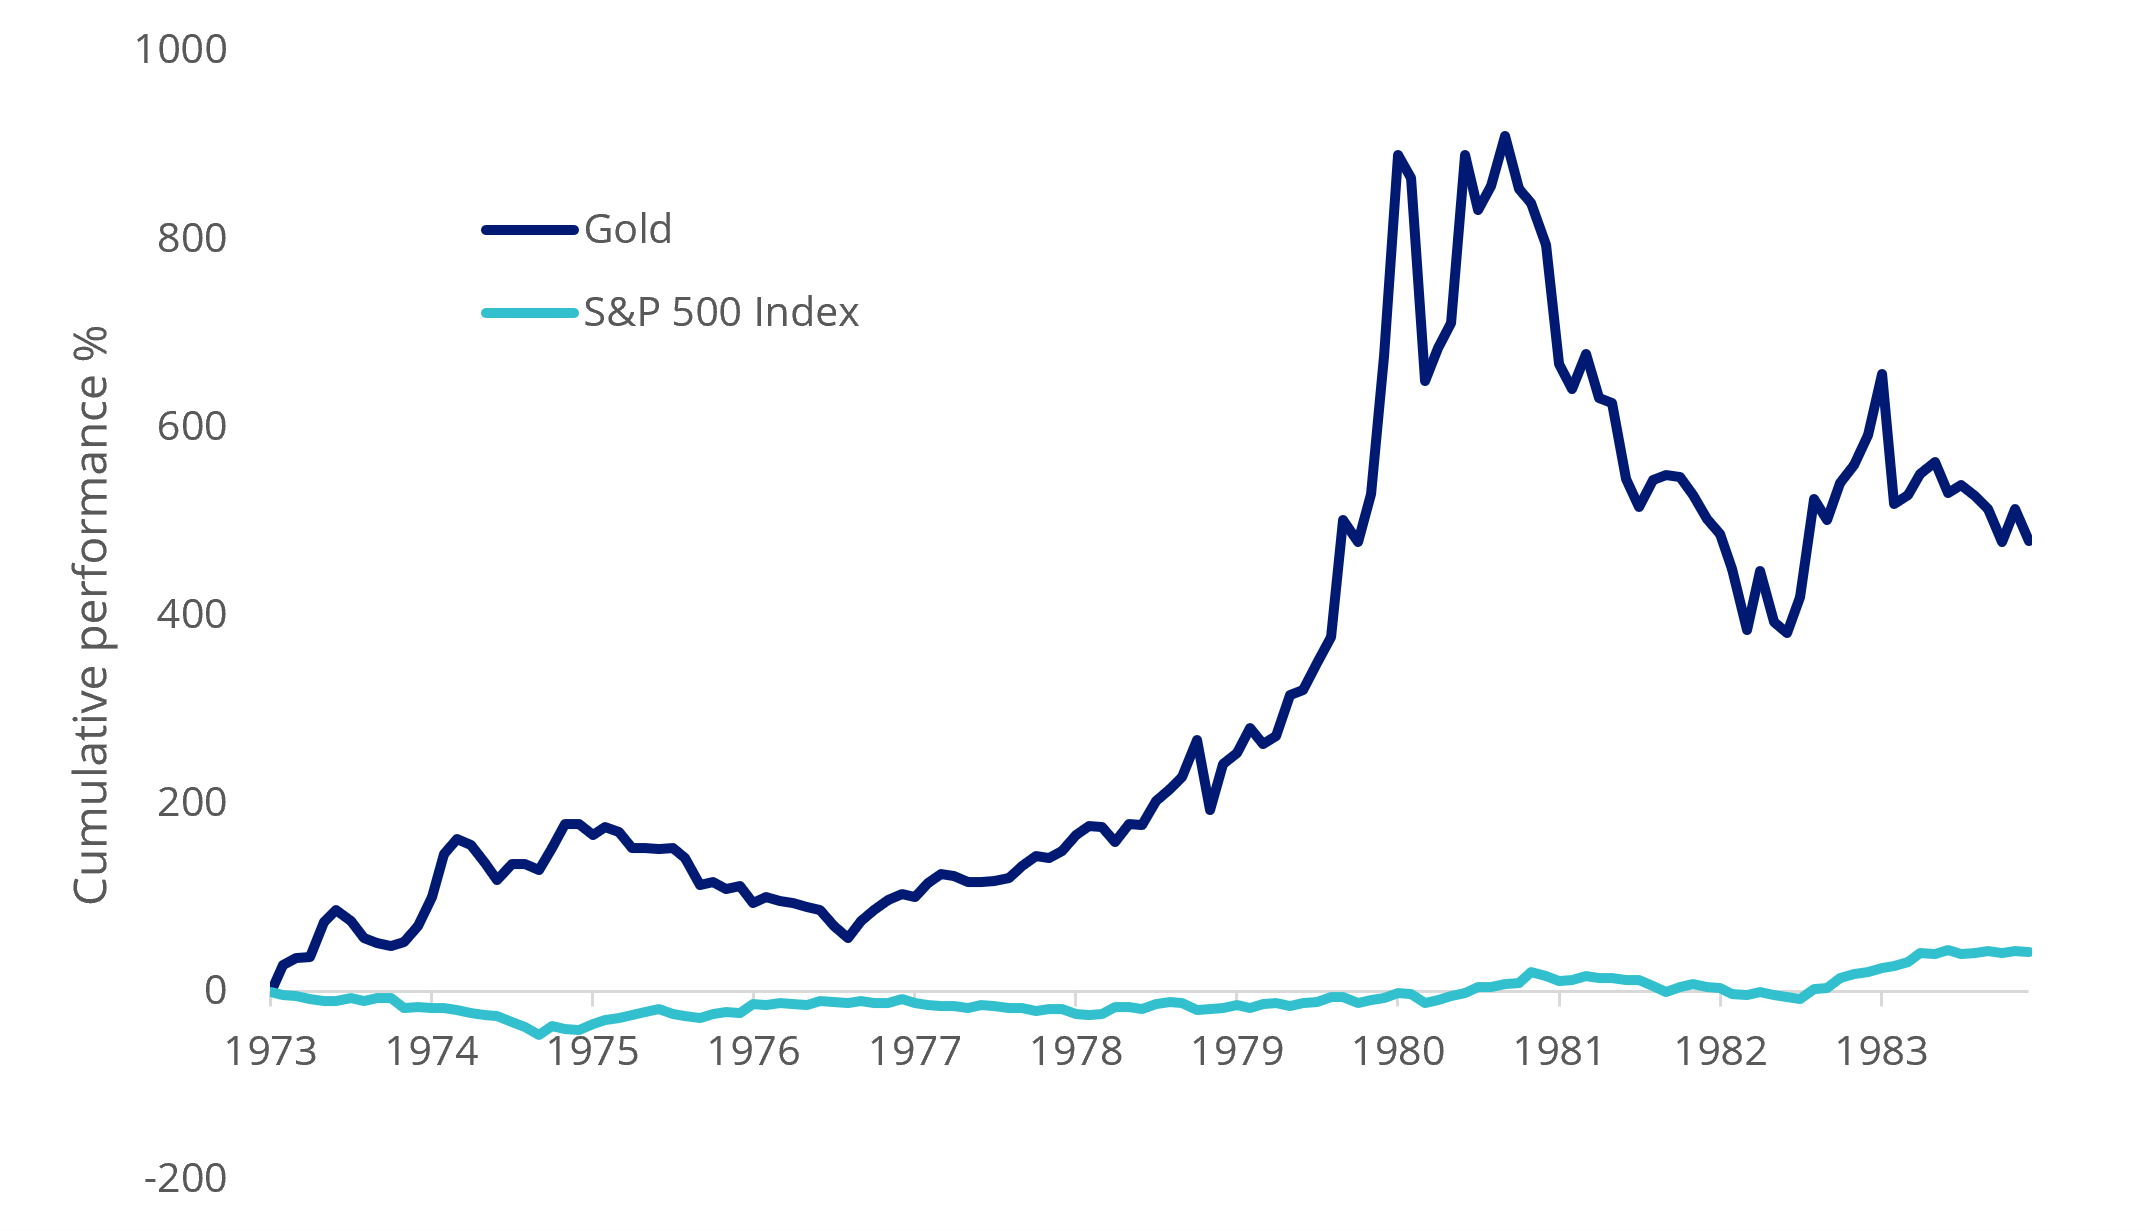
Source: Bloomberg, 1 Jan 1973 to 31 December 1983. Performance in US dollars. Gold is LBMA PM Gold Price. Past performance is not indicative of future performance.
Value-oriented equities (and gold) have often performed relatively well when higher rates reduce the appeal of long-duration growth assets. Chart 4 illustrates how value equities have performed relative to broader global equities across different interest-rate environments. The chart shows that when rates are higher, as they are during a stagflationary environment, both value and gold outperform the broad international equities market.
Chart 4: Value and gold investments have historically performed strongly during higher interest rate environments
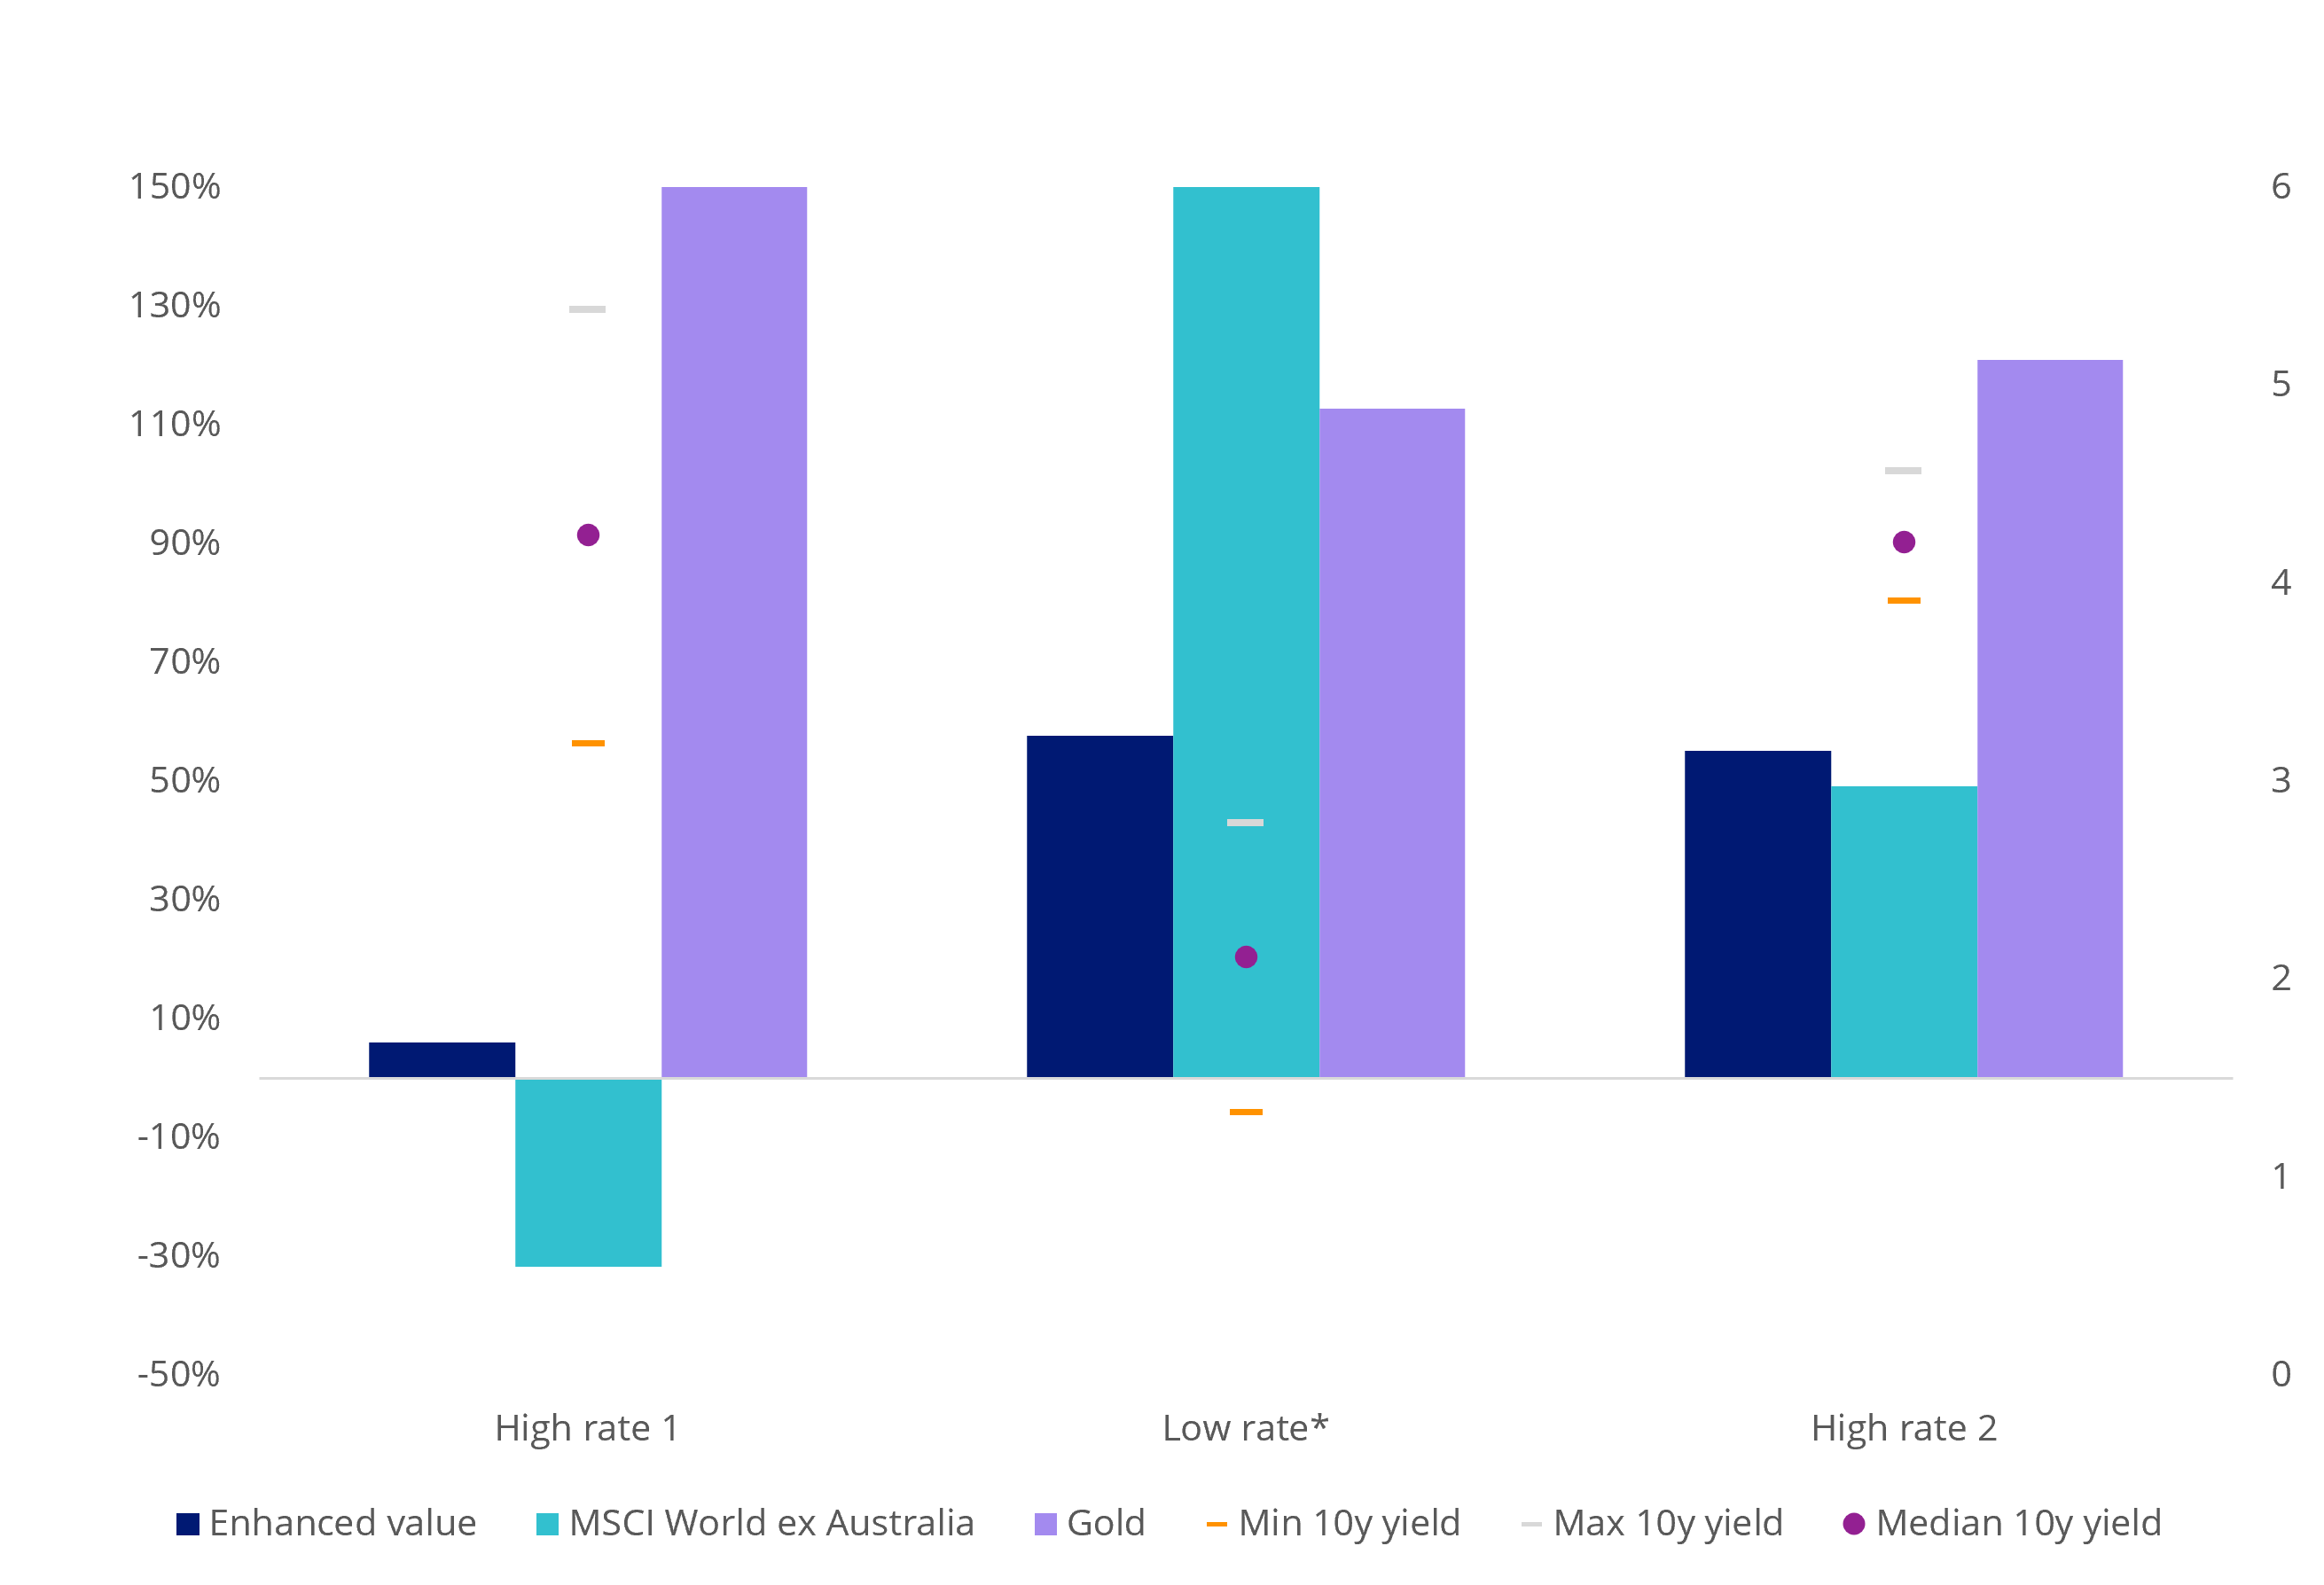
Source: Bloomberg, VanEck. ‘High rate 1’ is 31 December 1999 to 30 June 2011, ‘Low rate’ is 1 July 2011 to 29 July 2023, ‘High rate 2’ is 1 August 2023 to 31 December 2025. Enhanced Value is the MSCI World ex Australia Enhanced Value Top 250 Select Index. Gold is LBMA PM Gold Price. Returns converted to Australian dollars. Past performance is not indicative of future performance. You cannot invest in an index.
# High rate 1 for Gold is 216.5%
* low rate value for MSCI World ex Australia is 313.9%
The table below highlights several characteristics that have historically demonstrated resilience during these environments, together with ETF examples that may provide exposure to those themes.
Table 2: Characteristics that have historically demonstrated resilience during stagflation
|
Characteristic |
Why it may matter |
Example ETF |
|
Inflation protection |
Gold has historically acted as a hedge against inflation and geopolitical uncertainty. |
VanEck Gold Bullion ETF (NUGG) |
|
Valuation discipline |
Investors may become less willing to pay high multiples for uncertain future growth and prefer companies with high cash flows. |
VanEck MSCI International Value ETF (VLUE)
|
|
Real assets |
Infrastructure can benefit from inflation-linked revenues and essential demand. |
VanEck FTSE Global Infrastructure (Hedged) ETF (IFRA)
|
Past performance is not indicative of future performance.
When the music changes
Our current view is not that investors should become bearish. Rather, portfolios should be built with a wider range of potential outcomes in mind. A more resilient portfolio may help investors navigate an environment where growth and inflation remain competing risks for longer than markets currently expect.
Stagflation may not return in the form investors remember from the 1970s. But enough of the conditions that once contributed to it are beginning to re-emerge that the possibility can no longer be dismissed out of hand. Markets will keep moving and investors will keep dancing. The question is whether they can clearly see the room around them.
Key risks
An investment in any of the funds may carry risks associated with: ASX trading time differences, financial markets generally, individual company management, industry sectors, foreign currency, country or sector concentration, hedging, political, regulatory and tax risks, fund operations and tracking an index. While it is not possible to identify every risk relevant to your investment, we have provided details of the risks that may affect an investment in the relevant product disclosure statement and the target market determination.


Published: 12 June 2026
Any views expressed are opinions of the author at the time of writing and is not a recommendation to act.
VanEck Investments Limited (ACN 146 596 116 AFSL 416755) (VanEck) is the issuer and responsible entity of all VanEck exchange traded funds (Funds) trading on the ASX. This information is general in nature and not personal advice, it does not take into account any person’s financial objectives, situation or needs. You should consider whether or not an investment in any Fund is appropriate for you. Investments in a Fund involve risks associated with financial markets. These risks vary depending on a Fund’s investment objective. Refer to the applicable product disclosure statement (PDS) and target market determination (TMD) available at vaneck.com.au for more details. Investment returns and capital are not guaranteed.