The exceptionalism thesis that now has legs


Global bond markets have been flashing red, with the US 10-year yield hitting highs not seen since June 2007. But the headline “bond yields push higher” narrative masks an important divergence between emerging economies and developed economies.
The case for EM exceptionalism
For some time, bond market investors have been underpricing policy and macroeconomic risks in developed markets. In our view, this mispricing is now being corrected in a painful way.
At the same time, the EM story is no longer a simple read through developed economies’ policy and market moves. Solid fundamentals combined with independent and orthodox policymaking leave plenty of room for country-specific divergence. This development is what we would call the ‘EM Exceptionalism’ thesis, and right now, it has legs.
The chart below shows that the aggregate yield of emerging market bonds has moved higher in 2026, largely reflecting inflation risks tied to the protracted Middle East conflict and the resulting energy shock. However, it remains far from the previous peaks.
Chart 1: Emerging market vs developed market bonds’ yields to maturity since 2005
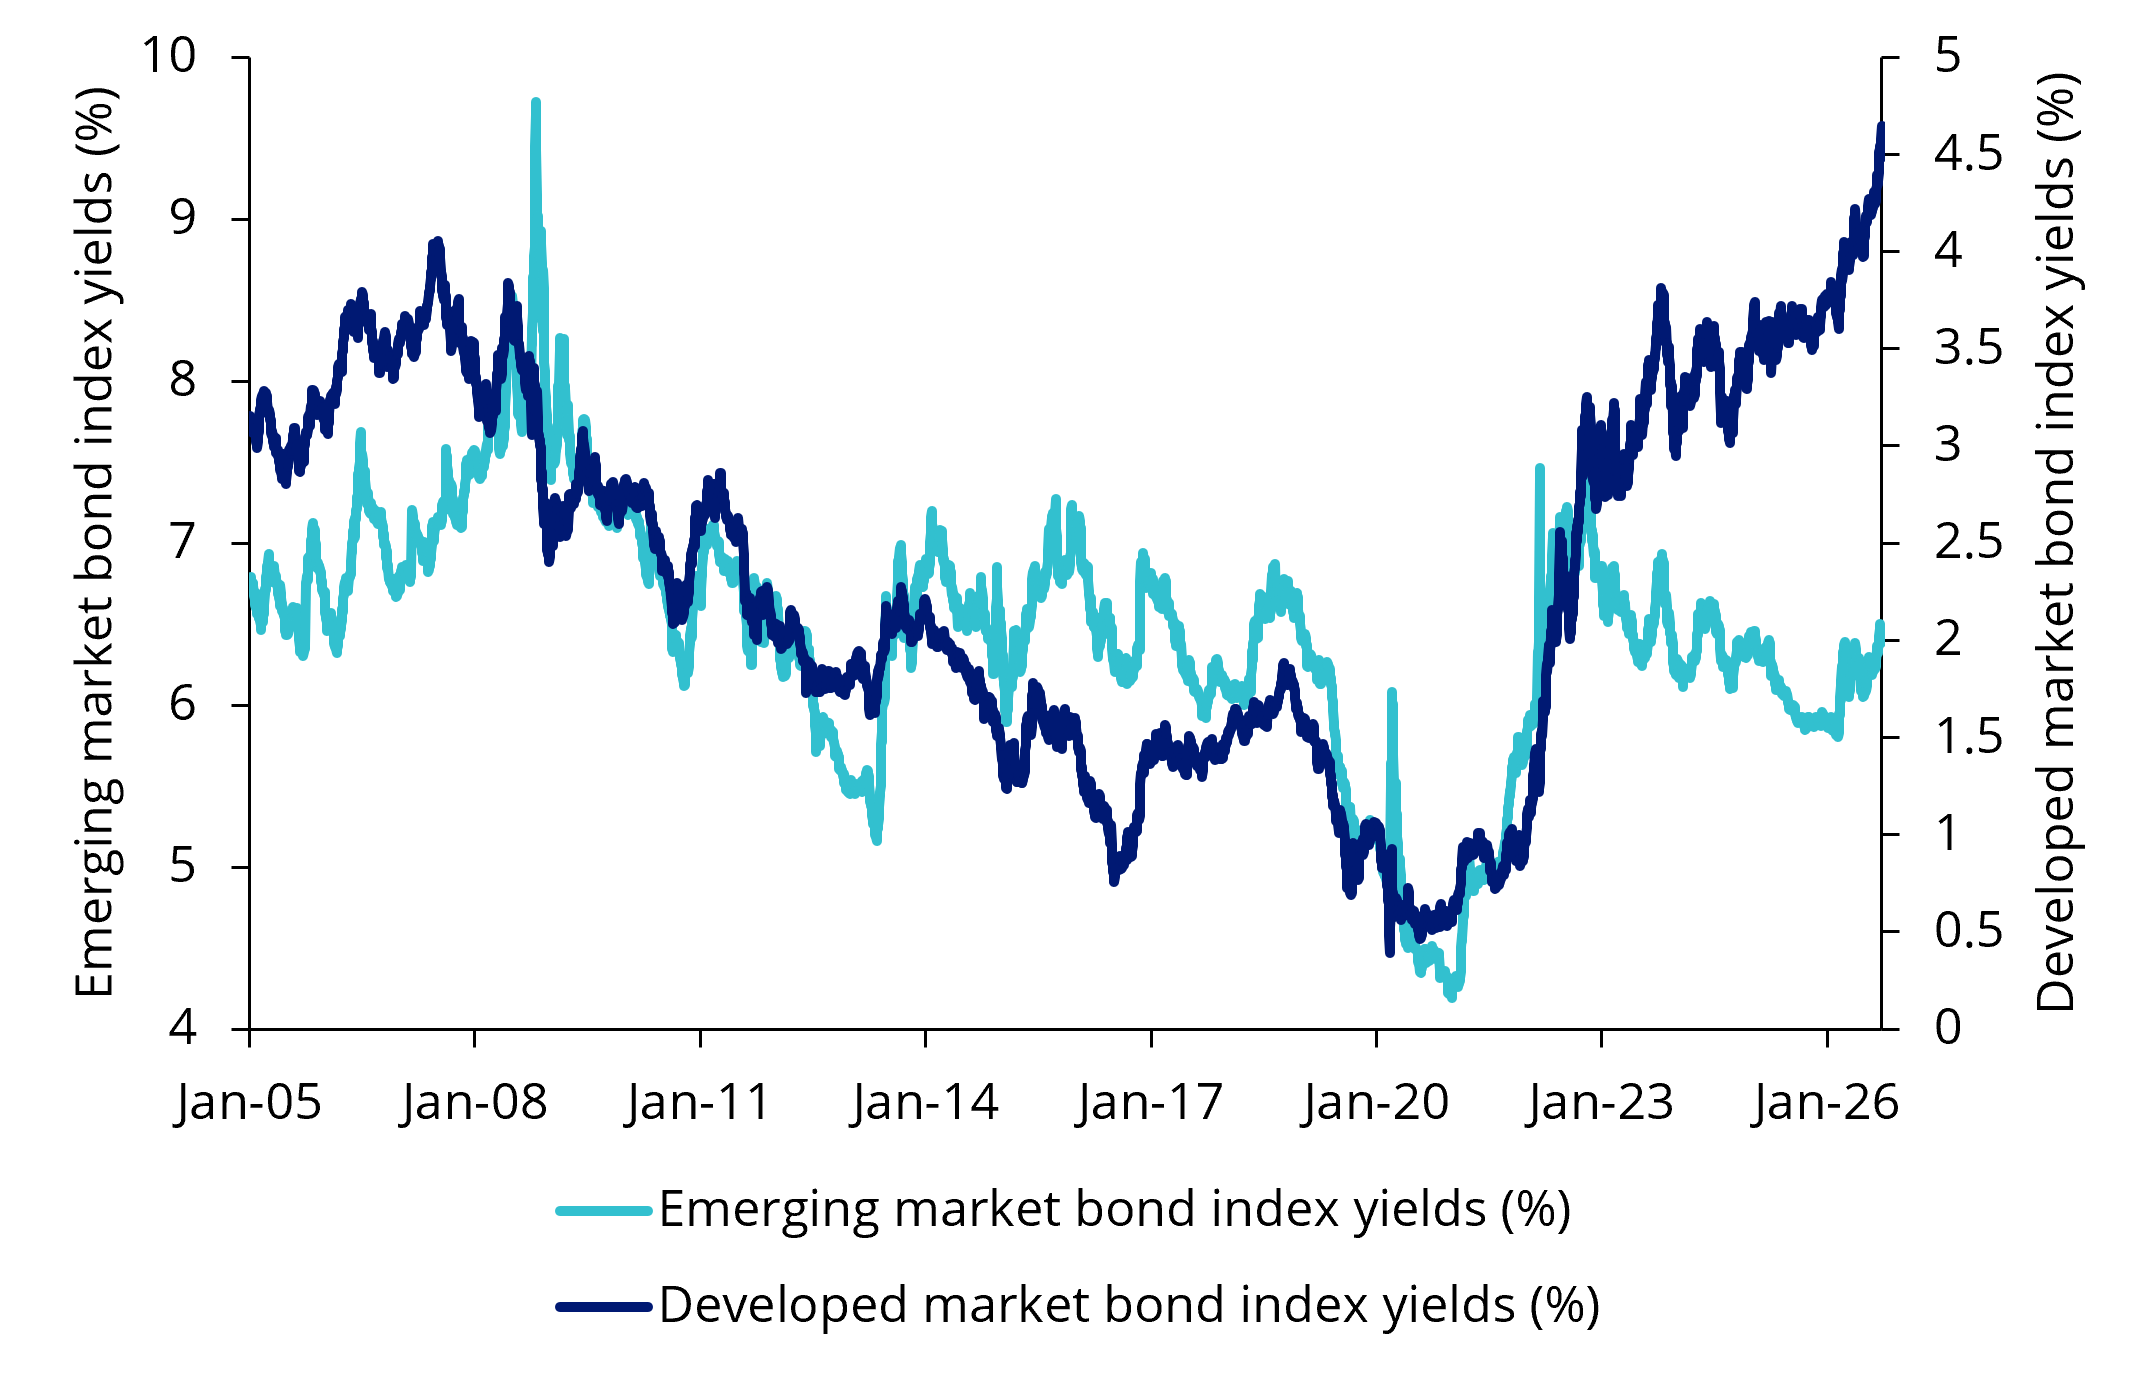
Source: Bloomberg, data spans 3 January 2005 to 25 September 2026. Past performance is not indicative of future performance. You cannot invest directly in an index. Developed market bond index yields represented by J.P. Morgan Government Bond Index (GBI). Emerging market bond index yields represented by JPMorgan GBI-EM Global Diversified Composite Index.
For an Australian investor watching local and US bond yields surge to post-Global Financial Crisis era highs, the distinction matters. Emerging market bonds remain exposed to global shocks, but their changed response is rooted in refreshed priorities around domestic inflation, public finances and economic policy.
Looking beyond developed market bonds could broaden the sources of income in a portfolio and the economic forces influencing its returns.
The divergence between individual economies is not arbitrary
Emerging markets have been outperforming as a group, but there is a lot of variation between individual emerging economies. We believe this divergence is not arbitrary.
Year-to-date, outliers on both ends of the emerging market universe reflect actual or anticipated policy shifts, especially on the fiscal side as well as domestic political risks and country-specific vulnerabilities.
Chart 2: EM and DM yield to maturity change: 31 Dec 2025 to 11 Sep 2026
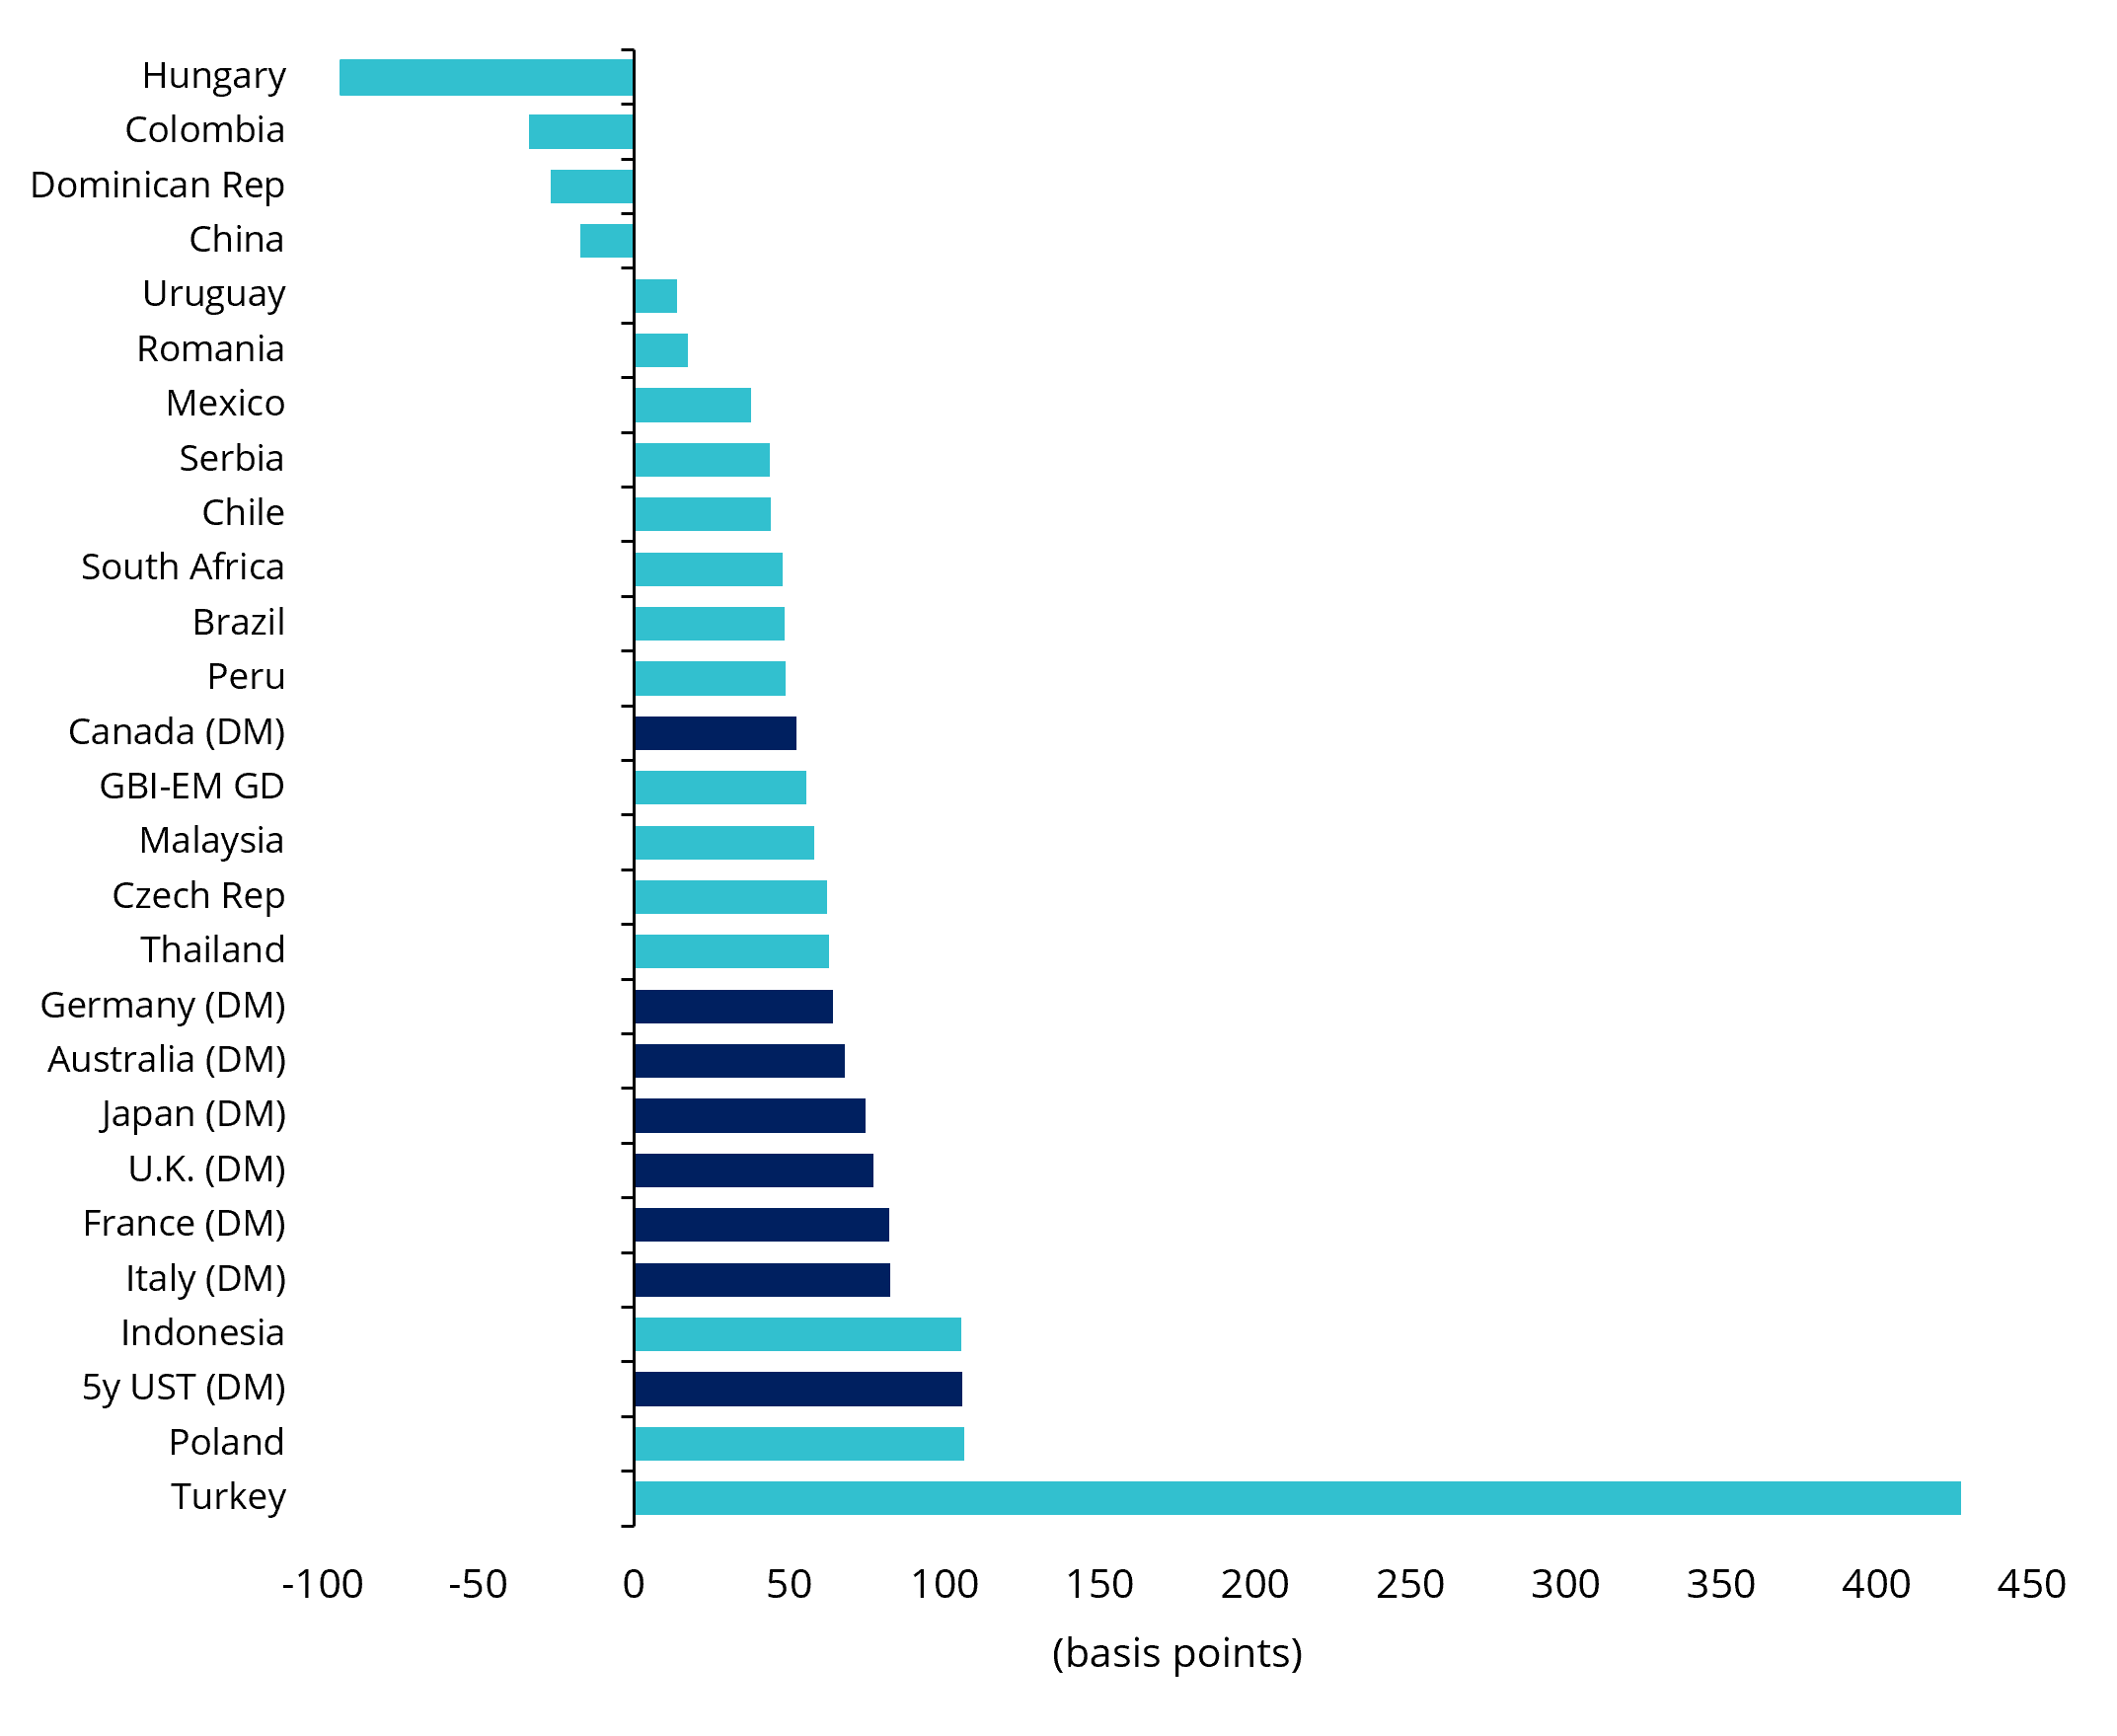
Source: Bloomberg, as at 11 September 2026. Past performance is not indicative of future performance. GBI-EM is the local currency index, J.P. Morgan Government Bond Index-Emerging Markets (GBI-EM). 5 year UST is Generic 5-year U.S. Treasury Benchmark. EM yields: J.P. Morgan GBI-EM Index, DM yields: J.P. Morgan GBI Index Global. Dark bars denote developed markets. Bonds referenced are the benchmark sovereign debt of each country. You cannot invest directly in an index.
Hungary is a poster child for how domestic policy changes can create opportunities in emerging market bonds. Around April’s election, local bond yields declined relative to regional peers, reflecting investor optimism about the prospect of euro adoption and stronger fiscal discipline. The central bank’s decision to lower its inflation target from 3% to 2.5%, effective January 2028, could lend further support.
Elsewhere, Colombia illustrates how expectations of policy change can lead to a sizeable rally in local rates and its currency even before reforms are delivered. Investors have largely looked beyond the fiscal problems revealed by the new administration, while a stronger peso has driven most of the year’s local returns.
In contrast, outliers such as Indonesia, Poland, and Turkey reflect the market’s concerns about the policy direction.
Poland’s fiscal deficit has widened to around 7%, meaning local-currency bond yields now embed a higher fiscal risk premium.
Turkey’s last mile disinflation is progressing very slowly, partly because of the Iran war-induced energy shock and partly because of the noisy domestic political scene.
And while Indonesia’s government is eyeing a smaller budget deficit and has been appointing credible technocrats to top positions at key financial institutions, the market will require proof of results before yields move.
All these examples make country selection central to the investment case: a high yield is more compelling but only when the borrower’s prospects are improving.
Lower debt will be key for evaluating fiscal impact of higher rates
The key tenet of the ‘EM Exceptionalism’ thesis, as explained in our June 2025 whitepaper, is simple: many emerging economies have stronger fundamentals and sounder policies than their developed economy peers.
Lower government debt gives many emerging economies greater flexibility to manage inflation. Now that these governments have less debt to service, higher interest rates place less strain on public finances, giving central banks more room to keep inflation in check without jeopardising government funding.
The accompanying chart highlights the comparatively modest interest burdens in emerging Asia and EMEA (Europe, Middle East and Africa), where net interest payments absorb a smaller share of GDP than in Latin America or the US. In the case of the US, the rising interest bill makes tighter monetary policy more costly for its federal budget.
Chart 3: Asian and EMEA net interest outlays well below that of US and Latin America
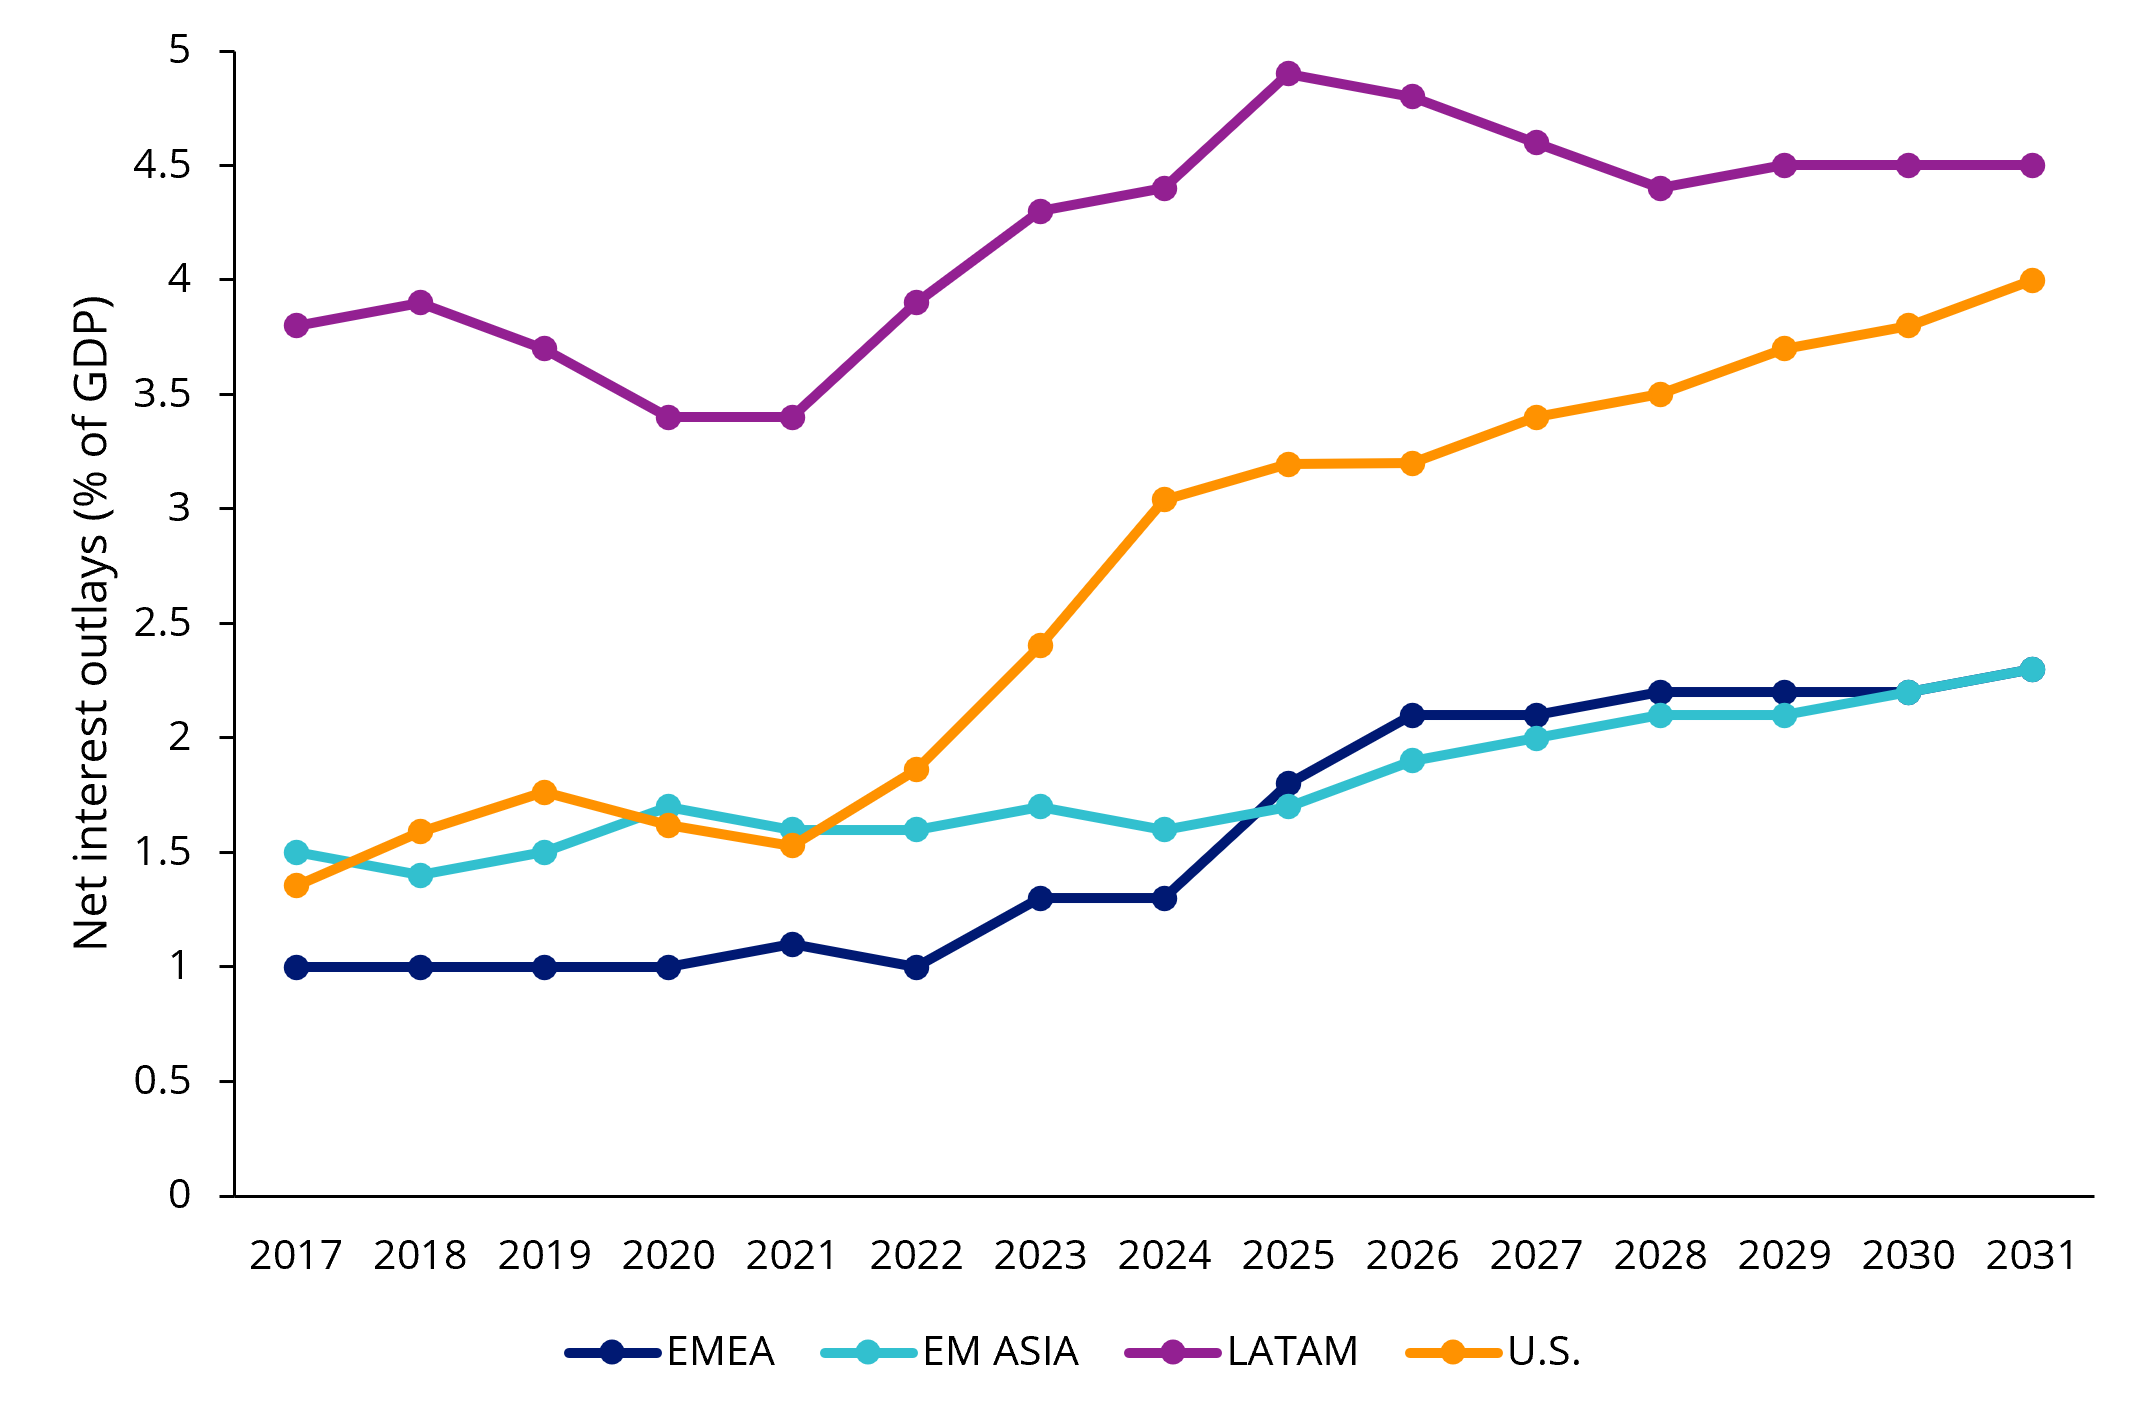
Source: CBO (for U.S.); IMF (Fiscal Report), as at September 2026. Figures beyond 2026 are forecasts.
Local currency bonds now becoming less volatile
The changing volatility profile is, in our view, another manifestation of the ‘EM Exceptionalism’ thesis. The higher volatility seen in emerging market bonds in the pre-2023 period reflected the fragility that once defined investing in this asset class. But that relationship has since flipped.
Since then, EM local bonds have delivered better returns and carry than their DM counterparts while remaining consistently less volatile. We argue this regime shift is still underappreciated even as it passed its greatest test during the Iran War.
Chart 4: EM local bonds vs DM sovereigns, 360-day total return volatility (%)
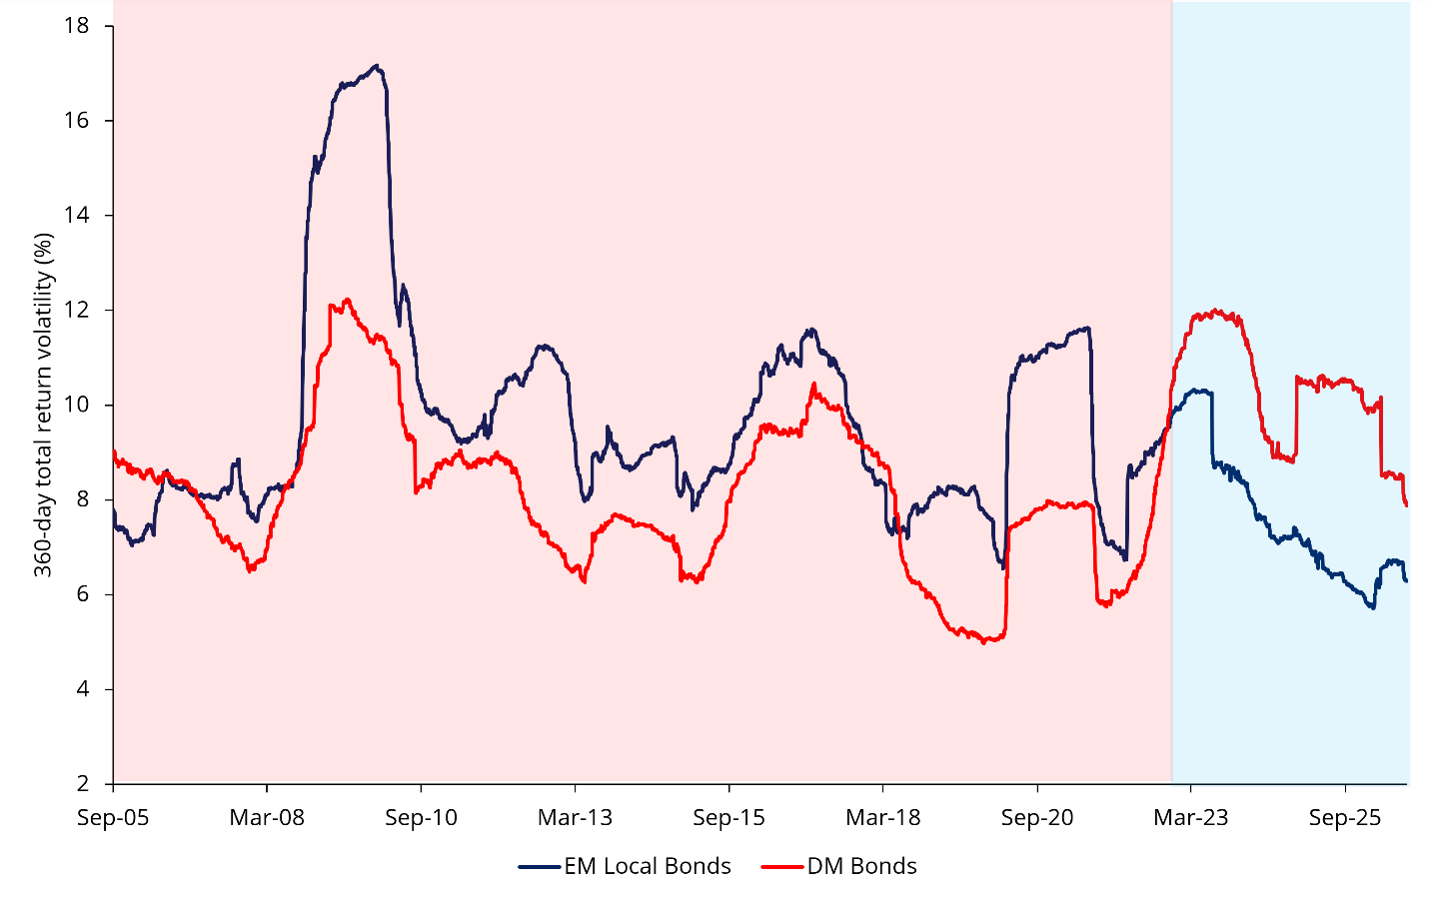
Source: VanEck Research, Bloomberg. Data spans 1 January 2004 to 11 September 2026. EM local bonds represented by J.P. Morgan GBI-EM Global Diversified Index. DM bonds represented by J.P. Morgan GBI-DM Global ex-US Diversified Index. Red shaded periods were when EM bonds were more volatile than DM counterparts. Blue shaded periods were when EM bonds were less volatile than DM counterparts. Past performance is not indicative of future performance. You cannot invest directly in an index.
Several developments challenge the assumption that developed markets offer stronger policy management. The global financial crisis, Eurozone debt crisis and Britain’s 2022 bond market turmoil all exposed vulnerabilities in economies long regarded as safe.
Meanwhile, many emerging economies have matured. Their central banks responded to the 2021 post-pandemic inflation surge by raising interest rates well before their developed market counterparts. These experiences strengthen the case for assessing countries on their fiscal and monetary discipline, rather than relying on the old label.
At the same time, the deepening of domestic investor bases in emerging markets have provided a powerful stabilising force for EM debt, as pension funds, insurance companies and retail investors alike now absorb shocks that once upon a time would have triggered outflows and ensuing spikes in volatility. The result is a structurally lower volatility profile for EM debt, and with it, a genuine shift in the underlying fundamentals.
Lastly, the major ratings agencies – S&P Global, Fitch and Moody’s – are taking notes. Since 2024, there have been more sovereign upgrades, not downgrades from all three firms.
How the case for EM exceptionalism translates to portfolios
Improving fundamentals and policies combined with higher relative and lower volatility have had a profound impact on EM debt’s position in portfolio allocations.
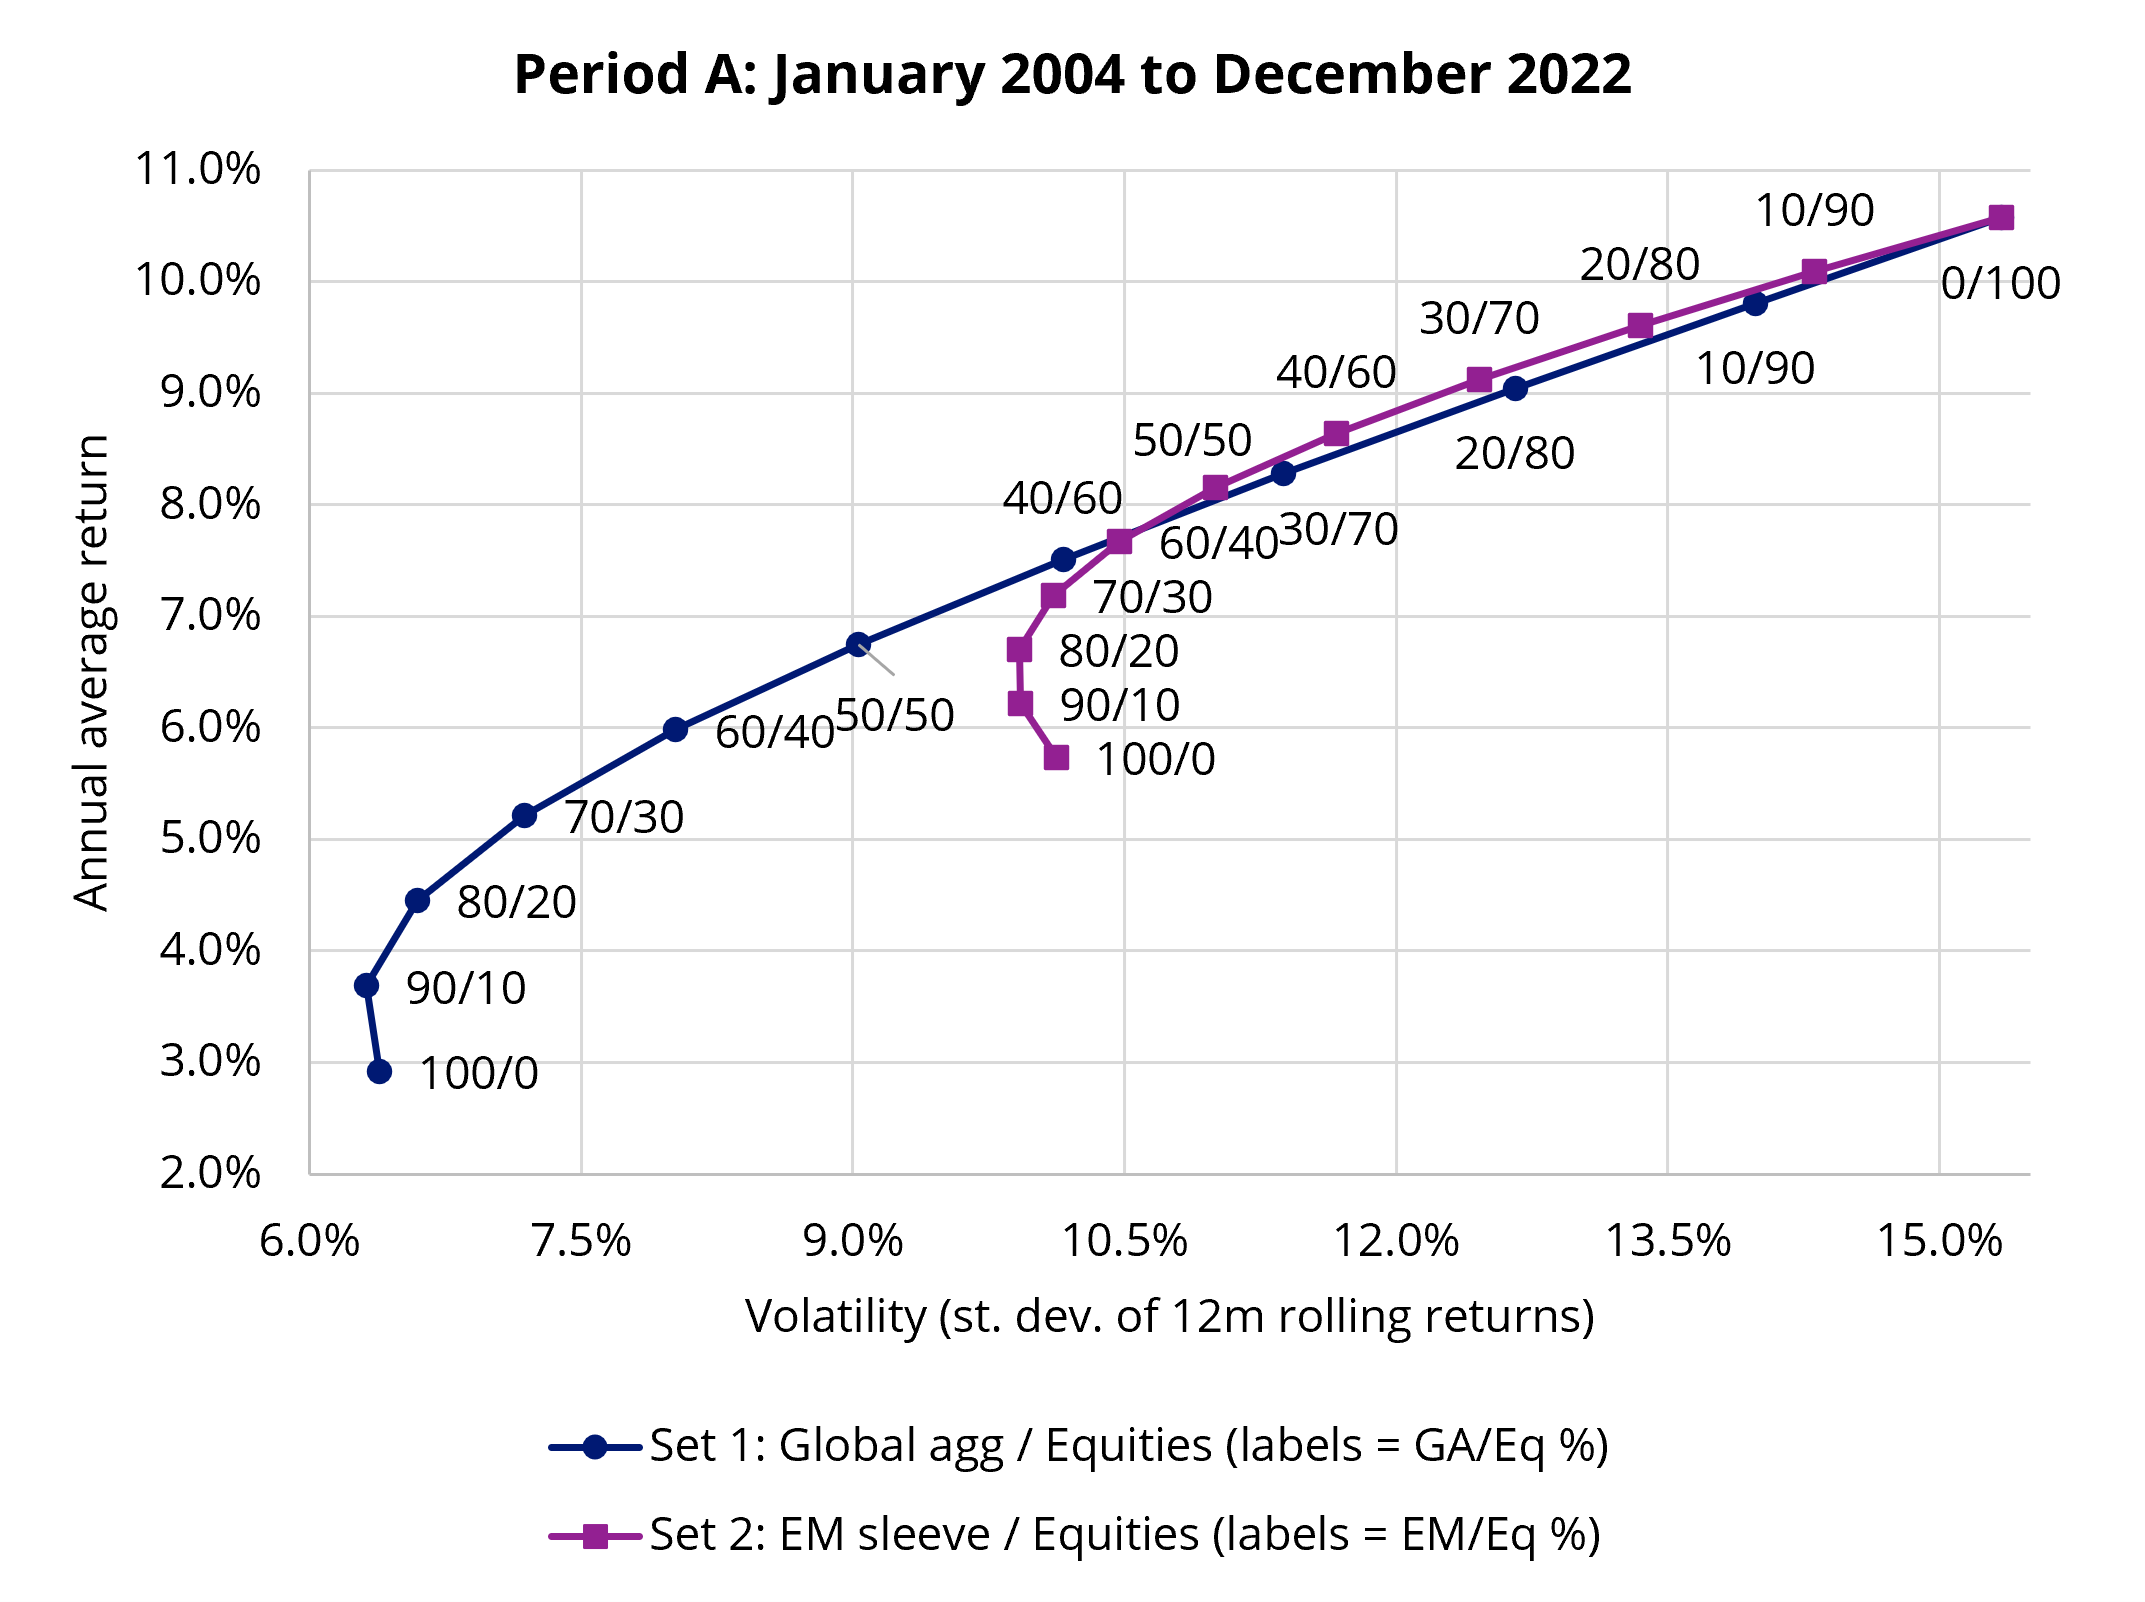
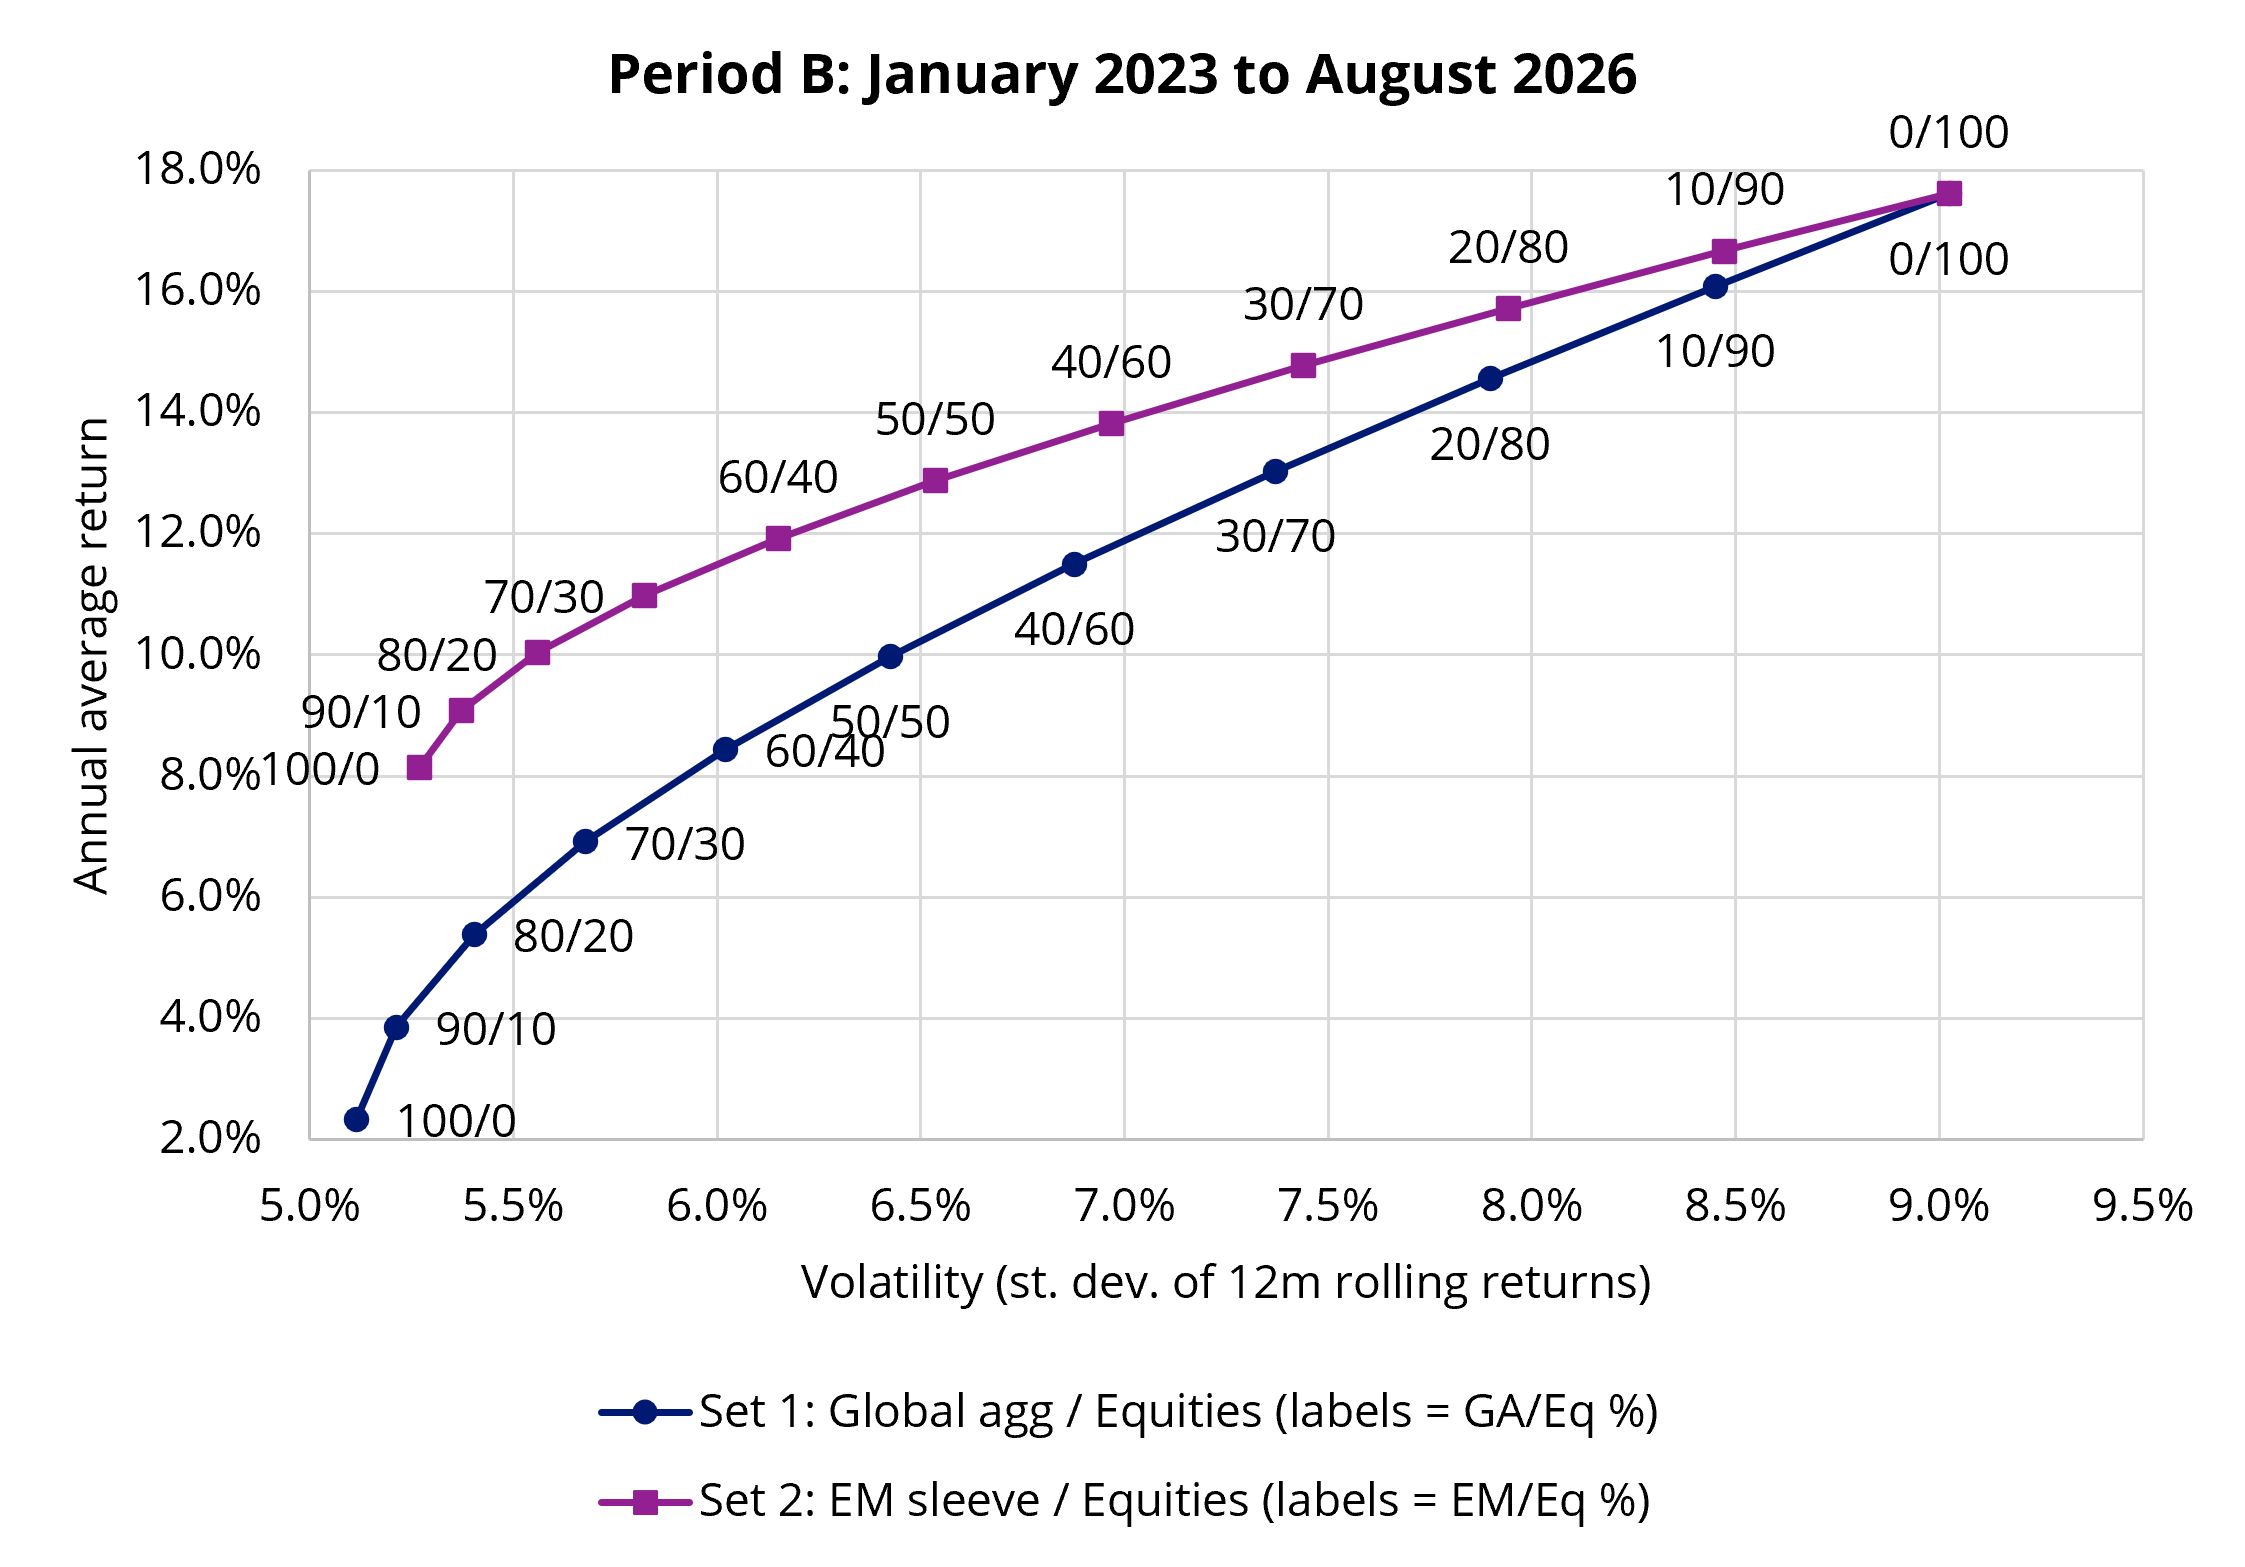
To illustrate this, in the charts below, we build a simple efficient frontier using the S&P 500 as a proxy for equities and compare two bond alternatives – all DM and all EM (EM is a 50/50 split between local currency and sovereign bonds). The efficient frontier describes the best combinations of assets available for a given level of risk.
Below we compare two eras along the shift in the volatility profile: (1) a long history spanning 2004 to 2022 and (2) the recent stretch from 2023 to August 2026.
The blue line combines developed market bonds with shares, while the purple line combines emerging market bonds with shares. Each dot or square represents a different mix: “60/40”, for example, means 60% bonds and 40% shares.
You can see, in the first chart a 50/50 allocation to global bonds and equities returned above 6.5% per annum, with a standard deviation (volatility) of 9%. A 50/50 allocation of emerging market bonds and equities returned 8% per annum, but the volatility was around 11%.
Higher points indicate higher average annual returns while points further left indicate smaller fluctuations in returns. Investors therefore want to move towards the top left: more return for the same or lesser amount of volatility.
In the earlier period, EM bonds could already lift the efficient frontier of a traditional equity/bond portfolio. However, this was largely a proposition for niche “thrill-seekers”, as the outperformance would only show at higher volatility levels, putting this asset class out of reach for more conservative investors.
Charts 5 & 6: An investment in emerging market bonds may improve total portfolio returns without increasing risk
 |
 |
Source: VanEck Research, Bloomberg. As at 22 September 2026. Past performance is not indicative of future performance. You cannot invest in a index.
The recent period tells a different story. EM bonds are now lifting the efficient frontier at lower volatility levels, making the case for EM debt more compelling for mainstream investors. And volatility-adjusted returns for the EM-anchored equity/bond portfolio are meaningfully higher than for its DM-based equivalent, across the full range of equity/bond combinations.
These charts do not guarantee the same outcome will occur again, but they may give investors a reason to reconsider an asset class they once dismissed as too adventurous or risky.


Published: 01 October 2026
Any views expressed are opinions of the author at the time of writing and is not a recommendation to act.
VanEck Investments Limited (ACN 146 596 116 AFSL 416755) (VanEck) is the issuer and responsible entity of all VanEck exchange traded funds (Funds) trading on the ASX. This information is general in nature and not personal advice, it does not take into account any person’s financial objectives, situation or needs. You should consider whether or not an investment in any Fund is appropriate for you. Investments in a Fund involve risks associated with financial markets. These risks vary depending on a Fund’s investment objective. Refer to the applicable product disclosure statement (PDS) and target market determination (TMD) available at vaneck.com.au for more details. Investment returns and capital are not guaranteed.